OpenTelemetry Go distro for Uptrace

This document explains how to configure OpenTelemetry Go SDK to export spans and metrics to Uptrace using OTLP/gRPC.
To learn about OpenTelemetry API, see OpenTelemetry Go Tracing API and OpenTelemetry Go Metrics API.
Uptrace Go
uptrace-go is a thin wrapper over opentelemetry-go that configures OpenTelemetry SDK to export data to Uptrace. It does not add any new functionality and is provided only for your convenience.
To install uptrace-go:
go get github.com/uptrace/uptrace-go
Configuration
You can configure Uptrace client using a DSN (Data Source Name) from the project settings page.
import "github.com/uptrace/uptrace-go/uptrace"

uptrace.ConfigureOpentelemetry(
    // copy your project DSN here or use UPTRACE_DSN env var
    //uptrace.WithDSN("https://token@api.uptrace.dev/project_id"),

	uptrace.WithServiceName("myservice"),
	uptrace.WithServiceVersion("v1.0.0"),
	uptrace.WithDeploymentEnvironment("production"),
)
You can find the full list of available options at pkg.go.dev.
| Option | Description |
|---|---|
WithDSN | A data source that specifies Uptrace project credentials. For example, https://token@api.uptrace.dev/project_id. |
WithServiceName | service.name resource attribute. For example, myservice. |
WithServiceVersion | service.version resource attribute. For example, 1.0.0. |
WithDeploymentEnvironment | deployment.environment resource attribute. For example, production. |
WithResourceAttributes | Any other resource attributes. |
WithResourceDetectors | Configures additional resource detectors, for example, EC2 detector or GCE detector. |
WithResource | Resource contains attributes representing an entity that produces telemetry. Resource attributes are copied to all spans and events. |
You can also use environment variables to configure the client:
| Env var | Description |
|---|---|
UPTRACE_DSN | A data source that is used to connect to uptrace.dev. For example, https://<token>@uptrace.dev/<project_id>. |
OTEL_RESOURCE_ATTRIBUTES | Key-value pairs to be used as resource attributes. For example, service.name=myservice,service.version=1.0.0. |
OTEL_SERVICE_NAME=myservice | Sets the value of the service.name resource attribute. Takes precedence over OTEL_RESOURCE_ATTRIBUTES. |
OTEL_PROPAGATORS | Propagators to be used as a comma separated list. The default is tracecontext,baggage. |
See OpenTelemetry documentation for details.
Quickstart
Spend 5 minutes to install OpenTelemetry distro, generate your first trace, and click the link in your terminal to view the trace.
Step 0. Create an Uptrace project to obtain a DSN (connection string), for example,
https://token@api.uptrace.dev/project_id.Step 1. Install uptrace-go:
go get github.com/uptrace/uptrace-go
- Step 2. Copy the code to
main.goreplacing the DSN:
package main

import (
	"context"
	"errors"
	"fmt"

	"go.opentelemetry.io/otel"
	"go.opentelemetry.io/otel/attribute"
	"go.opentelemetry.io/otel/codes"
	"go.opentelemetry.io/otel/trace"

	"github.com/uptrace/uptrace-go/uptrace"
)

func main() {
	ctx := context.Background()

	// Configure OpenTelemetry with sensible defaults.
	uptrace.ConfigureOpentelemetry(
		// copy your project DSN here or use UPTRACE_DSN env var
		// uptrace.WithDSN("https://token@api.uptrace.dev/project_id"),

		uptrace.WithServiceName("myservice"),
		uptrace.WithServiceVersion("1.0.0"),
	)
	// Send buffered spans and free resources.
	defer uptrace.Shutdown(ctx)

	// Create a tracer. Usually, tracer is a global variable.
	tracer := otel.Tracer("app_or_package_name")

	// Create a root span (a trace) to measure some operation.
	ctx, main := tracer.Start(ctx, "main-operation")
	// End the span when the operation we are measuring is done.
	defer main.End()

	// The passed ctx carries the parent span (main).
	// That is how OpenTelemetry manages span relations.
	_, child1 := tracer.Start(ctx, "GET /posts/:id")
	child1.SetAttributes(
		attribute.String("http.method", "GET"),
		attribute.String("http.route", "/posts/:id"),
		attribute.String("http.url", "http://localhost:8080/posts/123"),
		attribute.Int("http.status_code", 200),
	)
	if err := errors.New("dummy error"); err != nil {
		child1.RecordError(err, trace.WithStackTrace(true))
		child1.SetStatus(codes.Error, err.Error())
		child1.End()
	}

	_, child2 := tracer.Start(ctx, "SELECT")
	child2.SetAttributes(
		attribute.String("db.system", "mysql"),
		attribute.String("db.statement", "SELECT * FROM posts LIMIT 100"),
	)
	child2.End()

	fmt.Printf("trace: %s\n", uptrace.TraceURL(main))
}
- Step 3. Run the code to get a link for the generated trace:
go run main.go
trace: https://app.uptrace.dev/traces/<trace_id>
- Step 4. Follow the link to view the trace:
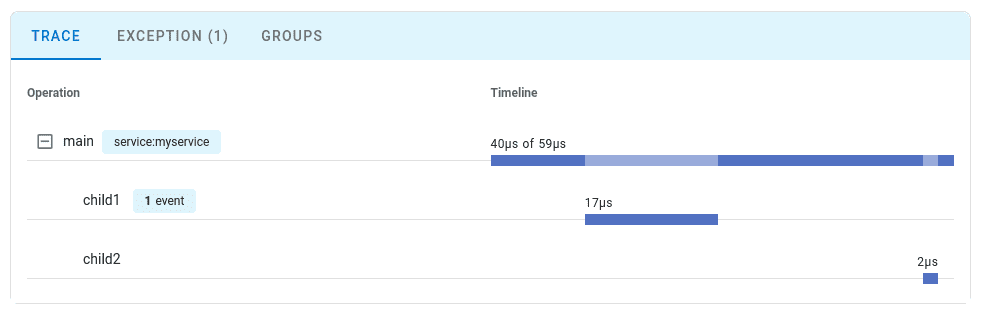
Already using OTLP exporter?
If you are already using OTLP exporter, you can continue to use it with Uptrace by changing some configuration options.
To maximize performance and efficiency, consider the following recommendations when configuring OpenTelemetry SDK.
| Recommendation | Signals | Significance |
|---|---|---|
Use BatchSpanProcessor to export multiple spans in a single request. | All | Essential |
Enable gzip compression to compress the data before sending and reduce the traffic cost. | All | Essential |
Prefer delta metrics temporality, because such metrics are smaller and Uptrace must convert cumulative metrics to delta anyway. | Metrics | Recommended |
| Use AWS X-Ray ID generator for OpenTelemetry. | Traces, Logs | Optional |
To configure OpenTelemetry to send data to Uptrace, use the provided endpoint and pass the DSN via uptrace-dsn header:
# Uncomment the appropriate protocol for your programming language.
# Only for OTLP/gRPC
#export OTEL_EXPORTER_OTLP_ENDPOINT="https://otlp.uptrace.dev:4317"
# Only for OTLP/HTTP
#export OTEL_EXPORTER_OTLP_ENDPOINT="https://otlp.uptrace.dev"

# Pass Uptrace DSN in gRPC/HTTP headers.
export OTEL_EXPORTER_OTLP_HEADERS="uptrace-dsn=https://token@api.uptrace.dev/project_id"

# Enable gzip compression.
export OTEL_EXPORTER_OTLP_COMPRESSION=gzip

# Enable exponential histograms.
export OTEL_EXPORTER_OTLP_METRICS_DEFAULT_HISTOGRAM_AGGREGATION=BASE2_EXPONENTIAL_BUCKET_HISTOGRAM

# Prefer delta temporality.
export OTEL_EXPORTER_OTLP_METRICS_TEMPORALITY_PREFERENCE=DELTA
When configuring BatchSpanProcessor, use the following settings:
# Maximum allowed time to export data in milliseconds.
export OTEL_BSP_EXPORT_TIMEOUT=10000

# Maximum batch size.
# Using larger batch sizes can be problematic,
# because Uptrace rejects requests larger than 20MB.
export OTEL_BSP_MAX_EXPORT_BATCH_SIZE=10000

# Maximum queue size.
# Increase queue size if you have lots of RAM, for example,
# `10000 * number_of_gigabytes`.
export OTEL_BSP_MAX_QUEUE_SIZE=30000

# Max concurrent exports.
# Setting this to the number of available CPUs might be a good idea.
export OTEL_BSP_MAX_CONCURRENT_EXPORTS=2
Exporting traces
Here is how you can export traces to Uptrace following the recommendations above:
package main

import (
	"context"
	"fmt"
	"os"

	"go.opentelemetry.io/contrib/propagators/aws/xray"
	"go.opentelemetry.io/otel"
	"go.opentelemetry.io/otel/attribute"
	"go.opentelemetry.io/otel/exporters/otlp/otlptrace/otlptracegrpc"
	"go.opentelemetry.io/otel/sdk/resource"
	sdktrace "go.opentelemetry.io/otel/sdk/trace"
	"google.golang.org/grpc/credentials"
	"google.golang.org/grpc/encoding/gzip"
)

func main() {
	ctx := context.Background()

	dsn := os.Getenv("UPTRACE_DSN")
	if dsn == "" {
		panic("UPTRACE_DSN environment variable is required")
	}
	fmt.Println("using DSN:", dsn)

	// Create credentials using system certificates.
	creds := credentials.NewClientTLSFromCert(nil, "")
	exporter, err := otlptracegrpc.New(
		ctx,
		otlptracegrpc.WithEndpoint("otlp.uptrace.dev:4317"),
		otlptracegrpc.WithTLSCredentials(creds),
		otlptracegrpc.WithHeaders(map[string]string{
			// Set the Uptrace DSN here or use UPTRACE_DSN env var.
			"uptrace-dsn": dsn,
		}),
		otlptracegrpc.WithCompressor(gzip.Name),
	)
	if err != nil {
		panic(err)
	}

	bsp := sdktrace.NewBatchSpanProcessor(exporter,
		sdktrace.WithMaxQueueSize(1000),
		sdktrace.WithMaxExportBatchSize(1000))
	// Call shutdown to flush the buffers when program exits.
	defer bsp.Shutdown(ctx)

	resource, err := resource.New(ctx,
		resource.WithFromEnv(),
		resource.WithTelemetrySDK(),
		resource.WithHost(),
		resource.WithAttributes(
			attribute.String("service.name", "myservice"),
			attribute.String("service.version", "1.0.0"),
		))
	if err != nil {
		panic(err)
	}

	tracerProvider := sdktrace.NewTracerProvider(
		sdktrace.WithResource(resource),
		sdktrace.WithIDGenerator(xray.NewIDGenerator()),
	)
	tracerProvider.RegisterSpanProcessor(bsp)

	// Install our tracer provider and we are done.
	otel.SetTracerProvider(tracerProvider)

	tracer := otel.Tracer("app_or_package_name")
	ctx, span := tracer.Start(ctx, "main")
	defer span.End()

	fmt.Printf("trace: https://app.uptrace.dev/traces/%s\n", span.SpanContext().TraceID())
}
Exporting metrics
Here is how you can export metrics to Uptrace following the recommendations above:
package main

import (
	"context"
	"fmt"
	"os"
	"time"

	"go.opentelemetry.io/otel"
	"go.opentelemetry.io/otel/attribute"
	"go.opentelemetry.io/otel/exporters/otlp/otlpmetric/otlpmetricgrpc"
	"go.opentelemetry.io/otel/metric"
	sdkmetric "go.opentelemetry.io/otel/sdk/metric"
	"go.opentelemetry.io/otel/sdk/metric/metricdata"
	"go.opentelemetry.io/otel/sdk/resource"
	"google.golang.org/grpc/encoding/gzip"
)

func main() {
	ctx := context.Background()

	dsn := os.Getenv("UPTRACE_DSN")
	if dsn == "" {
		panic("UPTRACE_DSN environment variable is required")
	}
	fmt.Println("using DSN:", dsn)

	exporter, err := otlpmetricgrpc.New(ctx,
		otlpmetricgrpc.WithEndpoint("otlp.uptrace.dev:4317"),
		otlpmetricgrpc.WithHeaders(map[string]string{
			// Set the Uptrace DSN here or use UPTRACE_DSN env var.
			"uptrace-dsn": dsn,
		}),
		otlpmetricgrpc.WithCompressor(gzip.Name),
		otlpmetricgrpc.WithTemporalitySelector(preferDeltaTemporalitySelector),
	)
	if err != nil {
		panic(err)
	}

	reader := sdkmetric.NewPeriodicReader(
		exporter,
		sdkmetric.WithInterval(15*time.Second),
	)

	resource, err := resource.New(ctx,
		resource.WithFromEnv(),
		resource.WithTelemetrySDK(),
		resource.WithHost(),
		resource.WithAttributes(
			attribute.String("service.name", "myservice"),
			attribute.String("service.version", "1.0.0"),
		))
	if err != nil {
		panic(err)
	}

	provider := sdkmetric.NewMeterProvider(
		sdkmetric.WithReader(reader),
		sdkmetric.WithResource(resource),
	)
	otel.SetMeterProvider(provider)

	meter := provider.Meter("app_or_package_name")
	counter, _ := meter.Int64Counter(
		"uptrace.demo.counter_name",
		metric.WithUnit("1"),
		metric.WithDescription("counter description"),
	)

	fmt.Println("exporting data to Uptrace...")
	for {
		counter.Add(ctx, 1)
		time.Sleep(time.Millisecond)
	}
}

func preferDeltaTemporalitySelector(kind sdkmetric.InstrumentKind) metricdata.Temporality {
	switch kind {
	case sdkmetric.InstrumentKindCounter,
		sdkmetric.InstrumentKindObservableCounter,
		sdkmetric.InstrumentKindHistogram:
		return metricdata.DeltaTemporality
	default:
		return metricdata.CumulativeTemporality
	}
}
Serverless
AWS Lambda
Vercel
On Vercel, you need to configure OpenTelemetry in the init function and ForceFlush spans when the Vercel handler exits.
package handler

import (
	"fmt"
	"net/http"

    "go.opentelemetry.io/otel"
	"github.com/uptrace/uptrace-go/uptrace"
)

var tracer = otel.Tracer("app_or_package_name")

func init() {
	uptrace.ConfigureOpentelemetry(...)
}

func Handler(w http.ResponseWriter, req *http.Request) {
	ctx := req.Context()

	// Flush buffered spans.
	defer uptrace.ForceFlush(ctx)

	ctx, span := tracer.Start(ctx, "handler-name")
	defer span.End()

	fmt.Fprintf(w, "<h1>Hello from Go!</h1>")
}
Sampling
You can reduce the number of created (sampled) spans by configuring head-based sampling:
import "go.opentelemetry.io/contrib/samplers/probability/consistent"

sampler := consistent.ParentProbabilityBased(
	consistent.ProbabilityBased(0.5), // sample 50% of traces
)

uptrace.ConfigureOpentelemetry(
	uptrace.WithTraceSampler(sampler),

	// Other options
)
By default, uptrace-go samples all spans.
Resource detectors
By default, uptrace-go uses host and environment resource detectors, but you can configure it to use additional detectors, for example:
import (
	"github.com/uptrace/uptrace-go/uptrace"
	"go.opentelemetry.io/contrib/detectors/aws/ec2"
)

uptrace.ConfigureOpentelemetry(
	// copy your project DSN here or use UPTRACE_DSN env var
	//uptrace.WithDSN("https://token@api.uptrace.dev/project_id"),

	uptrace.WithServiceName("myservice"),
	uptrace.WithServiceVersion("1.0.0"),

	uptrace.WithResourceDetectors(ec2.NewResourceDetector()),
)
AWS
See AWS detectors.
EC2
import "go.opentelemetry.io/contrib/detectors/aws/ec2"

ec2ResourceDetector := ec2.NewResourceDetector()
ECS
import "go.opentelemetry.io/contrib/detectors/aws/ecs"

ecsResourceDetector := ecs.NewResourceDetector()
EKS
import "go.opentelemetry.io/contrib/detectors/aws/eks"

eksResourceDetector := eks.NewResourceDetector()
Google Cloud
See GCP detectors.
Cloud Run
import "go.opentelemetry.io/contrib/detectors/gcp"

cloudRunResourceDetector := gcp.NewCloudRun()
GCE
import "go.opentelemetry.io/contrib/detectors/gcp"

gceResourceDetector := gcp.GCE{}
GKE
import "go.opentelemetry.io/contrib/detectors/gcp"

gkeResourceDetector := gcp.GKE{}
Errors monitoring
To monitor errors with a stack trace, use the RecordError API:
import (
	"go.opentelemetry.io/otel/codes"
	"go.opentelemetry.io/otel/trace"
)

ctx, span := tracer.Start(ctx, "operation-name")
defer span.End()

span.RecordError(errors.New("oh my"), trace.WithStackTrace(true))
span.SetStatus(codes.Error, err.Error())
See OpenTelemetry Go Tracing API for details.
Logs monitoring
To monitor logs, use OpenTelemetry instrumentations for popular logging libraries:
If that is not possible, see Monitoring Logs for more options such as Vector or FluentBit.
SDK logging
By default, OpenTelemetry Go SDK logs error messages to stderr. You can discard or redirect those logs by providing an error handler:
import "go.opentelemetry.io/otel"

otel.SetErrorHandler(otel.ErrorHandlerFunc(func(err error) {
    // ignore the error
}))
What's next?
Next, instrument more operations to get a more detailed picture. Try to prioritize network calls, disk operations, database queries, error and logs.
You can also create your own instrumentations using OpenTelemetry Go Tracing API.