OpenTelemetry Go Tracing API

This document teaches how to use OpenTelemetry Go API. To learn how to install and configure OpenTelemetry Go SDK, see Getting started with OpenTelemetry Go.
Installation
OpenTelemetry-Go is the Go implementation of OpenTelemetry. It provides OpenTelemetry Tracing API which you can use to instrument your application with OpenTelemetry tracing.
go get go.opentelemetry.io/otel
Quickstart
Step 1. Let's instrument the following function:
func insertUser(ctx context.Context, user *User) error {
	if _, err := db.NewInsert().Model(user).Exec(ctx); err != nil {
		return err
	}
	return nil
}
Step 2. Wrap the operation with a span:
import "go.opentelemetry.io/otel"

var tracer = otel.Tracer("app_or_package_name")

func insertUser(ctx context.Context, user *User) error {
	ctx, span := tracer.Start(ctx, "insert-user")
	defer span.End()

	if _, err := db.NewInsert().Model(user).Exec(ctx); err != nil {
		return err
	}
	return nil
}
Step 3. Record errors and set status code:
func insertUser(ctx context.Context, user *User) error {
	ctx, span := tracer.Start(ctx, "insert-user")
	defer span.End()

	if _, err := db.NewInsert().Model(user).Exec(ctx); err != nil {
		span.RecordError(err)
		span.SetStatus(codes.Error, err.Error())
		return err
	}
	return nil
}
import "github.com/uptrace/opentelemetry-go-extra/tree/main/otelzap"

func insertUser(ctx context.Context, user *User) error {
	ctx, span := tracer.Start(ctx, "insert-user")
	defer span.End()

	if _, err := db.NewInsert().Model(user).Exec(ctx); err != nil {
		// Rely on Zap to record the error and set status code.
		otelzap.L().Ctx(ctx).Error("insert failed", zap.Error(err))
		return err
	}
	return nil
}
import "github.com/uptrace/opentelemetry-go-extra/tree/main/otellogrus"

func insertUser(ctx context.Context, user *User) error {
	ctx, span := tracer.Start(ctx, "insert-user")
	defer span.End()

	if _, err := db.NewInsert().Model(user).Exec(ctx); err != nil {
		// Rely on logrus to record the error and set status code.
		logrus.WithContext(ctx).WithError(err).Error("insert failed")
		return err
	}
	return nil
}
Step 4. Record contextual information with attributes:
func insertUser(ctx context.Context, user *User) error {
	ctx, span := tracer.Start(ctx, "insert-user")
	defer span.End()

	if _, err := db.NewInsert().Model(user).Exec(ctx); err != nil {
		span.RecordError(err)
		span.SetStatus(codes.Error, err.Error())
		return err
	}

    if span.IsRecording() {
        span.SetAttributes(
            attribute.Int64("enduser.id", user.ID),
            attribute.String("enduser.email", user.Email),
        )
    }

	return nil
}
And that's it! The operation is fully instrumented.
Tracer
To start creating spans, you need a tracer. You can create a tracer by providing the name and version of the library/application doing the instrumentation:
import "go.opentelemetry.io/otel"

var tracer = otel.Tracer("app_or_package_name")
You can have as many tracers as you want, but usually you need only one tracer for an app or a library. Later, you can use tracer names to identify the instrumentation that produces the spans.
Creating spans
Once you have a tracer, creating spans is easy:
import "go.opentelemetry.io/otel/trace"

// Create a span with name "operation-name" and kind="server".
ctx, span := tracer.Start(ctx, "operation-name",
    trace.WithSpanKind(trace.SpanKindServer))

doSomeWork()

// End the span when the operation we are measuring is done.
span.End()
Context
OpenTelemetry stores the active span in a context.Context. You propagate the context by passing it to a function as the first argument.
With net/http, the active context is propagated in a http.Request:
func handler(w http.ResponseWriter, req *http.Request) {
	// Get the context.
	ctx := req.Context()

	// Set the context. This is usually done by instrumentations, for example, otelhttp.
	req = req.WithContext(ctx)
	anotherHandler(w, req)
}
tracer.Start saves the span in the context for you, but you can also activate the span manually:
import "go.opentelemetry.io/otel/trace"

// Get the active span from the context.
span = trace.SpanFromContext(ctx)

// Save the active span in the context.
ctx = trace.ContextWithSpan(ctx, span)
Adding span attributes
To record contextual information, you can annotate spans with attributes. For example, an HTTP endpoint may have such attributes as http.method = GET and http.route = /projects/:id.
// To avoid expensive computations, check that span was sampled
// before setting any attributes.
if span.IsRecording() {
	span.SetAttributes(
		attribute.String("http.method", "GET"),
		attribute.String("http.route", "/projects/:id"),
	)
}
You can name attributes as you want, but for common operations you should use semantic attributes convention.
Adding span events
You can annotate spans with events, for example, you can use events to record log messages:
import "go.opentelemetry.io/otel/trace"

span.AddEvent("log", trace.WithAttributes(
	attribute.String("log.severity", "error"),
	attribute.String("log.message", "User not found"),
	attribute.String("enduser.id", "123"),
))
Setting status code
You can set error status code to indicate that the operation contains an error:
import "go.opentelemetry.io/otel/codes"

if err != nil {
	span.SetStatus(codes.Error, err.Error())
}
Errors monitoring
OpenTelemetry provides a shortcut to record errors which is usually used together with the SetStatus API:
import "go.opentelemetry.io/otel/codes"

if err != nil {
	// Record the error.
	span.RecordError(err)

	// Also mark span as failed.
	span.SetStatus(codes.Error, err.Error())
}
You can also record errors stack trace like this:
import "go.opentelemetry.io/otel/trace"

span.RecordError(err, trace.WithStackTrace(true))
Logs monitoring
To monitor logs, use OpenTelemetry instrumentations for popular logging libraries:
If that is not possible, see Monitoring Logs for more options such as Vector or FluentBit.
SDK logging
By default, OpenTelemetry Go SDK logs error messages to stderr. You can discard or redirect those logs by providing an error handler:
import "go.opentelemetry.io/otel"

otel.SetErrorHandler(otel.ErrorHandlerFunc(func(err error) {
    // ignore the error
}))
OpenTelemetry APM
Uptrace is an open source APM for OpenTelemetry that supports distributed tracing, metrics, and logs. You can use it to monitor applications and troubleshoot issues.
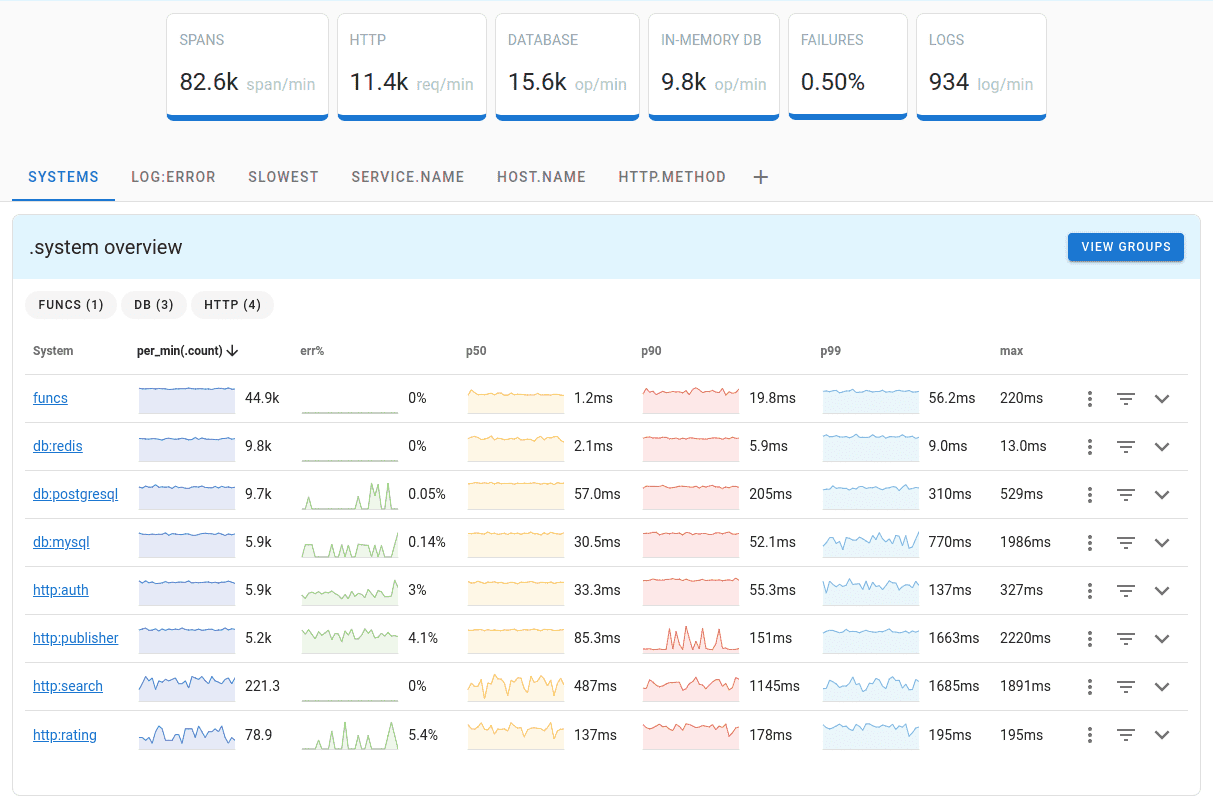
Uptrace comes with an intuitive query builder, rich dashboards, alerting rules, notifications, and integrations for most languages and frameworks.
Uptrace can process billions of spans and metrics on a single server and allows you to monitor your applications at 10x lower cost.
In just a few minutes, you can try Uptrace by visiting the cloud demo (no login required) or running it locally with Docker. The source code is available on GitHub.