# Monitoring errors and exceptions with OpenTelemetry
> Record exceptions with OpenTelemetry spans, capture stack traces in multiple languages, and track grouped errors inside Uptrace.
## Introduction
Exception tracking with OpenTelemetry captures errors as they occur in your application and links them to the distributed trace context. This provides:
- **Full stack traces** attached to the span where the error occurred.
- **Trace correlation** linking exceptions to the request flow across services.
- **Automatic grouping** of similar exceptions in the Uptrace UI.
- **Error aggregation** showing frequency, affected users, and trends.
## Recording exceptions
To record errors and exceptions with OpenTelemetry:
1. Get the active span from the current context.
2. Call `recordException` (or equivalent) to capture the error.
3. Set the span status to `ERROR` with a descriptive message.
When you record an exception, OpenTelemetry automatically captures these [semantic attributes](/opentelemetry/semconv):
|
Attribute
|
Description
|
exception.type
|
The exception class name
|
exception.message
|
The error message
|
exception.stacktrace
|
Full stack trace
|
```go [Go]
import (
"go.opentelemetry.io/otel/codes"
"go.opentelemetry.io/otel/trace"
)
func doWork(ctx context.Context) error {
// Get the active span from the context.
span := trace.SpanFromContext(ctx)
if err := riskyOperation(); err != nil {
// Record the error as an exception event.
span.RecordError(err)
// Mark the span as failed.
span.SetStatus(codes.Error, err.Error())
return err
}
return nil
}
```
```python [Python]
from opentelemetry import trace
from opentelemetry.trace import Status, StatusCode
def do_work():
span = trace.get_current_span()
try:
risky_operation()
except Exception as exc:
# Record the exception and mark the span as failed.
span.record_exception(exc)
span.set_status(Status(StatusCode.ERROR, str(exc)))
raise
```
```java [Java]
import io.opentelemetry.api.trace.Span;
import io.opentelemetry.api.trace.StatusCode;
public void doWork() {
Span span = Span.current();
try {
riskyOperation();
} catch (Exception e) {
// Record the exception and mark the span as failed.
span.recordException(e);
span.setStatus(StatusCode.ERROR, e.getMessage());
throw e;
}
}
```
```javascript [JavaScript]
const otel = require('@opentelemetry/api')
function doWork() {
const span = otel.trace.getSpan(otel.context.active())
try {
riskyOperation()
} catch (err) {
// Record the exception and mark the span as failed.
span.recordException(err)
span.setStatus({ code: otel.SpanStatusCode.ERROR, message: String(err) })
throw err
}
}
```
```csharp [.NET]
using System.Diagnostics;
using OpenTelemetry.Trace;
void DoWork()
{
var activity = Activity.Current;
try
{
RiskyOperation();
}
catch (Exception ex)
{
// Record the exception and mark the span as failed.
activity?.RecordException(ex);
activity?.SetStatus(ActivityStatusCode.Error, ex.Message);
throw;
}
}
```
```ruby [Ruby]
require 'opentelemetry'
def do_work
span = OpenTelemetry::Trace.current_span
begin
risky_operation
rescue StandardError => e
# Record the exception and mark the span as failed.
span.record_exception(e)
span.status = OpenTelemetry::Trace::Status.error(e.message)
raise
end
end
```
```php [PHP]
use OpenTelemetry\API\Trace\Span;
use OpenTelemetry\API\Trace\StatusCode;
function doWork(): void
{
$span = Span::getCurrent();
try {
riskyOperation();
} catch (\Exception $e) {
// Record the exception and mark the span as failed.
$span->recordException($e);
$span->setStatus(StatusCode::STATUS_ERROR, $e->getMessage());
throw $e;
}
}
```
For language-specific details, see the tracing documentation for your programming language:
## Grouping exceptions together
By default, Uptrace groups exceptions by their type and message. To customize grouping, set the `grouping.fingerprint` attribute to a string or number that identifies similar exceptions:
```toml
exception.type = "RuntimeError"
exception.message = "operation failed: 123 456 789"
grouping.fingerprint = "operation failed"
```
This groups all "operation failed" exceptions together, ignoring the variable parts (123 456 789) in the message. You can also customize [grouping rules](/features/logs/grouping) in the Uptrace UI.
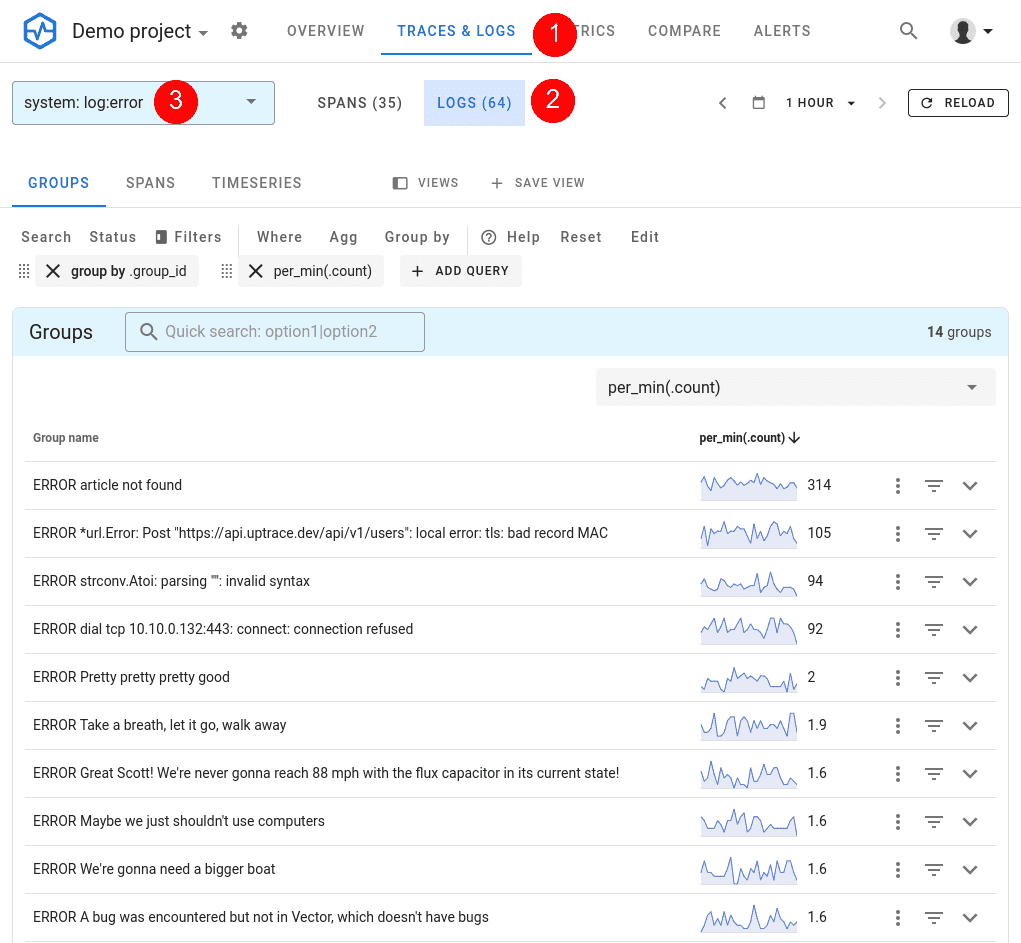
## Viewing exceptions
Exceptions appear alongside `ERROR` logs in Uptrace. To view them:
1. Navigate to **Traces & Logs** in the Uptrace UI.
2. Click the **Logs** button.
3. Select the **log:error** system.
4. Filter with `where _event_name = "exception"` or `where exception_type exists`.
## Monitoring errors
Once exceptions flow into Uptrace, you can set up monitors to get notified when errors spike or new error types appear. To create a monitor, navigate to **Alerting** → **Monitors** and click **New monitor** → **From YAML**.
### Error monitors
Error monitors trigger alerts for specific exceptions and logs. For example, you can create a monitor that watches for all recorded exceptions:
```yaml
error_monitors:
- name: Exceptions
notify_everyone_by_email: true
query:
- group by _group_id
- where _system in ("log:error", "log:fatal")
- where exception_type exists
```
You can also filter by exception type or message:
```yaml
error_monitors:
- name: Payment errors
notify_everyone_by_email: true
query:
- group by _group_id
- where _system in ("log:error", "log:fatal")
- where _display_name contains "PaymentError"
```
### Metric monitors
You can use metric monitors to alert on error rates. For example, trigger an alert when the number of errors exceeds 10 per minute:
```yaml
metric_monitors:
- name: High error rate
metrics:
- uptrace_tracing_logs as $logs
query:
- perMin(sum($logs))
- where _system in ("log:error", "log:fatal")
detector:
type: manual
max_value: 10
num_eval_points: 3
```
For the full list of monitor options and notification channels (Slack, PagerDuty, email, webhooks), see [Alerts and Notifications](/features/alerting).
## See also
- [OpenTelemetry Distributed Tracing](/opentelemetry/distributed-tracing)
- [Logs Monitoring](/get/logs)
- [Alerts and Notifications](/features/alerting)