Open Source Alternatives to Tracealyzer
Tracealyzer is a popular tool for visualizing and analyzing the execution of real-time systems, but its price tag can be a barrier for some developers. This guide explores powerful open-source alternatives that provide similar functionality for free, helping you choose the right tool for your embedded systems projects.
Introduction to Tracealyzer Alternatives
Tracealyzer offers powerful features for embedded systems debugging, but open-source alternatives can provide similar capabilities without the cost. This guide will help you understand the key features and use cases of various open-source tools that can replace Tracealyzer in your development workflow.
Why Consider Open Source Alternatives?
Before diving into specific tools, let's explore the benefits of using open-source alternatives to Tracealyzer:
- Cost-Effectiveness: Many open-source tools are free to use, making them accessible for small teams, hobbyists, and budget-conscious organizations.
- Customization Flexibility: Open-source solutions can often be customized to meet the unique needs of your project.
- Community Support: Popular open-source tools often have strong communities that contribute to development, provide tutorials, and help troubleshoot problems.
- Integration Capabilities: Open-source solutions may offer better compatibility with other tools and environments you are already using, particularly in Linux-based ecosystems.
Top Open Source Alternatives to Tracealyzer
LTTng (Linux Trace Toolkit Next Generation)

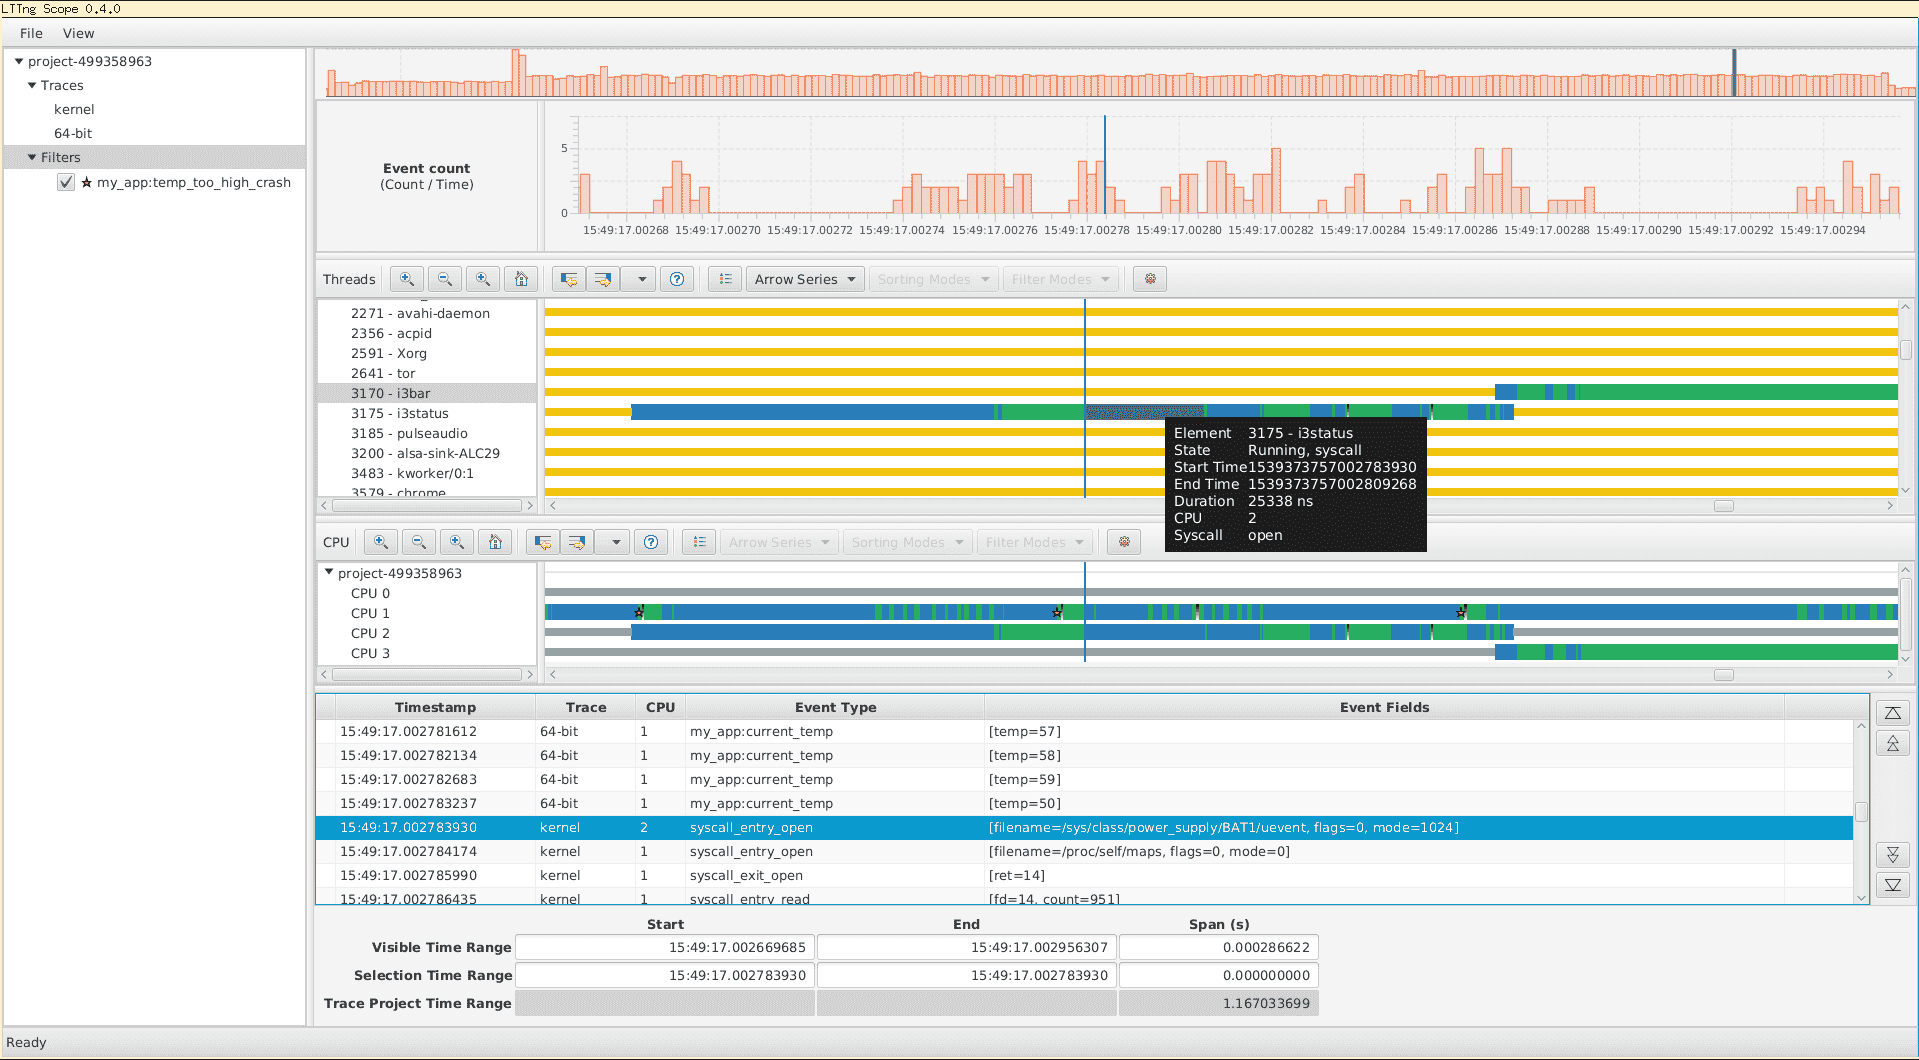
LTTng (Linux Trace Toolkit Next Generation) is a robust open-source tracing framework created for Linux-based systems. It enables developers to observe and analyze the performance of both kernel and user-space processes, offering in-depth insights into the functioning of applications and the system.
Key Features of LTTng
- Supports both kernel and user-space tracing
- Handles high-frequency events with minimal performance overhead
- Provides integration with tools like Babeltrace for analyzing trace data
- Large, active community and extensive documentation
Pros
- Comprehensive tracing for Linux systems
- Low overhead, suitable for production environments
- Flexible and highly customizable
Cons
- Steep learning curve for beginners
- Limited to Linux-based systems
- May require additional tools for visualization
Use Case: Ideal for developers working on Linux-based embedded systems who need detailed insights into system behavior and performance.
FreeRTOS Trace

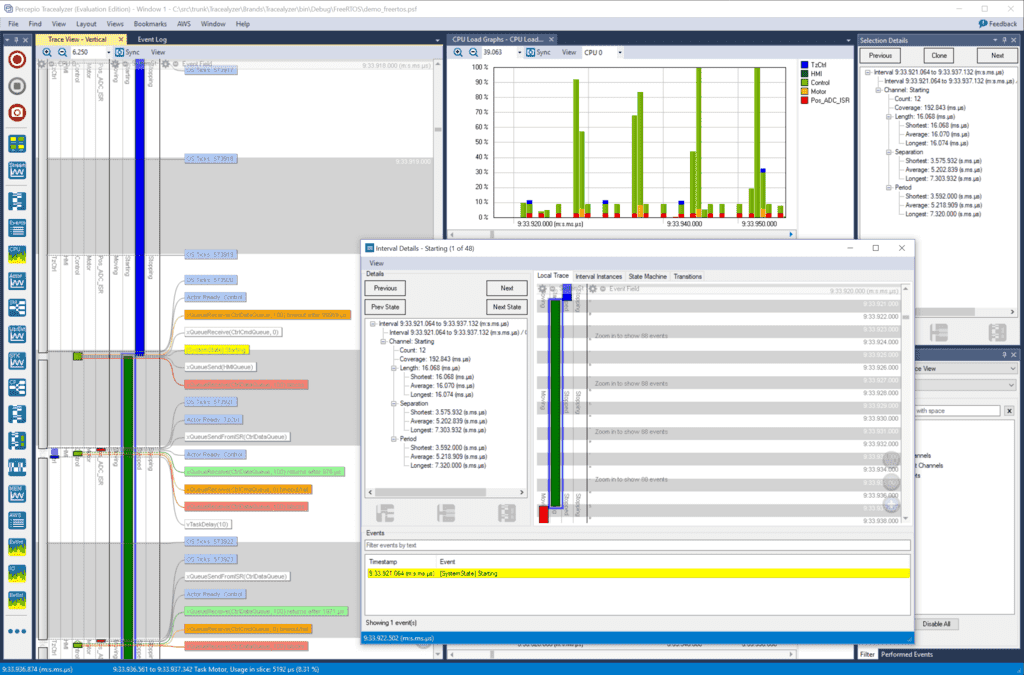
FreeRTOS Trace is a basic tracing tool included with the popular real-time operating system FreeRTOS.
Key Features of FreeRTOS Trace
- Specifically designed for real-time systems running on FreeRTOS
- Simple integration with FreeRTOS projects
- Provides basic tracing of task switching, interrupts, and CPU load
- Limited but useful visualizations for smaller projects
Pros
- Easy integration with FreeRTOS projects
- Lightweight and efficient for real-time systems
- No additional cost for FreeRTOS users
Cons
- Limited functionality compared to more comprehensive tools
- Only works with FreeRTOS
- Basic visualization capabilities
Use Case: Best suited for developers already working with FreeRTOS and who need lightweight tracing tools for task management and CPU analysis.
Segger SystemView

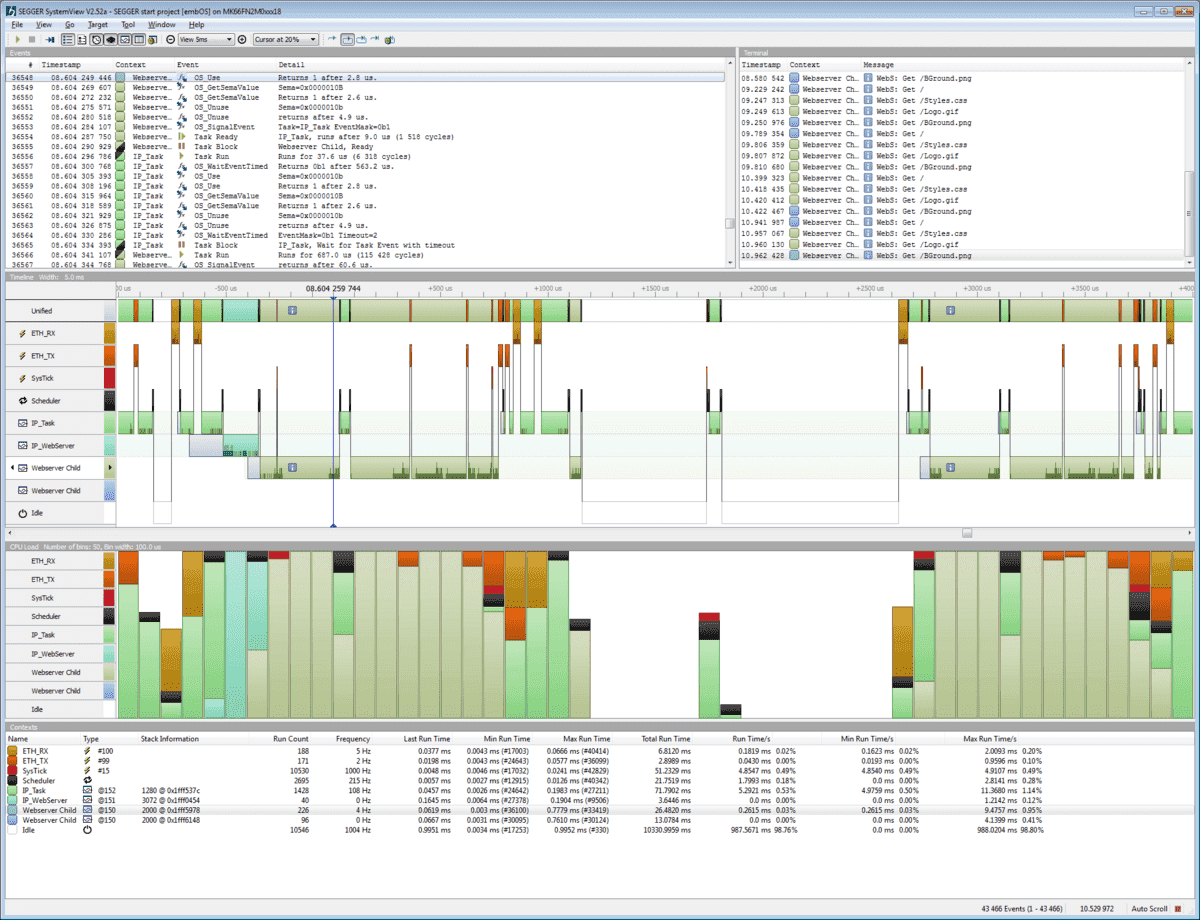
SystemView by Segger is a real-time tracing and visualization tool designed specifically for embedded systems. It allows developers to monitor and analyze the behavior of embedded applications, providing insights into task scheduling, interrupts, and system performance with minimal impact on the system's execution.
Key Features of Segger SystemView
- Minimal overhead, designed for real-time systems
- Detailed visualization of tasks, interrupts, and system events
- Can record data in real-time for later analysis
- Works with a variety of RTOSs, not limited to Segger's own RTOS
Pros
- Excellent real-time visualization capabilities
- Low overhead, suitable for resource-constrained systems
- Supports multiple RTOSs
Cons
- May require Segger hardware for some advanced features
- Less extensive community support compared to some alternatives
- Learning curve for advanced usage
Use Case: A great choice for developers using Segger's tools or looking for a fast and efficient way to trace real-time embedded systems with minimal impact on performance.
Percepio Trace Exporter for FreeRTOS

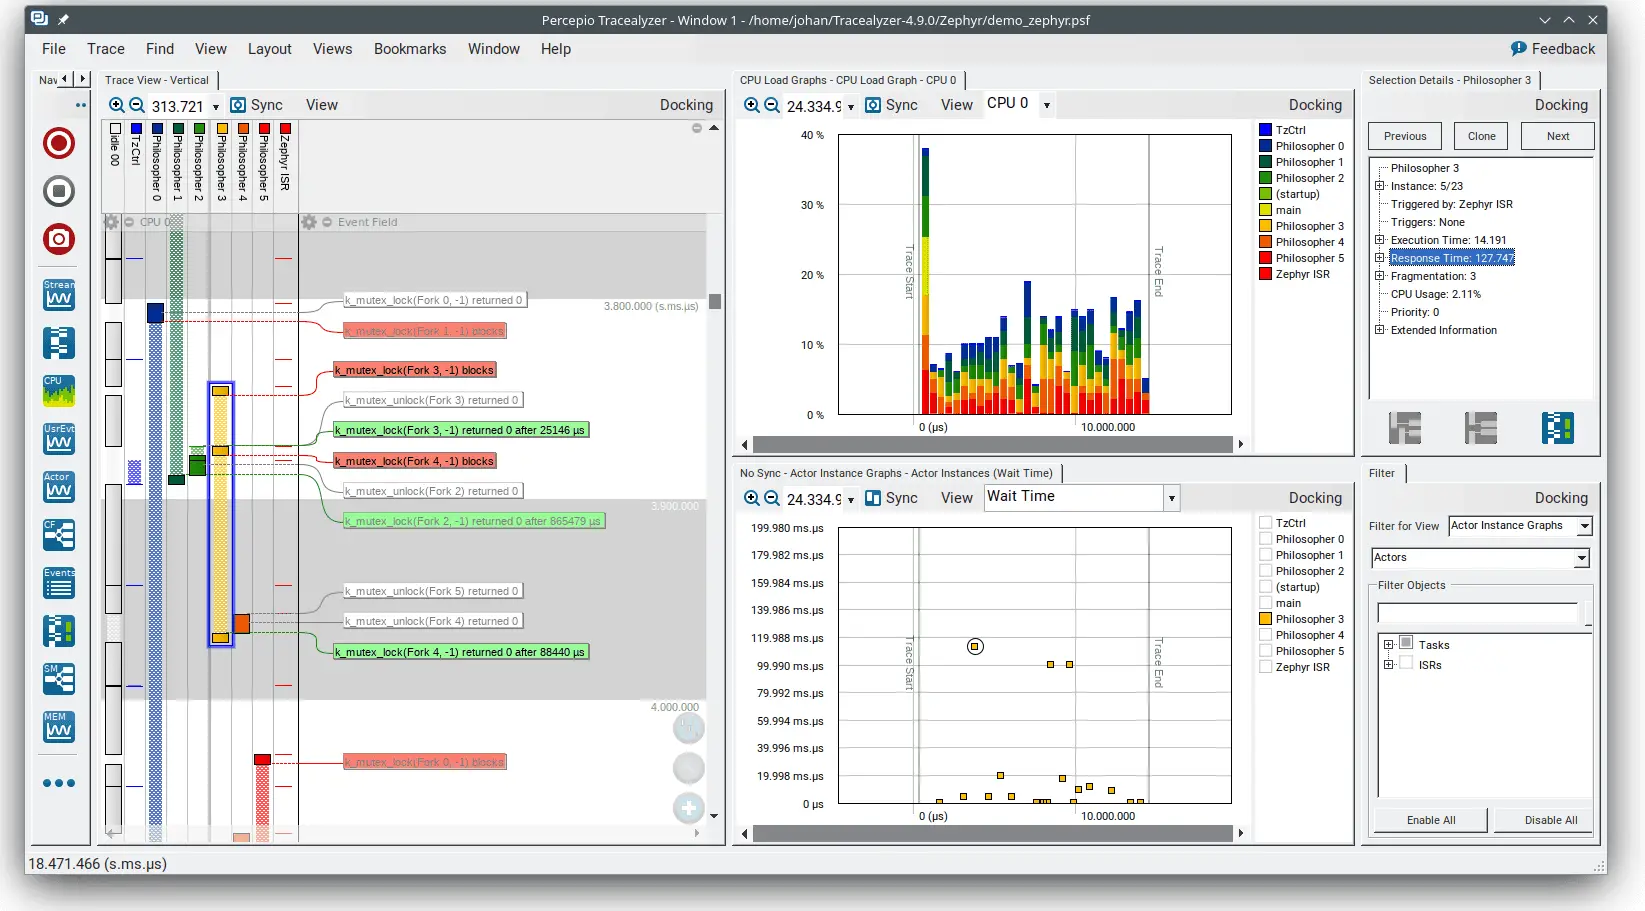
The Percepio Trace Exporter is an open-source tool designed to integrate with FreeRTOS projects to export trace data for external analysis. It is a simplified and free alternative to Percepio's more feature-rich tool, Tracealyzer, providing a way to capture and export runtime data from real-time operating systems (RTOS) such as FreeRTOS.
Key Features of Percepio Trace Exporter
- Free to use with FreeRTOS-based applications
- Allows basic trace data export for external analysis
- Integration with OpenTelemetry and other monitoring tools
Pros
- Free and open-source
- Good integration with FreeRTOS
- Compatibility with other analysis tools
Cons
- Limited functionality compared to full Percepio Tracealyzer
- Requires external tools for comprehensive analysis
- Only supports FreeRTOS
Use Case: Useful for developers working with FreeRTOS who are looking for basic trace functionality at no cost and are comfortable with external data analysis tools.
Comparing Tracealyzer and Open Source Alternatives
| Feature | Tracealyzer | LTTng | FreeRTOS Trace | Segger SystemView | Percepio Trace Exporter |
|---|---|---|---|---|---|
| Target Systems | Embedded, RTOS | Linux, Embedded | FreeRTOS | RTOS, Embedded | FreeRTOS |
| Real-Time Visualization | Yes | No | Basic | Yes | Basic |
| Supported OS | Multiple | Linux | FreeRTOS | Multiple | FreeRTOS |
| Customization Options | Limited | Extensive | Limited | Moderate | Extensive |
| Cost | Paid | Free | Free | Free | Free |
Conclusion
While Tracealyzer offers a comprehensive solution for embedded systems debugging and visualization, open-source alternatives provide powerful capabilities that can meet the needs of many developers and projects. By considering tools like LTTng, FreeRTOS Trace, and Segger SystemView, you can find a solution that fits your specific requirements and budget constraints.
When choosing an alternative to Tracealyzer, consider factors such as your target operating system, the level of detail you need in your traces, and your comfort with potential customization. Each tool has its strengths, and the best choice will depend on your specific project needs and development environment.
FAQ
Can open source alternatives completely replace Tracealyzer?
While open source alternatives offer many features similar to Tracealyzer, they may not provide the same level of polish or comprehensive feature set. However, for many projects, especially those with budget constraints, open source tools can be an excellent alternative.
Are open source tracing tools difficult to set up and use?
The complexity can vary. Tools like FreeRTOS Trace are relatively simple to set up if you're already using FreeRTOS. Others like LTTng might have a steeper learning curve but offer more advanced features. Many open source tools have active communities that can provide support during setup and use.
Can I use multiple open source tracing tools together?
Yes, it's possible to use multiple tools together, especially if you're working with different aspects of your system. For example, you might use LTTng for Linux kernel tracing and Segger SystemView for RTOS task analysis. However, integration may require additional effort.
How do open source alternatives handle large amounts of trace data?
Many open source tools are designed to handle large volumes of data efficiently. For example, LTTng uses circular buffers to manage high-frequency events. However, for very large datasets, you may need to use additional tools or custom scripts for analysis and visualization.
Are there any performance impacts when using open source tracing tools?
Most tracing tools, including open source ones, introduce some level of overhead. However, tools designed for embedded systems, like Segger SystemView, are optimized for minimal impact. The exact performance impact depends on the tool, your system, and how you configure the tracing.
You may also be interested in:
Top Distributed Tracing Tools Explore a comprehensive comparison of popular distributed tracing tools to enhance your system observability beyond embedded systems.
OpenTelemetry Tracing Guide Learn about distributed tracing, which can complement embedded system tracing for full-stack observability.
Logs Management with OpenTelemetry Understand how to manage logs effectively using OpenTelemetry, which can be applied alongside embedded system tracing.
Metrics Monitoring Explore how to monitor metrics, which can provide valuable insights when combined with trace data from embedded systems.
By exploring these resources, you can gain a more comprehensive understanding of system observability and potentially find ways to integrate embedded system tracing with broader application monitoring strategies.