Getting started with Uptrace
Uptrace is an open-source observability and APM platform that ingests distributed traces, metrics, and logs via OpenTelemetry. This page explains how to provision an Uptrace project, find your DSN, and begin streaming telemetry from your services.
Try it without installing anything
Want to see Uptrace with real data before instrumenting your own app? Open the cloud demo (no login required) — it's preloaded with traces, logs, and metrics from a sample microservices app so you can explore dashboards, span grouping, and alerting immediately.
Quick start
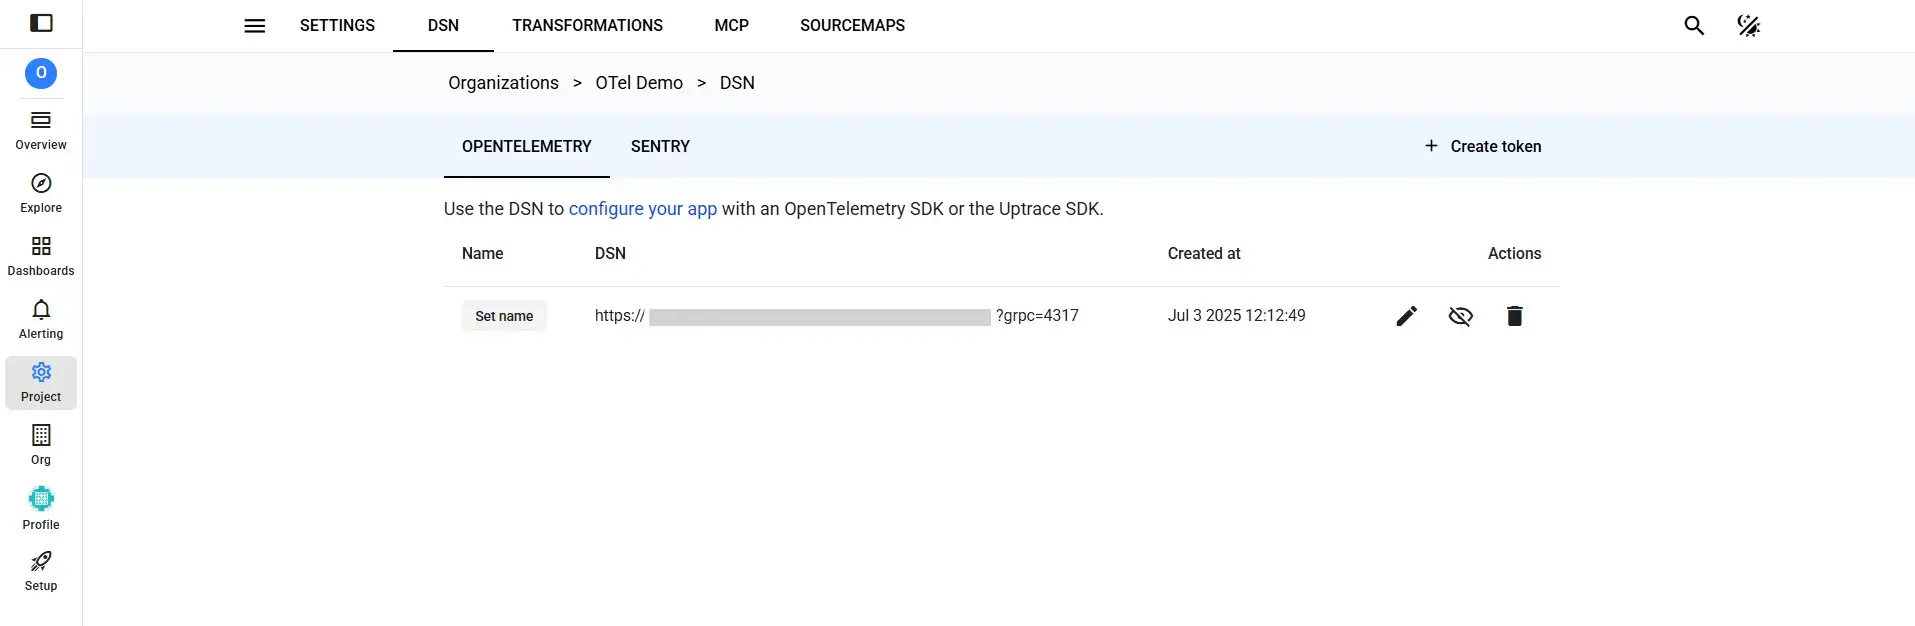
- Provision Uptrace. Either sign up for Uptrace Cloud or self-host Uptrace. Both deployment options expose a project DSN such as
https://<secret>@api.uptrace.dev?grpc=4317. - Configure OpenTelemetry. Paste the DSN into the OpenTelemetry SDK for your language (see the distributions below) and start the application. Uptrace immediately begins receiving spans, metrics, and logs.
- Verify data is arriving. Open your project in Uptrace and check the Services view — your service should appear within a minute of sending its first request. If nothing shows up, jump to Troubleshooting below.
Questions? Reach the team on Telegram, Slack, or GitHub Discussions.
DSN
Every project has a DSN (Data Source Name) that packages the Uptrace endpoint and credentials into one connection string. You can reveal the DSN under Project Settings → Connection details.
Anatomy of a DSN
Example: http://project1_secret@localhost:14318?grpc=14317
http— Transport protocol. Usehttpswhen TLS is enabled.localhost:14318— Uptrace HTTP endpoint. Cloud projects useapi.uptrace.dev.project1_secret— Write-only token that authenticates the project.?grpc=14317— Optional gRPC endpoint for native OpenTelemetry exporters.
Share the DSN only with collectors or services that must send data; it is not required to view your dashboards.
Ports
Uptrace accepts data via OTLP/gRPC and OTLP/HTTP on separate ports:
| Protocol | Cloud | Self-hosted (default) |
|---|---|---|
| OTLP/gRPC | api.uptrace.dev:4317 | :4317 |
| OTLP/HTTP | api.uptrace.dev:443 | :80 |
Most OpenTelemetry SDKs default to gRPC. Use HTTP when gRPC is blocked by firewalls or proxies.
IPv4-only endpoint
api.uptrace.dev is dual-stack and resolves to both IPv6 and IPv4 addresses. If your host has no IPv6 connectivity, some clients fail to fall back to IPv4 and the exporter times out. In that case, swap the host for api4.uptrace.dev, which resolves to IPv4 only:
https://<secret>@api4.uptrace.dev?grpc=4317
The ports and credentials are identical — only the hostname changes.
Self-hosted ports are configured in uptrace.yml via listen.grpc.addr and listen.http.addr. You can also use site.url and site.ingest_url to customize DSN host.
Monitoring capabilities
Infrastructure
- OpenTelemetry Collector gathers host metrics, databases, and middleware signals before forwarding them to Uptrace.
- Prometheus scrapes metrics and exports them directly to Uptrace.
- AWS users can stream CloudWatch Metrics for EC2, RDS, and other managed services.
Synthetic monitoring
Synthetic monitoring uses the OpenTelemetry httpcheckreceiver to periodically check HTTP endpoints for availability, response content, and TLS certificate expiry — detecting issues before users report them.
Kubernetes
Deploy the OpenTelemetry Collector as a DaemonSet or use the Operator to scrape kubelet, API server, and pod-level metrics. Enrich traces with k8s.* attributes, then forward the data via your DSN. Follow the Kubernetes monitoring guide for Helm steps, RBAC rules, and sampling advice.
Logs
- Vector provides high-throughput log shipping with filtering and enrichment.
- Fluent Bit offers a lightweight forwarder for containers and edge nodes.
- AWS environments can ingest CloudWatch Logs for centralized searching alongside traces.
Correlate logs with spans to jump directly from an error message to the distributed trace that produced it.
Troubleshooting
Data is missing
- Confirm the DSN matches the project and environment you are instrumenting.
- Validate network routes between your service and the Uptrace endpoint (try
curlagainst the DSN host). - Ensure the OpenTelemetry SDK initializes before your application starts handling requests.
- Inspect application logs for exporter failures or authentication errors.
- Run a minimal sample app to isolate whether the issue is in instrumentation or platform networking.
High resource usage
- Lower the sampling rate to reduce span volume.
- Tune exporter batch sizes, timeouts, and concurrency.
- Audit custom instrumentation for expensive synchronous work.
- Use system monitors to confirm whether pressure comes from CPU, memory, or I/O.
Slow queries in the UI
- Simplify filters or reshape the query to scan less data.
- Limit the time range or select a specific service/environment tag.
- Verify ClickHouse configuration and retention policies for the dataset backing your project.
- Rebuild indexes for frequently queried columns if you self-host ClickHouse.
Next steps
- Explore dashboards, service maps, error reports, and span tables.
- Define alerts for latency, error rate, or infrastructure saturation.
- Customize dashboards for specific teams or services.
- Integrate Uptrace checks into CI/CD so every release is covered by tracing and metrics.