What Does No Healthy Upstream Mean and How to Fix It
When your system shows a "no healthy upstream" error, it usually means your load balancer can't connect to any of your backend servers. Let's get straight to fixing this problem.
Understanding No Healthy Upstream Error
This error typically appears when:
- All backend servers are unreachable
- Health checks are failing
- Configuration issues prevent proper connection
- Network problems block access to upstream servers
Here's what it looks like in different contexts:
# Nginx Error Log
[error] no live upstreams while connecting to upstream

# Kubernetes Events
0/3 nodes are available: 3 node(s) had taints that the pod didn't tolerate

# Docker Service Logs
service "app" is not healthy
Quick Diagnosis Guide
Let's break down the troubleshooting process for each platform. Starting with the most common scenarios, we'll look at specific diagnostic steps for each environment.
Nginx Issues
First, check your Nginx error logs:
tail -f /var/log/nginx/error.log
Common Nginx configurations that cause this:
upstream backend {
    server backend1.example.com:8080 max_fails=3 fail_timeout=30s;
    server backend2.example.com:8080 backup;
}
Verification steps:
- Check if backend servers are running
- Verify network connectivity
- Review health check settings
- Check server response times
Kubernetes Problems
Quick diagnostic commands:
# Check pod status
kubectl get pods
kubectl describe pod <pod-name>

# Check service endpoints
kubectl get endpoints
kubectl describe service <service-name>

# Check ingress status
kubectl describe ingress <ingress-name>
Common Kubernetes issues:
- Pods in CrashLoopBackOff state
- Service targeting wrong pod labels
- Incorrect port configurations
- Network policy blocking traffic
Docker Scenarios
Essential Docker checks:
# Check container health
docker ps -a
docker inspect <container_id>

# Check container logs
docker logs <container_id>

# Check network connectivity
docker network inspect <network_name>
Step-by-Step Solutions
Now that we've identified potential issues, let's walk through the resolution process systematically. These solutions are organized from quick fixes to more complex platform-specific configurations.
Immediate Fixes
- Verify Backend Services
# Check service status
systemctl status <service-name>

# Check port availability
netstat -tulpn | grep <port>
- Network Connectivity
# Test connection
curl -v backend1.example.com:8080/health

# Check DNS resolution
dig backend1.example.com
- Health Check Settings
# Nginx health check configuration
location /health {
    access_log off;
    return 200 'healthy\n';
}
Platform-Specific Solutions
If the immediate fixes didn't resolve the issue, we need to look at platform-specific configurations. Each environment has its own unique way of handling upstream health checks and load balancing.
Nginx Fix Examples:
# Add health checks
upstream backend {
    server backend1.example.com:8080 max_fails=3 fail_timeout=30s;
    server backend2.example.com:8080 backup;
    check interval=3000 rise=2 fall=5 timeout=1000 type=http;
    check_http_send "HEAD / HTTP/1.0\r\n\r\n";
    check_http_expect_alive http_2xx http_3xx;
}
Kubernetes Solutions:
# Add readiness probe
spec:
  containers:
    - name: app
      readinessProbe:
        httpGet:
          path: /health
          port: 8080
        initialDelaySeconds: 5
        periodSeconds: 10
Docker Fixes:
# Docker Compose health check
services:
  web:
    healthcheck:
      test: ['CMD', 'curl', '-f', 'http://localhost/health']
      interval: 30s
      timeout: 10s
      retries: 3
Fix Upstream Issues Fast
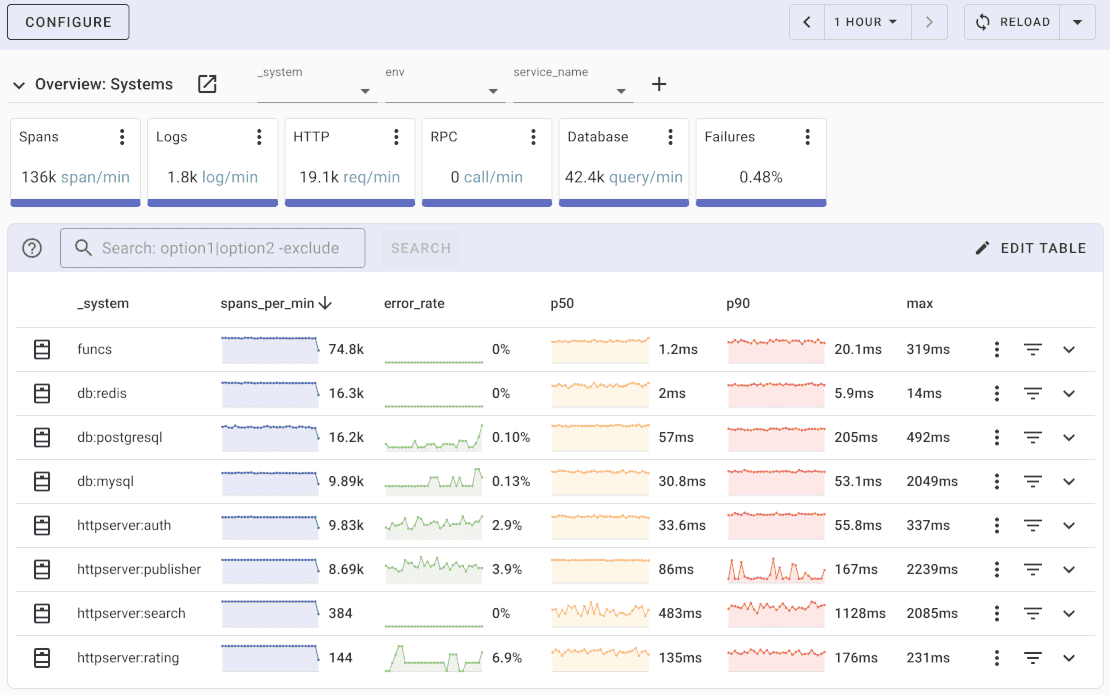
Tired of manually troubleshooting "no healthy upstream" errors across your Nginx, Kubernetes, and Docker environments? While you're checking logs and testing connections, your users are experiencing downtime.
Uptrace automatically monitors your entire infrastructure stack - from load balancers to backend services. Get instant alerts when upstream health checks fail, visualize service dependencies, and identify root causes in seconds, not hours.
✅ Real-time upstream monitoring - Know immediately when backends go unhealthy
✅ Distributed tracing - See exactly where requests fail in your service chain
✅ Performance metrics - Track response times and error rates across all upstreams
✅ Smart alerting - Get notified before users notice the problem
Try Uptrace free - Monitor your infrastructure like the pros do.
Start Free Trial or View Live Demo
Used by teams at 500+ companies to prevent upstream failures before they impact users

Prevention Tips
Essential Health Check Practices:
- Implement proper health check endpoints
- Set reasonable timeout values
- Configure proper retry mechanisms
- Monitor backend server performance
Key Configuration Rules:
- Always have backup servers
- Implement circuit breakers
- Set reasonable timeouts
- Use proper logging
Common Prevention Configurations:
# Nginx with backup servers
upstream backend {
    server backend1.example.com:8080 weight=3;
    server backend2.example.com:8080 weight=2;
    server backend3.example.com:8080 backup;

    keepalive 32;
    keepalive_requests 100;
    keepalive_timeout 60s;
}
Remember: The key to preventing "no healthy upstream" errors is proper monitoring and configuration of health checks across all your services.
Quick Troubleshooting Flowchart:
By following these steps and implementing the suggested configurations, you should be able to resolve and prevent "no healthy upstream" errors in your infrastructure.
FAQ
- How quickly can no healthy upstream issues be resolved? Resolution time varies - simple configuration issues can be fixed in minutes, while complex network problems may take hours to troubleshoot.
- Can this error occur in cloud environments? Yes, this error is common in cloud environments, especially with load balancers and microservices architectures.
- Are there any automated solutions? Many monitoring tools can detect and alert on upstream health issues, but manual intervention is often needed for resolution.
- Is this error specific to Nginx? No, while common in Nginx, similar issues occur in any system using load balancing or service discovery.
- How can I prevent this in production? Implement proper health checks, monitoring, redundancy, and follow the prevention tips outlined in this guide.
- Do I need technical expertise to fix this? Basic troubleshooting requires DevOps knowledge, but complex cases may need advanced networking and system administration skills.
- Can this affect application performance? Yes, unhealthy upstreams can cause service disruptions, increased latency, and poor user experience.
- What monitoring tools should I use? Popular choices include Prometheus with Grafana, Datadog, New Relic, or native cloud provider monitoring tools.
You may also be interested in: