Top 13 Datadog Alternatives in 2026: Open-Source, Cloud & Hybrid
Datadog bills are getting harder to justify. Many mid-sized companies spend $50,000–$150,000 per year on full-stack Datadog monitoring, with enterprise deployments easily exceeding $1 million annually. The core problem is structural: Datadog uses a high-watermark billing model that measures the 99th percentile of monthly usage — short-term infrastructure spikes can inflate the bill even when average load is low. This guide covers 13 alternatives — open-source, commercial, and hybrid — categorized to help you find the right fit.
Quick Comparison
| Solution | Type | Best For | Pricing Model | Self-Hosted | Key Strength |
|---|---|---|---|---|---|
| Uptrace | Open-Source | Cost-conscious teams, data sovereignty | Free (self-hosted), Cloud plans available | ✅ Yes | OpenTelemetry-native, 80% cost savings |
| Prometheus + Grafana | Open-Source | Kubernetes monitoring | Free | ✅ Yes | Industry standard for K8s |
| New Relic | Commercial | Full-stack observability | Usage-based (per GB) | ❌ No | Comprehensive APM features |
| Dynatrace | Commercial | Enterprise AI-driven monitoring | Per-host pricing | ❌ No | AI-powered root cause analysis |
| Grafana Cloud | Freemium | Teams using Grafana stack | Free tier + usage-based | ⚠️ Hybrid | Managed Grafana/Loki/Mimir |
| Elastic Stack | Freemium | Log aggregation + search | Free (OSS), Cloud plans available | ✅ Yes | Powerful search capabilities |
| Netdata | Open-Source | Real-time infrastructure monitoring | Free | ✅ Yes | 1-second granularity metrics |
Open-Source Solutions
Uptrace
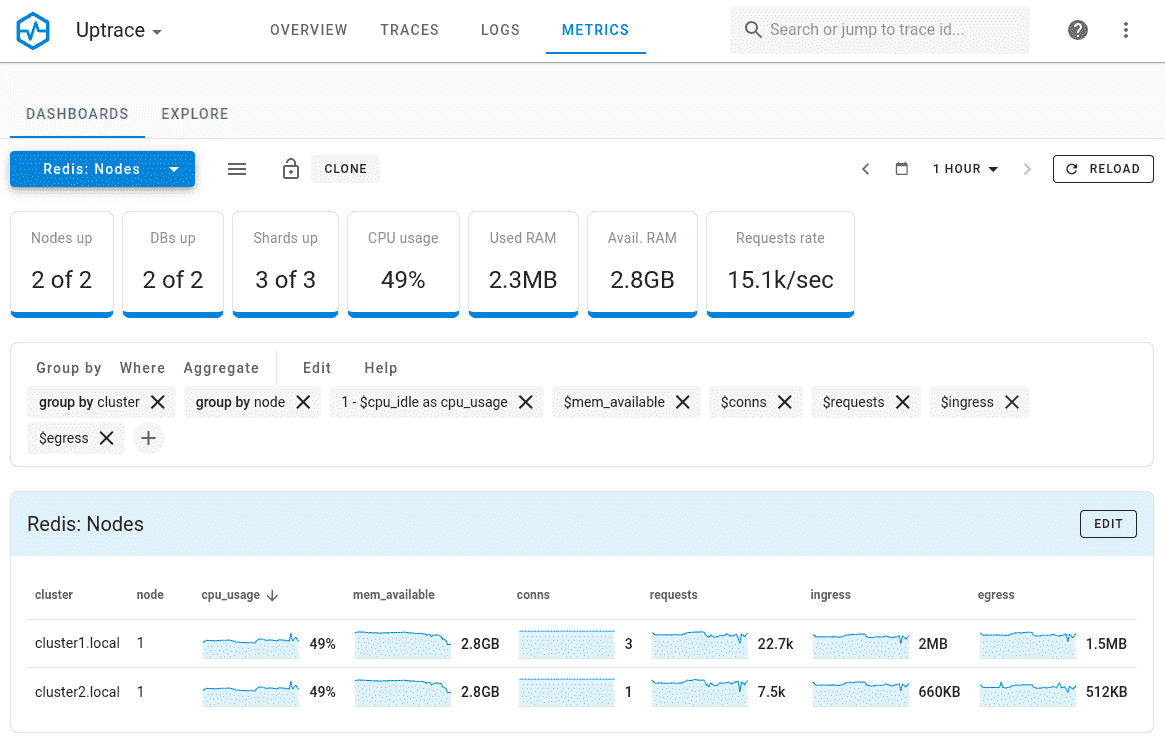
Uptrace is an open-source APM and observability platform built on OpenTelemetry, designed for modern cloud-native environments. As a self-hosted Datadog alternative, it combines distributed tracing, metrics, and logs into a single pane of glass, empowering teams to reduce costs while maintaining enterprise-grade performance.
Why Uptrace Stands Out in 2026:
- Cost Efficiency: By leveraging ClickHouse for storage, Uptrace achieves 10–20x data compression, slashing storage costs by up to 80% compared to Elasticsearch or SaaS tools like Datadog.
- OpenTelemetry Native: Seamlessly integrates with the industry-standard OTel framework, ensuring compatibility with 300+ technologies (Kubernetes, AWS, Python, Go, etc.) without vendor lock-in.
- AI-Driven Insights: Automatically detects anomalies in latency, error rates, and SLA breaches across your services.
Key Features:
- Distributed Tracing: Map request flows across microservices and identify bottlenecks with flame graphs and span analytics.
- Unified Observability: Correlate traces with Prometheus metrics and Loki logs in a single UI, eliminating context switching.
- Scalability: Handles petabyte-scale workloads with horizontal scaling using Kafka and ClickHouse clusters.
2026 Relevance:
- Edge & IoT Ready: Lightweight agents for monitoring distributed edge devices.
- FinOps Integration: Cost allocation reports help teams track cloud spending by service, team, or project.
Pricing:
- Open-Source: Free forever for self-hosted deployments (AGPLv3 license).
- Enterprise Cloud: Check out pricing page.
Pros:
- ✅ No Hidden Fees: Predictable pricing without per-host or per-user charges.
- ✅ Data Ownership: Full control over sensitive data with on-premises deployment.
- ✅ Active Development: 4,100+ GitHub stars with regular releases and a responsive maintainer community.
Cons:
- ❌ Requires basic DevOps skills to deploy ClickHouse/Kafka.
- ❌ Lacks proprietary AI features of SaaS tools (e.g., Datadog’s Watchdog).
Best For:
- Teams prioritizing cost transparency and data sovereignty.
- Startups and enterprises migrating from Datadog to open-source solutions.
Get Started with Uptrace in 5 Minutes
Apache SkyWalking
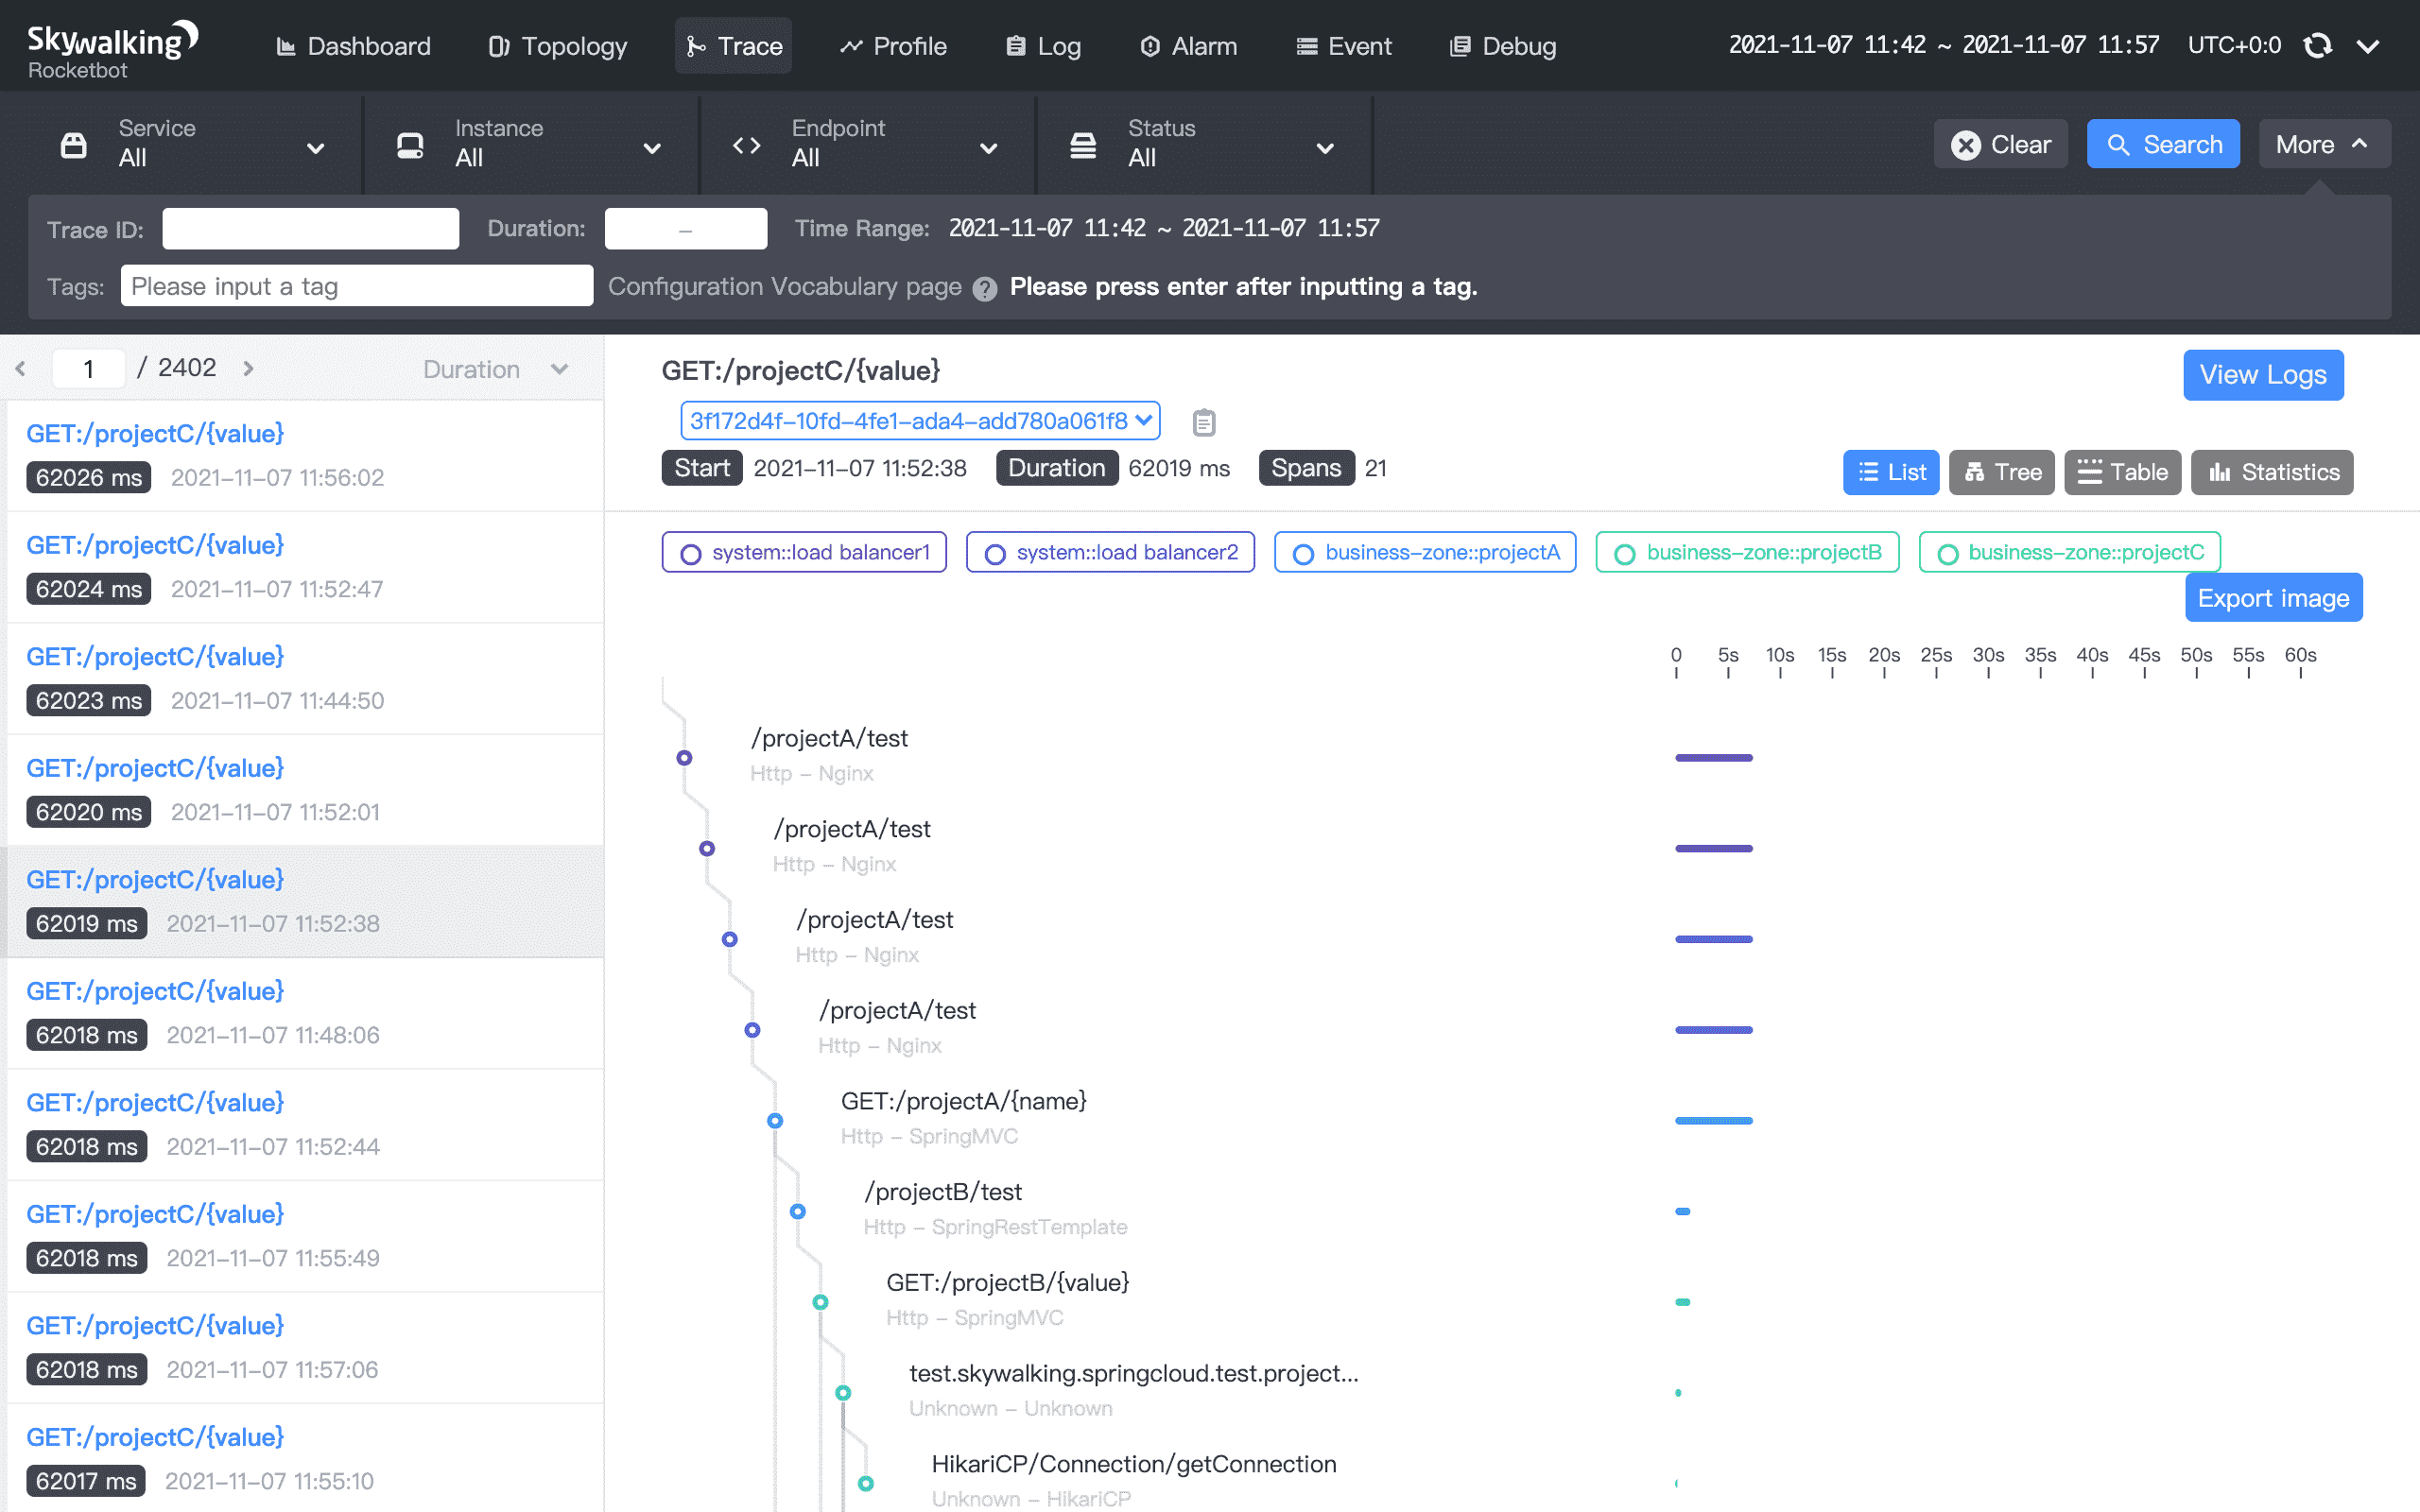
Apache SkyWalking is a distributed systems observability platform focused on microservices and service mesh architectures. Ideal for DevOps teams managing Kubernetes and Istio, it provides deep visibility into service dependencies and performance bottlenecks.
Why SkyWalking Matters in 2026:
With the rise of 5G and edge computing, SkyWalking’s eBPF-powered profiling minimizes overhead while capturing granular metrics from IoT devices and distributed nodes. Its active community (nearly 1,000 GitHub contributors, approaching the 1,000-mark milestone) continues to push BanyanDB — its native storage backend — toward production readiness.
Key Features:
- Service Mesh Observability: Auto-discovers Istio, Envoy, and Linkerd services, visualizing traffic flows and latency hotspots.
- Continuous Profiling: Identifies CPU/memory leaks in production without restarting services.
- Database Monitoring: Tracks SQL query performance across MySQL, PostgreSQL, and Redis.
2026 Relevance:
- BanyanDB Native Storage: SkyWalking moved to BanyanDB as its default production storage in 2025, removing H2 and significantly improving query performance.
- AI/ML Integration: Anomaly detection and automatic metric baseline calculation for intelligent alerting.
Pricing:
- Free: Apache-2.0 licensed with no feature restrictions.
Pros:
- ✅ Zero-cost licensing even for large enterprises.
- ✅ Minimal performance impact (under 3% CPU overhead).
Cons:
- ❌ Limited log management compared to ELK Stack.
- ❌ Requires manual instrumentation for non-Java services.
Best For:
- Organizations running service mesh architectures (Istio, Consul).
- Teams needing real-time profiling in production environments.
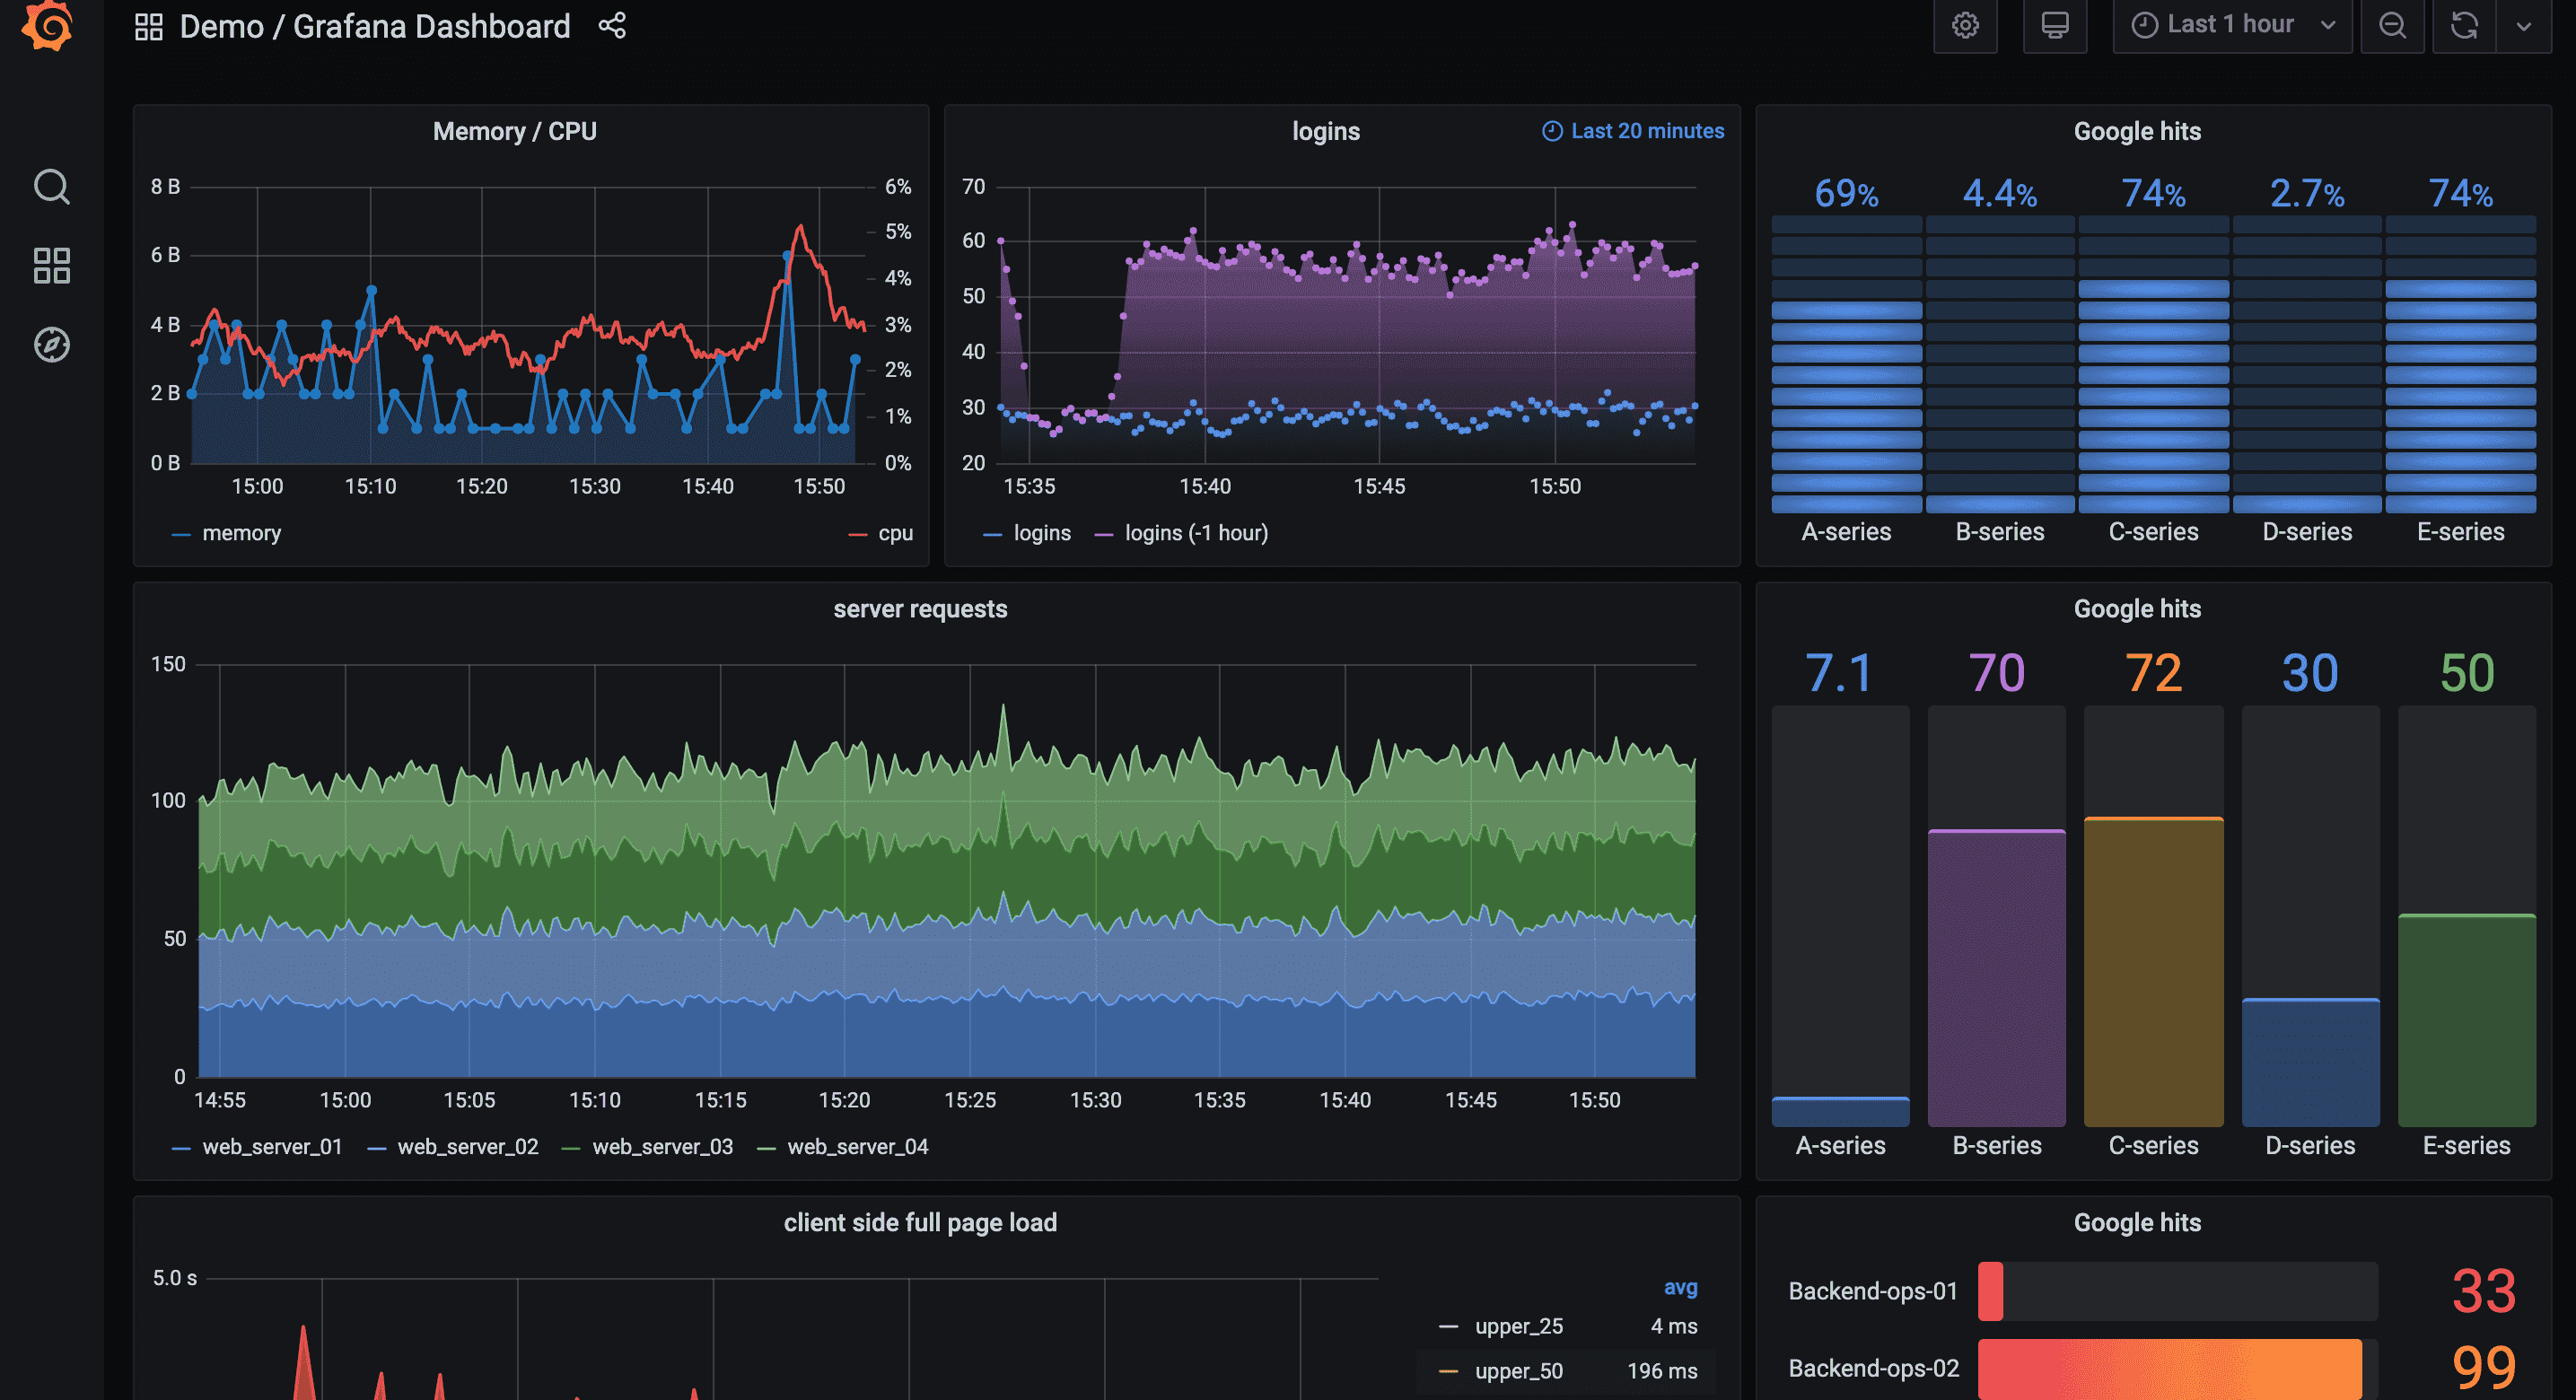
Prometheus + Grafana
Prometheus + Grafana form a modular monitoring stack widely used in Kubernetes ecosystems. A cornerstone of the CNCF ecosystem, this combo offers unmatched flexibility for teams building custom observability pipelines.
Why Prometheus Remains Relevant in 2026:
Despite newer tools emerging, Prometheus’ PromQL query language and Thanos integration make it the go-to choice for metric-centric teams. Over 80% of Kubernetes clusters rely on it for scraping and alerting.
Key Features:
- Dynamic Service Discovery: Auto-detects Kubernetes pods, nodes, and services.
- Long-Term Storage: Thanos or Cortex for retaining years of metric data.
- Alert Manager: Route notifications to Slack, PagerDuty, or custom webhooks.
Pricing:
- Free: Self-hosted with community support.
- Enterprise: Grafana Cloud plans start at $299/month.
Pros:
- ✅ Extensible via 500+ community exporters.
- ✅ Tight integration with Kubernetes API.
Cons:
- ❌ No native tracing/logging (requires Loki/Tempo).
- ❌ Manual scaling challenges for high-cardinality data.
Best For:
- Cloud-native purists who prefer DIY solutions.
- Teams already invested in the Grafana ecosystem.
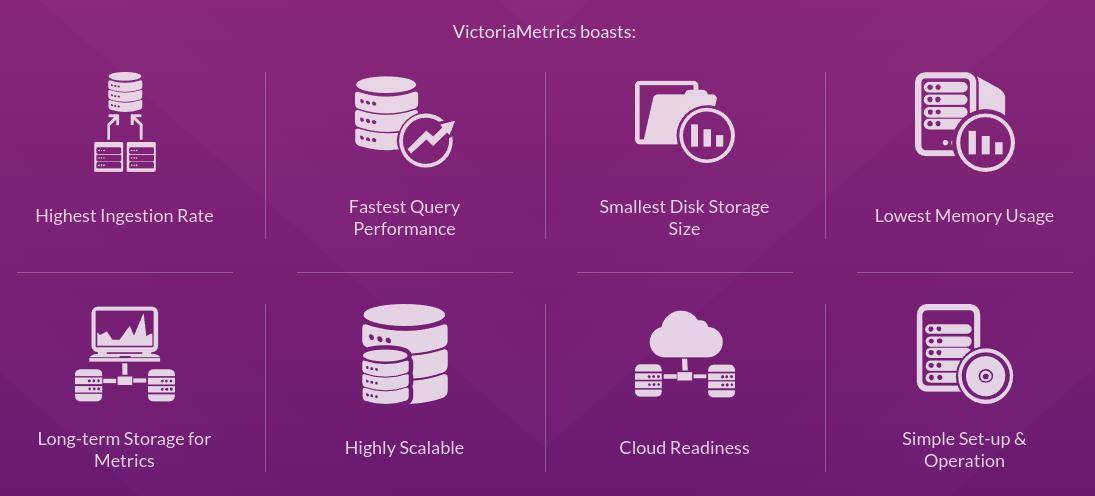
VictoriaMetrics
VictoriaMetrics is a high-performance time-series database optimized for large-scale metric storage. A top choice for enterprises battling data sprawl, it delivers Prometheus compatibility with 90% lower storage costs than traditional solutions.
Why VictoriaMetrics in 2026:
As industries like fintech and IoT generate exponential metric volumes, VictoriaMetrics’ horizontal scalability and vNative compression enable teams to store petabytes of data without breaking the bank. VictoriaMetrics continues to evolve: January 2026 updates brought performance optimizations and tighter Kubernetes integration. Anomaly detection with AI integration was significantly improved throughout 2025.
Key Features:
- Prometheus Drop-In Replacement: Seamlessly replace Prometheus while keeping existing queries and dashboards.
- High Availability: Cluster mode ensures zero downtime during node failures.
- Cost-Efficient Storage: Achieves 10x compression vs. InfluxDB or TimescaleDB.
2026 Relevance:
- ML-Driven Retention Policies: Automatically archive low-priority metrics to cold storage.
- GDPR Compliance: Built-in data masking for sensitive metrics.
Pricing:
- Open-Source: Free self-hosted edition (Apache License 2.0 license).
- Enterprise: From $15,000/year (SLA and 24/7 support).
Pros:
- ✅ Handles 10M+ active time series per node.
- ✅ 70% lower TCO than Elasticsearch for metrics.
Cons:
- ❌ No native tracing or log management.
- ❌ Requires Grafana for advanced visualizations.
Best For:
- Financial institutions and telecoms managing petabyte-scale metrics.
- Teams migrating from Prometheus to a scalable long-term solution.
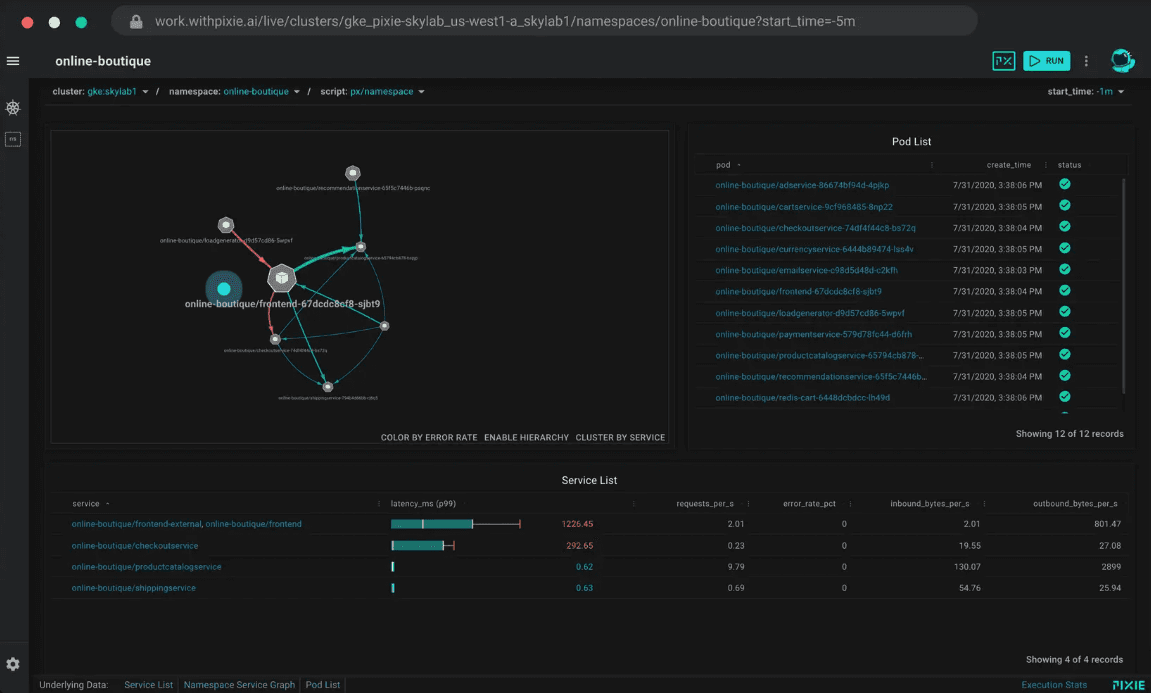
Pixie
Pixie is a CNCF project offering zero-code Kubernetes monitoring using eBPF for auto-instrumentation. The DevOps dream for overworked teams, it eliminates manual tracing setup while providing instant visibility into pods, nodes, and network flows.
Why Pixie Shines in 2026:
With 80% of enterprises now running hybrid Kubernetes clusters, Pixie’s eBPF-powered auto-discovery captures metrics, traces, and logs without touching your codebase. Its integration with OpenTelemetry bridges the gap between DevOps and SRE workflows.
Note: Pixie was acquired by New Relic in 2020 and is now open-sourced as a CNCF project under Apache 2.0. The px.dev community edition remains fully free and self-hostable, but the project is backed and maintained by New Relic.
Key Features:
- Instant K8s Insights: Pre-built dashboards for CPU, memory, and network traffic.
- Service Maps: Auto-generated dependency graphs for microservices.
- Security Monitoring: Detect suspicious traffic patterns in real time.
2026 Relevance:
- Edge Kubernetes: Lightweight agents for Raspberry Pi and IoT K3s clusters.
- Serverless Support: AWS Lambda and Knative monitoring via eBPF.
Pricing:
- Free: Apache-2.0 license with unlimited nodes.
Pros:
- ✅ Deploys in 2 minutes via Helm or CLI.
- ✅ Zero performance overhead (<1% CPU usage).
Cons:
- ❌ Limited to Kubernetes environments.
- ❌ Basic alerting compared to Prometheus.
Best For:
- Platform engineers managing 50+ microservices.
- Startups needing instant observability without hiring specialists.
Commercial/Cloud-Native Solutions
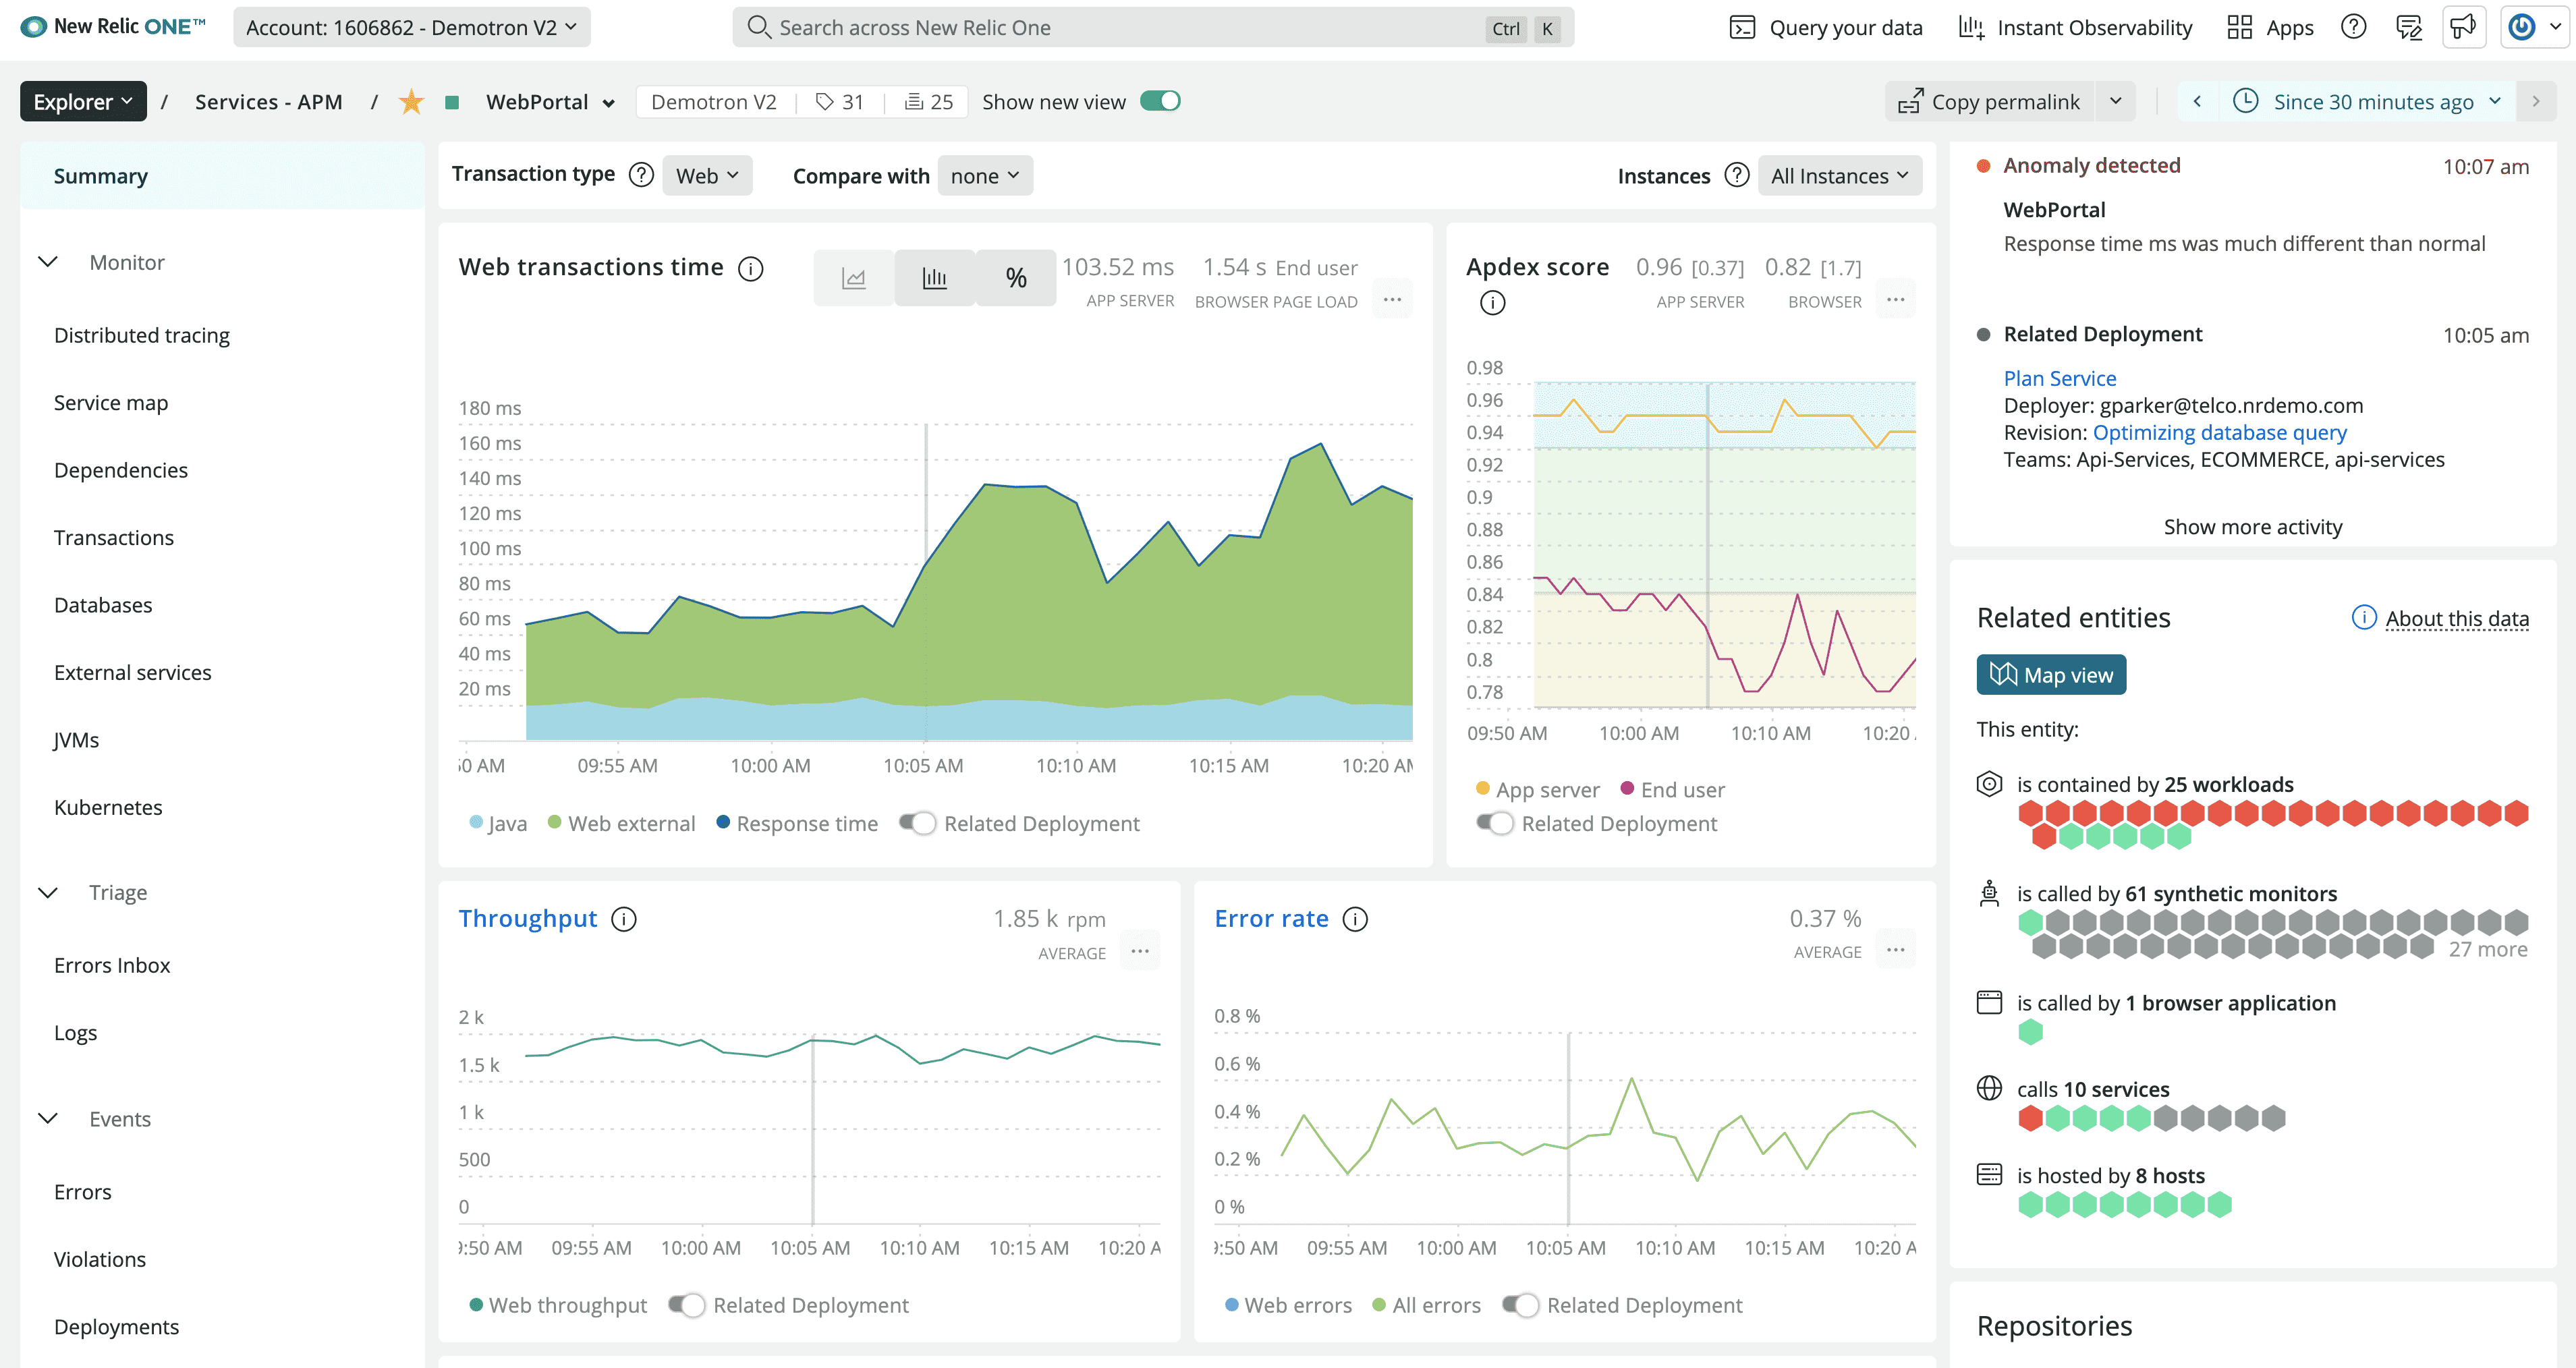
New Relic
New Relic is a SaaS-based full-stack observability platform with AI-driven automation for enterprises. The platform delivers comprehensive visibility across your entire tech stack, making it ideal for organizations needing deep performance insights.
Why New Relic Shines in 2026:
With observability becoming mission-critical, New Relic's unified platform combines APM, infrastructure monitoring, and AIOps in a single solution. Its generative AI capabilities now automate root cause analysis and predict anomalies before they impact customers.
Key Features:
- OpenTelemetry Application Performance Monitoring (APM): End-to-end visibility into application performance.
- Browser & Mobile Monitoring: Track frontend and mobile app performance.
- Infrastructure Monitoring: Monitor hosts, containers, and cloud services.
- AIOps & Analytics: AI-powered insights and anomaly detection.
2026 Relevance:
- Generative AI Insights: Automated root cause analysis and anomaly prediction.
- Full-Stack Observability: Unified view across the entire technology stack.
Pricing:
- Free Tier: 100 GB data ingestion/month.
- Paid Plans: ~$0.40/GB beyond free tier. User pricing: Core users $49/month; Full Platform starts at $10/month for the first user, $99/month for each additional (Standard tier, up to 5 users).
Pros:
- ✅ Comprehensive full-stack observability.
- ✅ Strong APM with detailed transaction tracing.
Cons:
- ❌ Complex pricing model.
- ❌ High per-user costs for enterprises.
Best For:
- Enterprise organizations needing mature, all-in-one monitoring.
- Teams requiring both frontend and backend performance visibility.
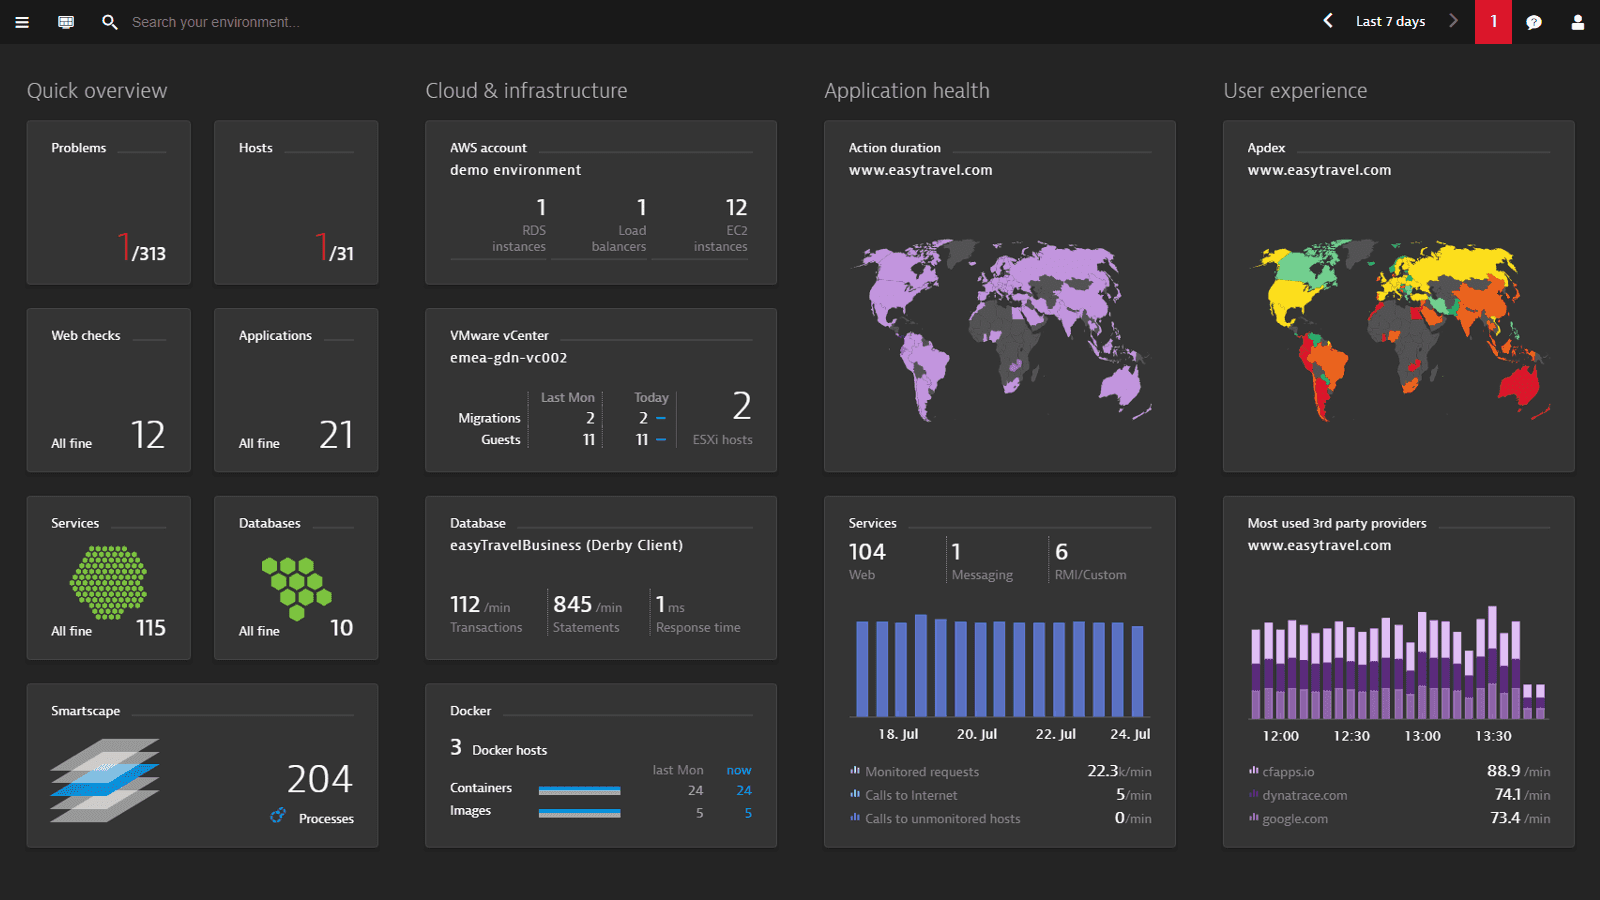
Dynatrace
Dynatrace is an AI-powered observability platform specializing in autonomous cloud operations and AIOps. It's the autonomous driving system for complex cloud architectures, eliminating manual troubleshooting.
Why Dynatrace Shines in 2026:
As cloud complexity explodes, Dynatrace's Davis AI engine automatically maps dependencies, pinpoints root causes, and suggests remediation steps. Its autonomous capabilities have become essential for teams managing sprawling microservices architectures.
Key Features:
- Autonomous Cloud Monitoring: AI-driven dependency mapping for microservices.
- Davis AI: Automated root cause analysis and incident resolution.
- Application Security: Integrated vulnerability scanning.
2026 Relevance:
- Autonomous Operations: Self-healing capabilities for hybrid/multi-cloud environments.
- Full-Stack Security: Integrated application and infrastructure vulnerability management.
Pricing:
- Foundation & Discovery: $7/month per host.
- Infrastructure Monitoring: $29/month per host.
- Full-Stack Monitoring: $58/month per 8 GiB host.
Pros:
- ✅ Reduces manual troubleshooting with AI.
- ✅ Enterprise-grade scalability.
- ✅ No per-user fees: Unlike New Relic, Dynatrace doesn't charge per engineer seat, making it more cost-effective for large teams.
Cons:
- ❌ Expensive for small teams.
- ❌ Steep learning curve.
Best For:
- Large enterprises managing complex cloud ecosystems.
- Organizations prioritizing autonomous operations and reduced MTTR.
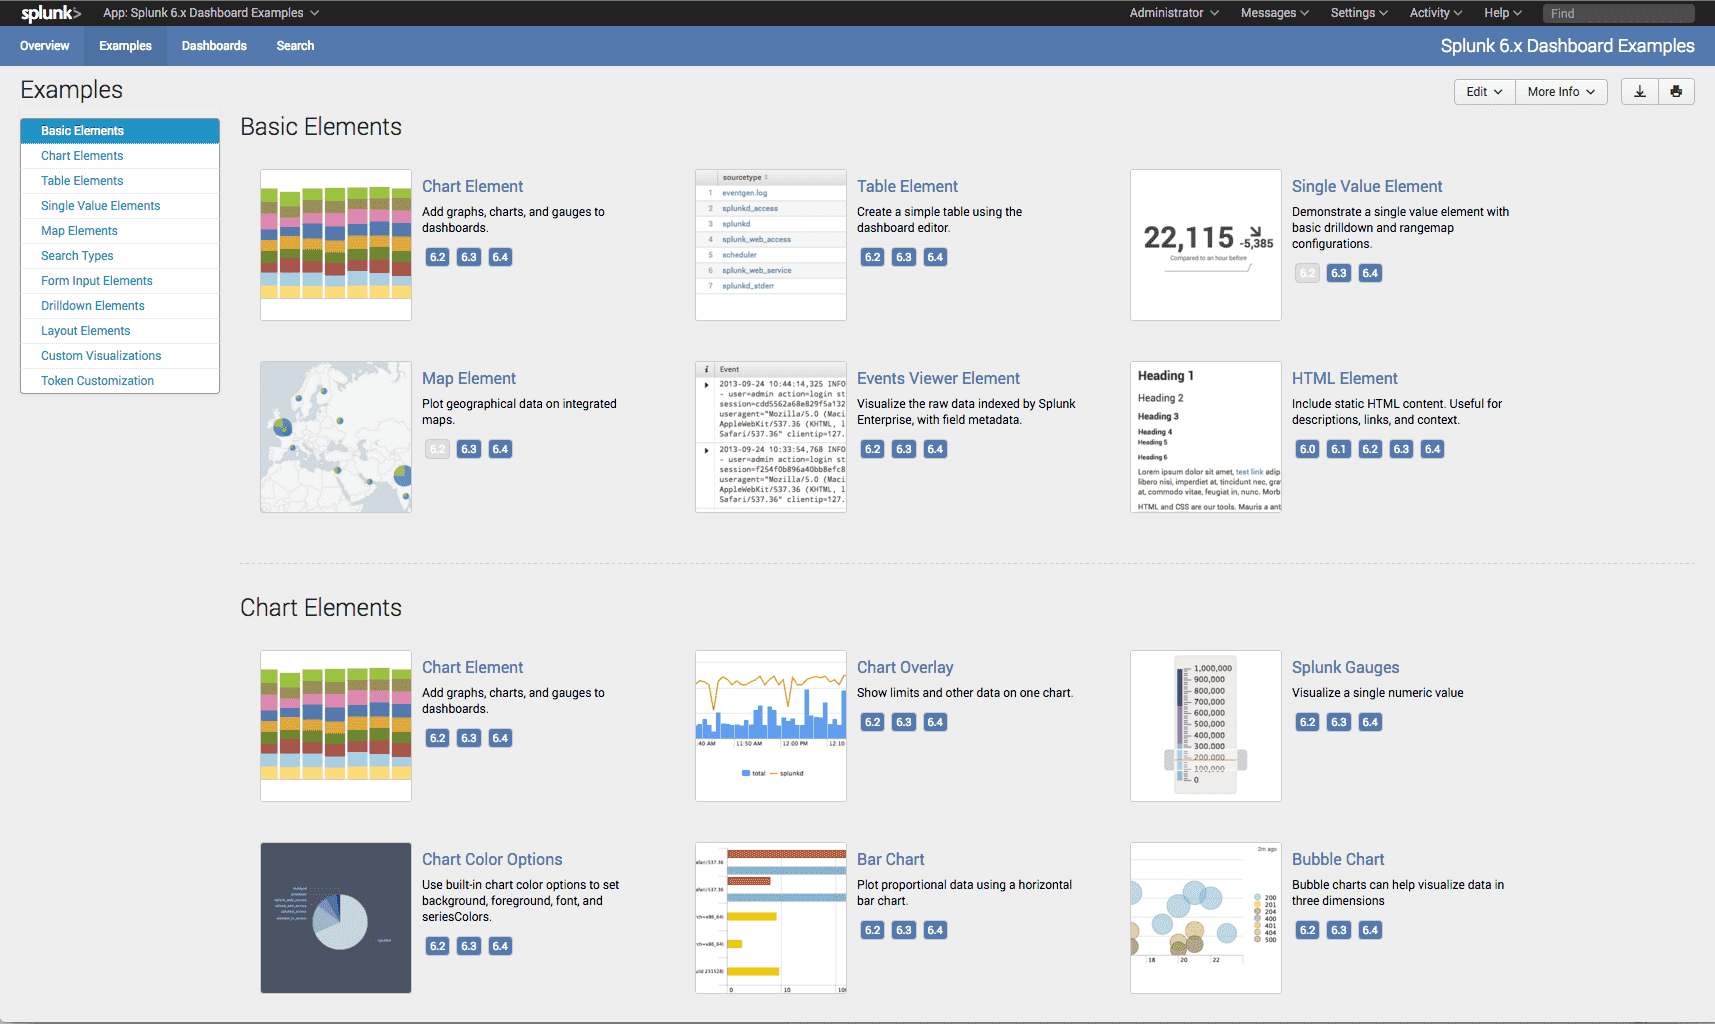
Splunk Observability
Splunk Observability is a unified platform combining metrics, traces, and logs with security analytics. It bridges the gap between DevOps and security teams with powerful correlation capabilities.
Why Splunk Shines in 2026:
With security and observability converging, Splunk's integrated platform provides a single source of truth for operations and security teams. Its AI/ML capabilities now detect threats within DevSecOps pipelines while maintaining operational visibility.
Key Features:
- Infrastructure Monitoring: Real-time cloud and container insights.
- APM & Distributed Tracing: End-to-end transaction visibility.
- Log Investigation: Integrated security and observability analytics.
2026 Relevance:
- AI/ML-Driven Security: Threat detection for DevSecOps pipelines.
- Unified Observability: Seamless integration between metrics, traces, logs, and security events.
Pricing:
- Flexible Plans: Starts at $15/month per host.
Pros:
- ✅ Combines observability with cybersecurity.
- ✅ Scalable for large enterprises.
Cons:
- ❌ Complex pricing tiers.
- ❌ Overkill for simple use cases.
Best For:
- Organizations integrating observability with security workflows.
- Teams needing advanced log analytics alongside performance monitoring.
Grafana Cloud
Grafana Cloud is a managed observability platform leveraging Loki, Tempo, and Mimir for full-stack monitoring. The Swiss Army knife for Grafana enthusiasts, it merges open-source flexibility with enterprise-grade scalability.
Why Grafana Cloud Adapts in 2026:
As OpenTelemetry becomes ubiquitous, Grafana Cloud’s native OTel pipelines let teams ingest data from AWS, Azure, and GCP without vendor-specific agents. Recent AI enhancements predict capacity needs, preventing cost overruns.
Key Features:
- Unified Querying: Correlate Prometheus metrics with Loki logs via LogQL.
- Incident Management: Built-in escalation policies for on-call teams.
- Cost Controls: Set budgets per team/project with automated alerts.
2026 Relevance:
- Generative AI Dashboards: Auto-generate dashboards from natural language queries.
- FinOps Integration: Allocate cloud costs by namespace or deployment.
Pricing:
- Free Tier: 10K metrics series, 50 GB logs/traces/profiles each, 14-day retention.
- Pro Plan: $19/month platform fee + usage-based pricing ($6.50 per 1K series, $0.50/GB for logs/traces).
Pros:
- ✅ Single UI for metrics, logs, traces.
- ✅ No lock-in – export data anytime.
Cons:
- ❌ Expensive for high-cardinality data.
- ❌ Locks advanced ML features behind enterprise plans.
Best For:
- Companies standardized on Grafana’s ecosystem.
- Teams needing hybrid cloud/on-prem deployments.
Coralogix
Coralogix is a cloud-native log analytics platform focused on cost optimization and real-time insights. The budget-friendly alternative for startups, it uses machine learning to slash logging costs without sacrificing usability.

Why Coralogix Wins in 2026:
With cloud costs under scrutiny, Coralogix’s ML-based tiered storage automatically archives low-value logs to S3, reducing bills by 60-70%. Its new Edge SDK now supports Rust and WebAssembly for IoT devices.
Key Features:
- Live Tail: Stream logs with sub-second latency.
- Anomaly Detection: Spot trends in error rates or API latency.
- SOC2 Compliance: Pre-built reports for audits.
2026 Relevance:
- 5G Logging: Ultra-low-latency ingestion for telco providers.
- LLM Integration: ChatGPT-powered log summarization.
Pricing:
- Logs: $0.42/GB ingested.
- Traces: $0.16/GB ingested.
- Metrics: $0.05/GB (1GB = 1,000 time series).
- Free Trial: 14 days with full feature access.
Pros:
- ✅ 80% cheaper than Datadog for log storage.
- ✅ GDPR-ready with EU data residency.
Cons:
- ❌ APM requires separate tools.
- ❌ Limited custom dashboard options.
Best For:
- SaaS startups scaling on AWS/GCP.
- DevOps teams prioritizing log cost reduction.
Hybrid/Freemium Solutions
Elastic Stack (ELK)
Elastic Stack combines Elasticsearch, Kibana, and APM into a versatile observability suite. The go-to for security-first teams, it bridges the gap between DevOps and SecOps with integrated SIEM and threat hunting.
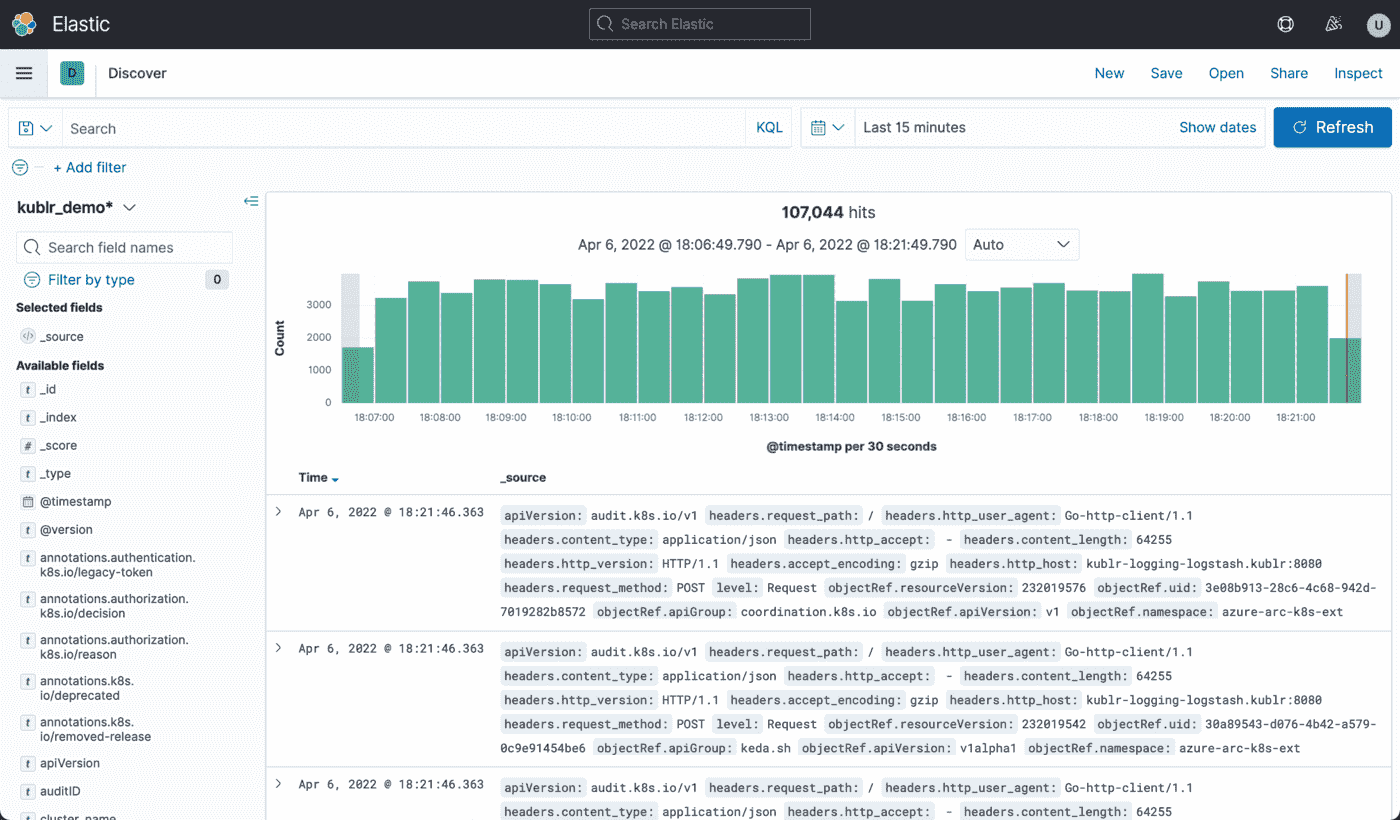
Why Elastic Evolves in 2026:
As ransomware attacks surge, Elastic’s Unified Security & Observability merges APM traces with threat intel feeds. New vector search capabilities enable AI-driven log classification, cutting alert fatigue by 40%.
Key Features:
- APM & RUM: Track mobile app crashes and backend errors.
- Machine Learning: Forecast disk usage and anomaly detection.
- Service Maps: Visualize dependencies across on-prem and cloud.
2026 Relevance:
- GenAI Integration: Natural language querying via Elasticsearch.
- Zero-Trust Monitoring: Audit logs for SPIFFE/SPIRE identities.
Pricing:
- Free Tier: Basic features with community support.
- Enterprise: From $95/month per node (advanced security).
Pros:
- ✅ Combines APM, logs, and security in one stack.
- ✅ 50+ pre-built compliance dashboards.
Cons:
- ❌ Resource-heavy – requires 16GB+ RAM per node.
- ❌ Complex licensing for hybrid deployments.
Best For:
- Banks and healthcare providers needing HIPAA/GDPR compliance.
- Teams running hybrid VMware/Kubernetes environments.
Graylog
Graylog offers centralized log management with a focus on compliance and threat detection. The auditor’s favorite, it transforms raw logs into actionable security insights without the Elasticsearch complexity.
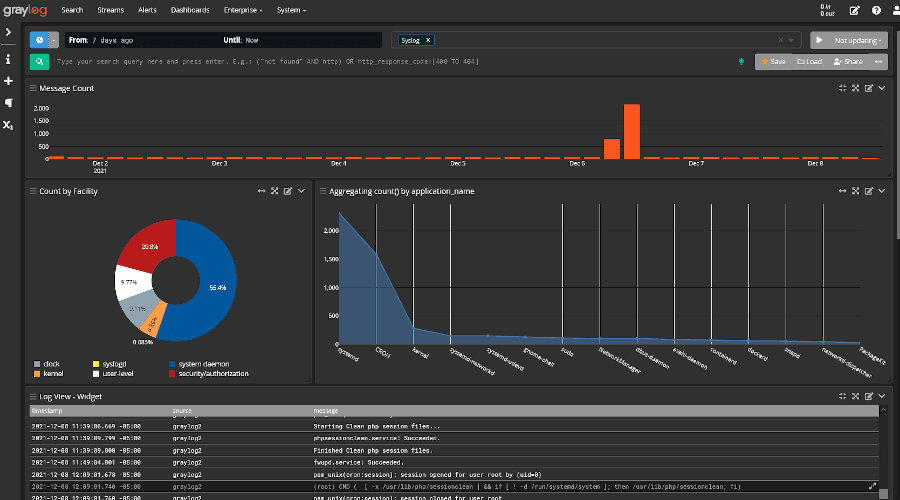
Why Graylog Adapts in 2026:
With new SEC regulations, Graylog’s AI-Powered Compliance Engine auto-generates audit reports and flags GDPR violations. Its lightweight architecture now handles 1TB/day on a single node.
Key Features:
- Stream Processing: Enrich logs with threat intel feeds in real time.
- Role-Based Access: Granular permissions for SOC teams.
- PCI-DSS Templates: Pre-built dashboards for payment systems.
2026 Relevance:
- Quantum-Safe Encryption: FIPS 140-3 compliant log storage.
- LLM Analyzers: Detect sensitive data leaks via NLP.
Pricing:
- Graylog Open: Source-available under SSPL license (not Apache/MIT). Free to self-host with community support.
- Enterprise: $1,500/month (100 GB/day ingest).
Pros:
- ✅ Passes strict financial audits out-of-the-box.
- ✅ 30% faster log queries than vanilla Elasticsearch.
Cons:
- ❌ No native APM or tracing.
- ❌ Limited visualization customization.
Best For:
- Government agencies and Fortune 500 companies.
- Teams managing FedRAMP or ISO 27001 compliance.
Netdata
Netdata provides real-time infrastructure monitoring with a focus on simplicity. The instant visibility solution, it auto-discovers every service, container, and cloud resource in minutes.
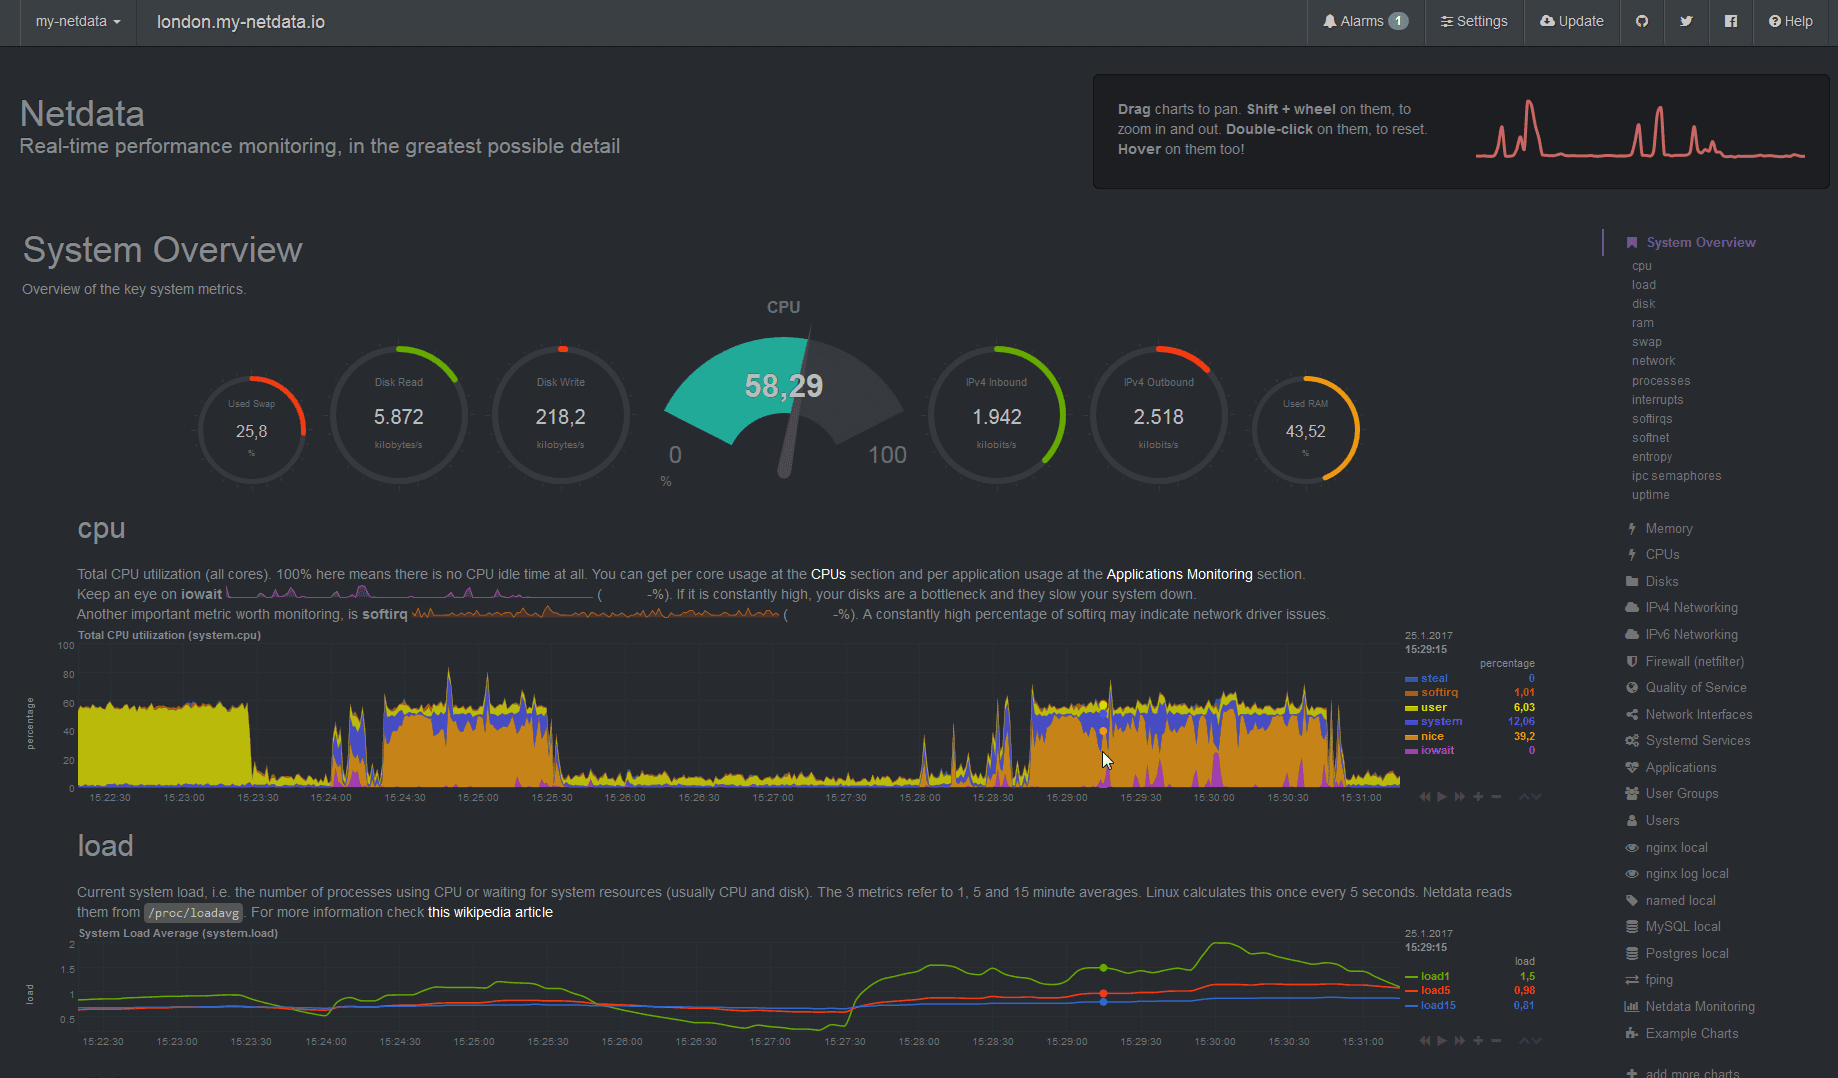
Why Netdata Excels in 2026:
As edge computing explodes, Netdata’s 1MB Agent runs on Raspberry Pi and legacy hardware, providing metrics with 1-second granularity. New energy analytics help teams track carbon footprints across data centers.
Key Features:
- Zero-Config Alerts: Pre-configured thresholds for 200+ services.
- Distributed Architecture: Buffer metrics during network outages.
- Power Monitoring: Correlate CPU usage with kWh consumption.
2026 Relevance:
- Green IT Metrics: Track Scope 2 emissions per service.
- eBPF Security: Detect rootkits via kernel-level telemetry.
Pricing:
- Free: Up to 5 connected nodes with data stored on your infrastructure.
- Business: $6/node/month (unlimited metrics, logs, and retention).
Pros:
- ✅ Deploys on 20-year-old Linux kernels.
- ✅ 10x lighter than Prometheus exporters.
Cons:
- ❌ Basic historical analysis.
- ❌ No native OpenTelemetry support.
Best For:
- MSPs managing 1,000+ servers.
- Sustainable tech initiatives tracking carbon KPIs.
FAQ
- What is the best Datadog alternative?
The best alternative depends on your specific needs:
- For cost savings and data sovereignty: Uptrace offers enterprise-grade observability with 80% lower costs through OpenTelemetry and ClickHouse. Ideal for teams wanting full control over their data.
- For Kubernetes-native monitoring: Prometheus + Grafana remains the industry standard, with deep integration into cloud-native ecosystems.
- For enterprise AI-driven monitoring: Dynatrace excels with automated root cause analysis and predictive anomaly detection.
- For comprehensive full-stack observability: New Relic provides the closest feature parity to Datadog with usage-based pricing.
- Is there a free Datadog alternative?
Yes, several free alternatives exist:
Fully Free Open-Source:
- Uptrace - Free forever for self-hosted deployments (AGPLv3 license)
- Prometheus + Grafana - Completely free with unlimited metrics and logs
- VictoriaMetrics - Free community edition with no restrictions
- Netdata - Free for up to 5 connected nodes
Free Tiers:
- Grafana Cloud - Free tier includes 10K metrics series, 50GB logs/traces/profiles each
- Elastic Stack - Open-source version free to download and self-host
- Graylog - Open-source edition supports unlimited data ingestion
- What's cheaper than Datadog?
Most alternatives are significantly cheaper than Datadog:
- Uptrace: Up to 80% cost reduction with predictable pricing (no per-host charges)
- VictoriaMetrics: 10x lower resource consumption reduces infrastructure costs
- Grafana Cloud: Pay-as-you-go starts at $0.50/GB for logs vs Datadog's $2.50/GB
- Elastic Stack: Self-hosted saves on licensing while retaining full features
- New Relic: Usage-based pricing often 40-60% cheaper for similar workloads
The exact savings depend on your data volume, retention period, and number of hosts monitored.
- Is Datadog open source?
No, Datadog is a proprietary SaaS platform. The Datadog Agent has some open-source components on GitHub, but the core platform (backend, UI, analytics) is closed-source and requires a subscription.
For truly open-source alternatives, consider:
- Uptrace (AGPLv3)
- Prometheus + Grafana (Apache 2.0)
- Apache SkyWalking (Apache 2.0)
- VictoriaMetrics (Apache 2.0)
- Can I self-host Datadog?
No, Datadog does not offer a self-hosted or on-premise deployment option. It is exclusively a cloud-based SaaS platform.
If self-hosting is required for compliance, data sovereignty, or cost reasons, consider these alternatives:
- Uptrace - Full self-hosted deployment with Docker/Kubernetes
- Elastic Stack - Complete on-premise installation available
- Prometheus + Grafana - Fully self-contained stack
- VictoriaMetrics - Self-hosted with horizontal scaling
- Graylog - On-premise log management
Conclusion
The best Datadog alternative depends on your needs:
- Open-Source Agility: Uptrace delivers enterprise-grade observability at 1/10th of Datadog’s cost, with no data lock-in.
- Commercial Power: Dynatrace suits enterprises needing AI-driven automation.
- Hybrid Flexibility: Elastic Stack bridges observability and security.
Try Uptrace Today – Monitor your entire stack for free with OpenTelemetry and ClickHouse.
Need a practical plan to leave Datadog? Use our Get Datadog migration guide to map agents, dashboards, and alerting rules to Uptrace with minimal friction.
You may also be interested in: