Uptrace v1.7 is released
The Uptrace team is pleased to present the latest v1.7 release, which introduces dark mode, revamped navigation, dashboards list, system tracing metrics, and much more.
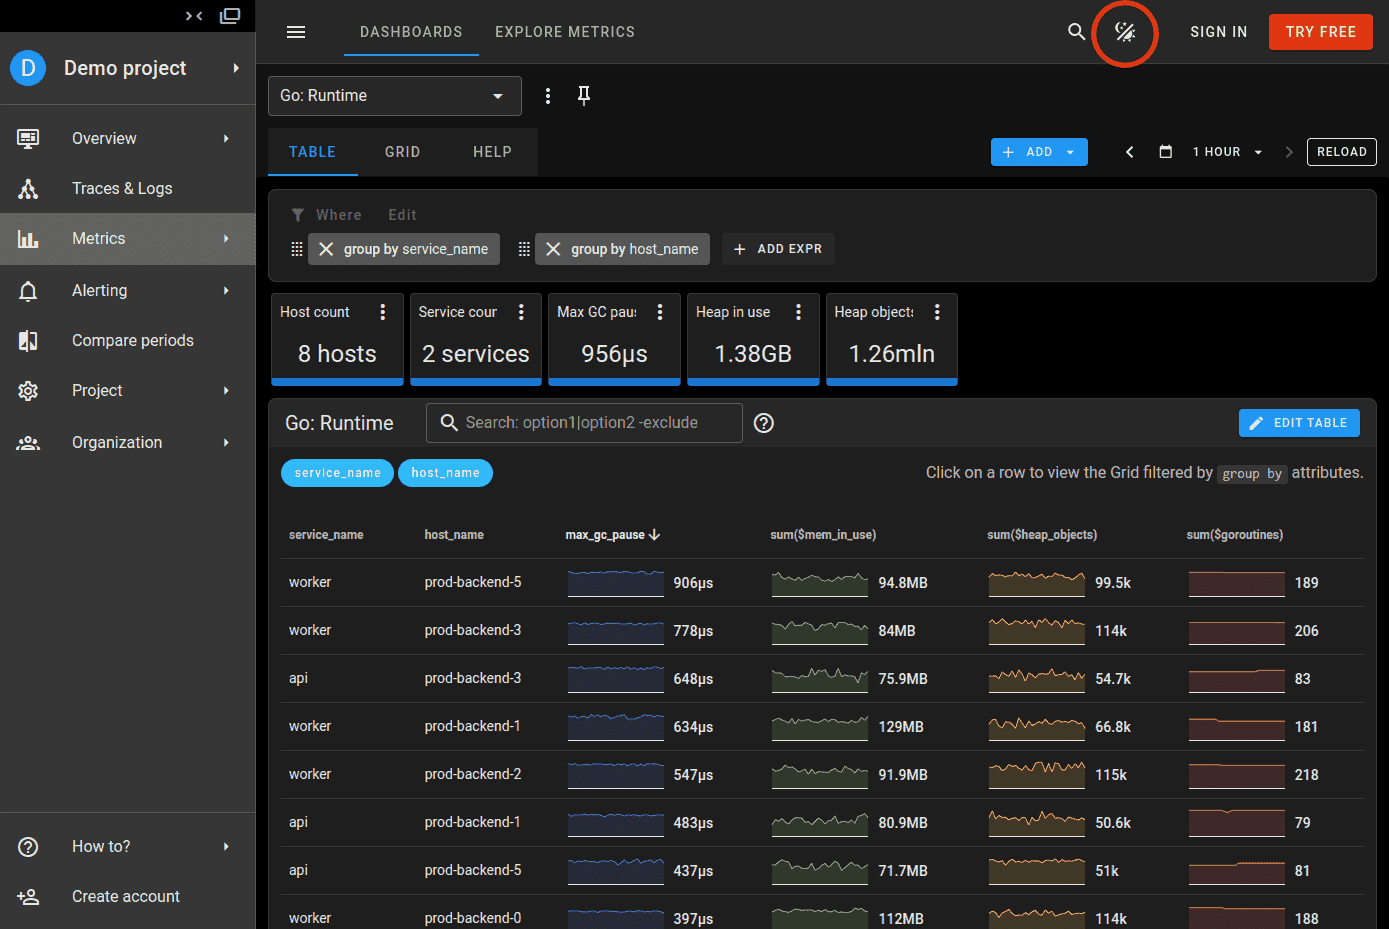
New nav and dark mode
Uptrace v1.7 improves navigation and adds support for the dark mode.
Dark mode should be enabled automatically if your operating system uses a dark theme. It can also be enabled manually using the switch in the upper right corner.
Dashboards improvements
Uptrace now provides a separate view that allow to list and manage your dashboards.
Uptrace also provides quick access to dashboards that have the same prefix, for example, here is how dashboards with the "Hostmetrics: " prefix are grouped together.
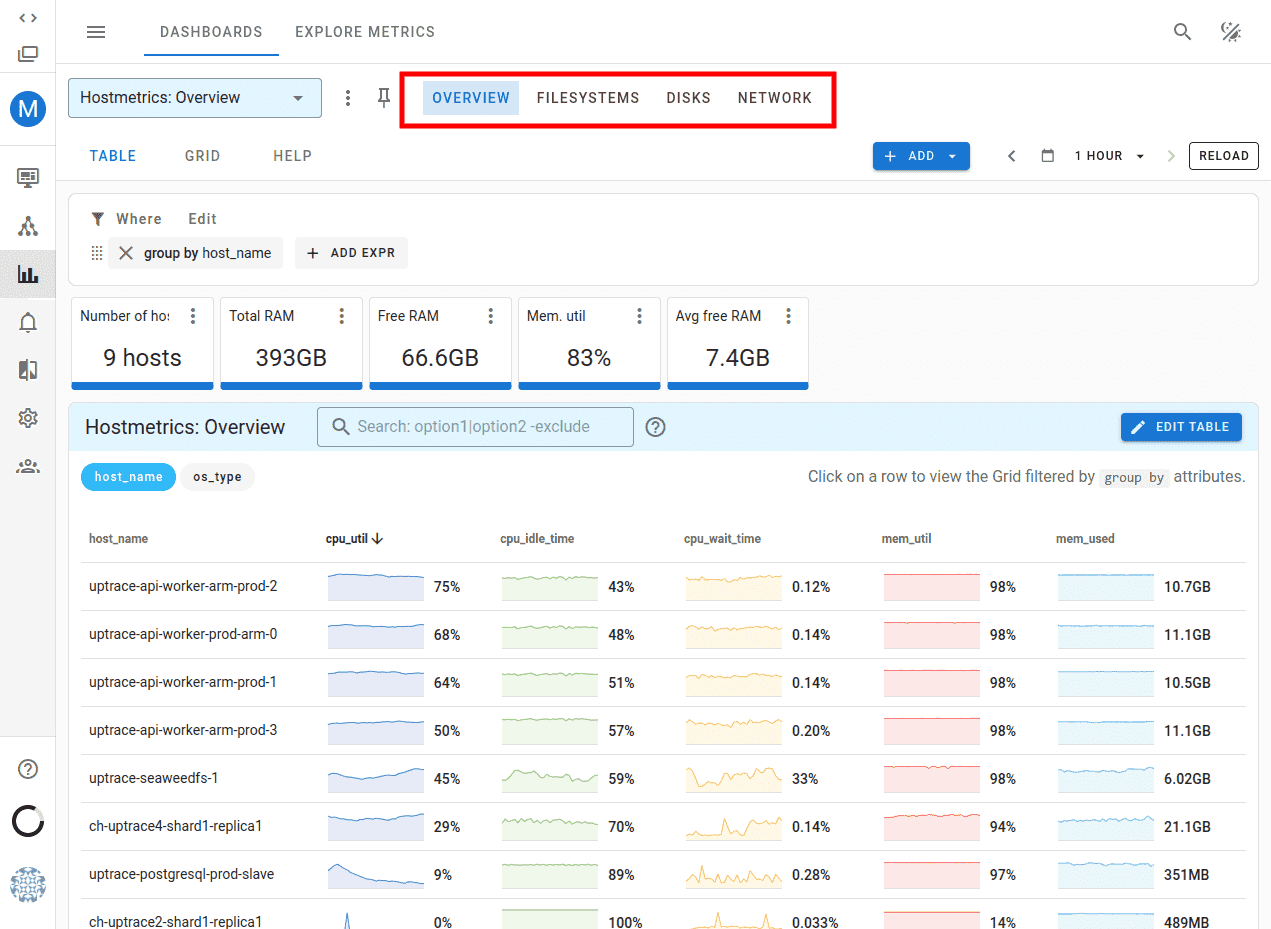
You may need to reset your existing dashboards via UI to benefit from this.
Querying spans from metric dashboards
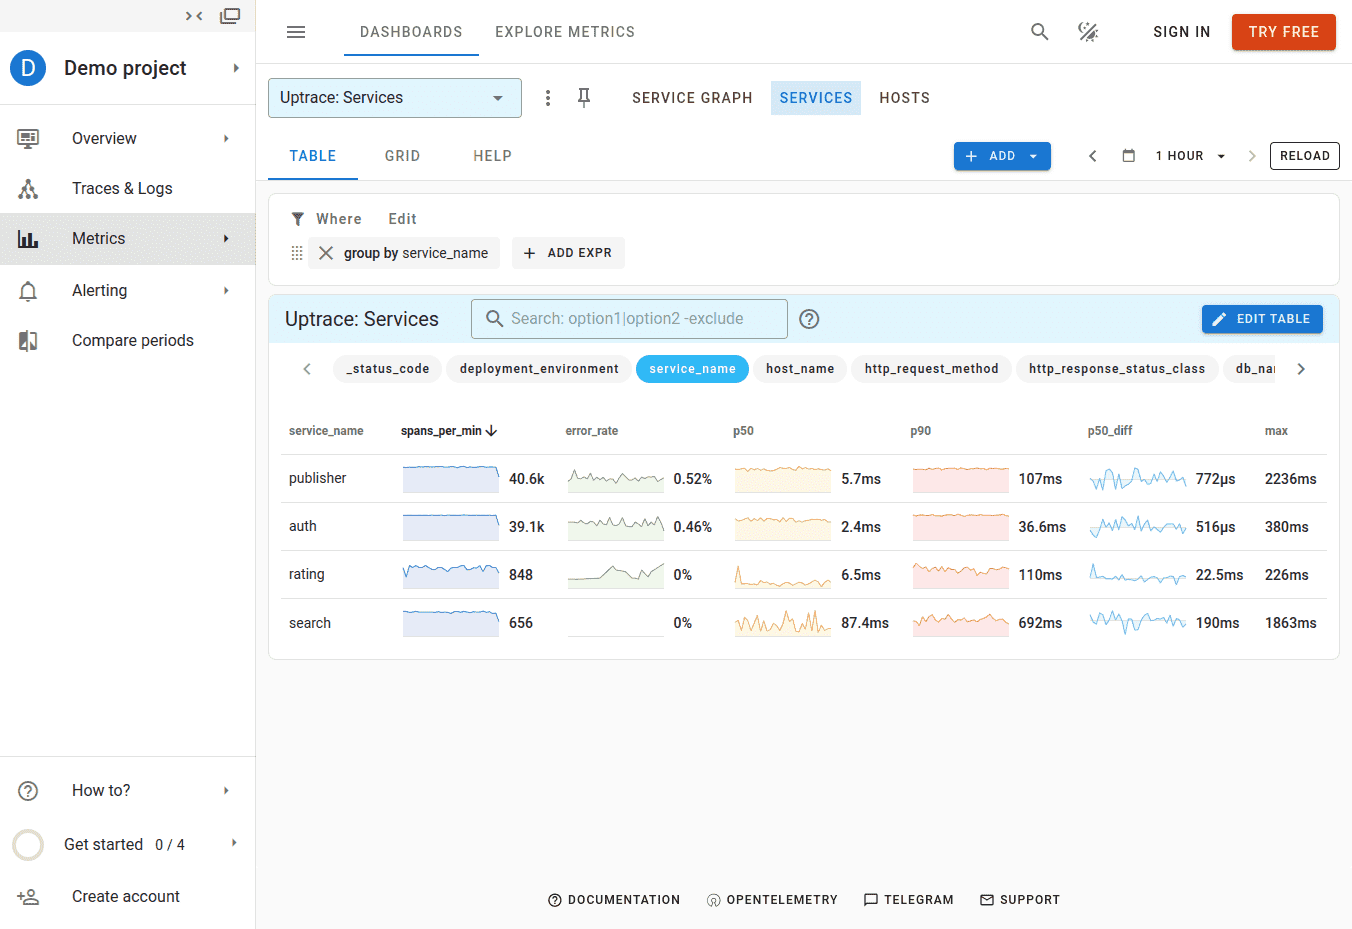
Added ability to query spans using system metrics provided by Uptrace: uptrace_tracing_spans, uptrace_tracing_logs, and uptrace_tracing_events.
Such system metrics allow to query spans table directly without actually creating any metrics. You have access to all span attributes and can use them for filtering and grouping.
JSON API and auth token
Added support for JSON API using the user.auth_token for authentication.
For now JSON API allows to query spans, create metric monitors, and annotations.
For example, you can get a list of host names using the group by host_name query like this:
curl https://api.uptrace.dev/api/v1/tracing/<project_id>/groups?time_gte=2023-07-10T00:00:00Z&time_lt=2023-07-11T00:00:00Z&query=group%20by%20host_name \
  --header "Authorization: Bearer <token>"
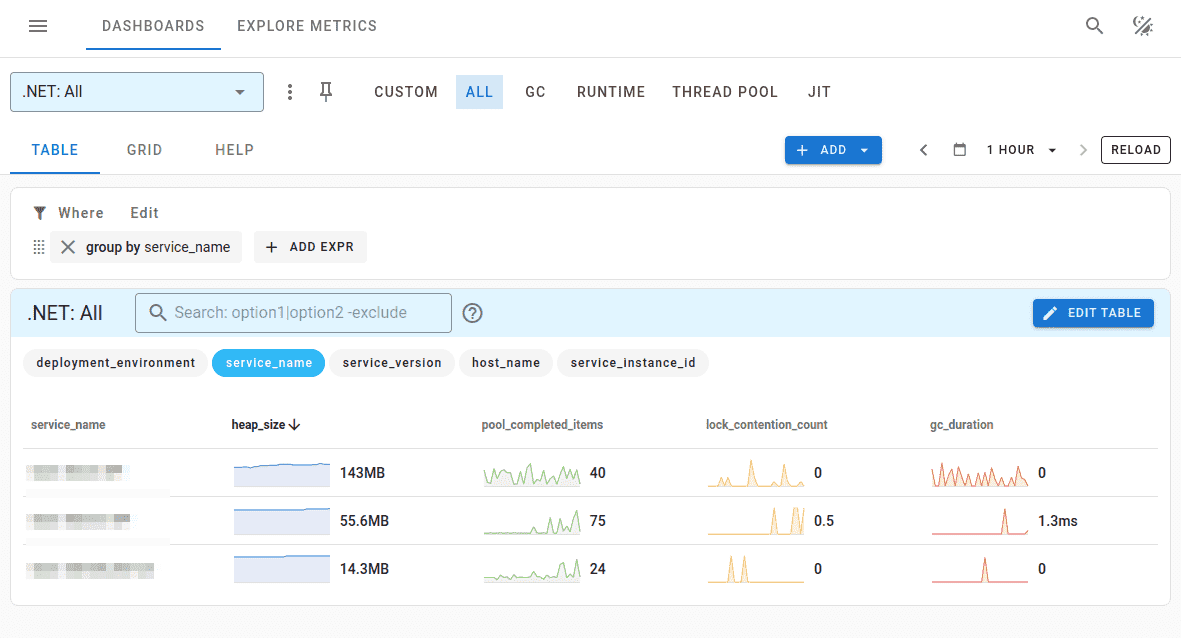
.NET metrics
Added pre-built dashboards for .NET system metrics reported by OpenTelemetry instrumentation.
Other changes
- Updated Tempo API to the latest version. You should be able to use Tempo integration with the recent Grafana version.
- Added new project setting
force_span_nameby @HeCorr. See the config for details. - Added ability to disable TLS when configuring SMTP mailer by @rgl.
The full changelog is available on GitHub.