OpenTelemetry Go-Zero monitoring [otelzero]
By integrating OpenTelemetry into your Go-Zero application, you can gain insights into its performance, troubleshoot issues, and analyze its behavior in real-time or post-analysis using the supported monitoring and observability tools.
What is OpenTelemetry?
OpenTelemetry is an open-source observability framework that aims to standardize and simplify the collection, processing, and export of telemetry data from applications and systems.
OpenTelemetry supports multiple programming languages and platforms, making it suitable for a wide range of applications and environments.
OpenTelemetry enables developers to instrument their code and collect telemetry data, which can then be exported to various OpenTelemetry backends or observability platforms for analysis and visualization. Configuration management is simplified through OpenTelemetry environment variables, allowing teams to adjust telemetry settings across development, staging, and production environments without modifying application code.
What is Go-Zero?
Go-Zero is an open-source microservices framework for Go programming language. It is designed to simplify the development of high-performance, scalable, and reliable microservices.
Usage
You can instrument your Go-Zero application by enabling OpenTelemetry instrumentation to capture relevant telemetry data, such as traces and metrics.
To start monitoring your Go-Zero application, add the following lines to the YAML config. If you don't have an Uptrace DSN, follow the Get started guide.
Telemetry:
  Name: api-api
  Endpoint: localhost:14317
  Sampler: 1.0
  Batcher: otlpgrpc
  OtlpHeaders:
    uptrace-dsn: '<FIXME>'
You can also find a Docker example on GitHub.
What is Uptrace?
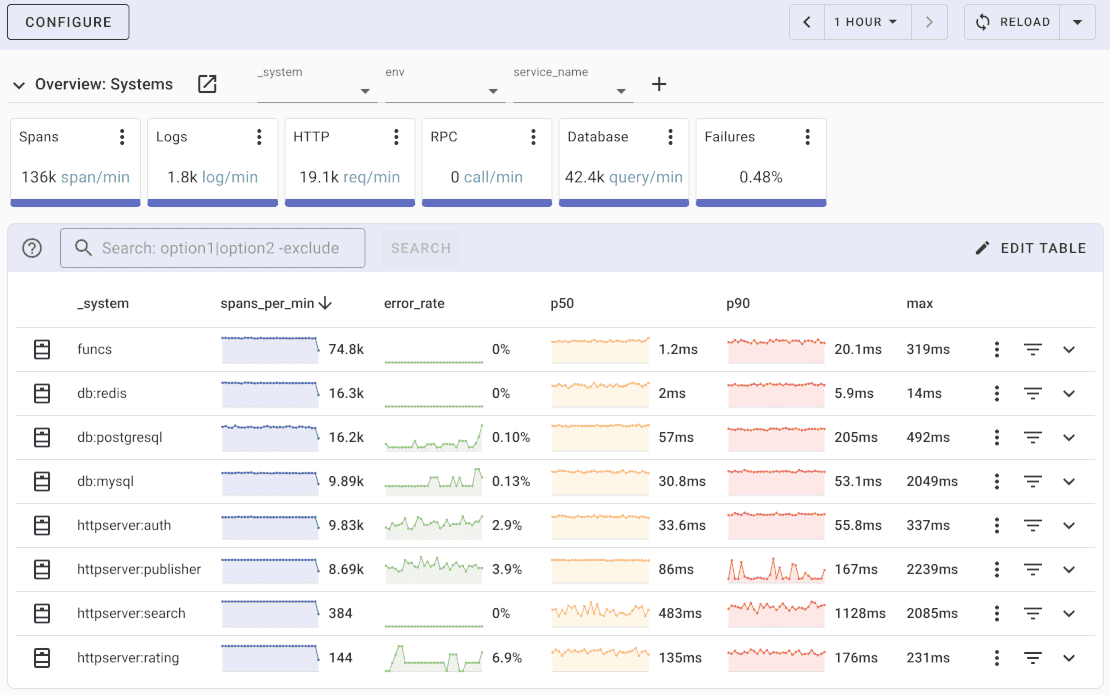
Uptrace is an open source APM for OpenTelemetry that supports distributed tracing, metrics, and logs. You can use it to monitor applications and troubleshoot issues.

Uptrace comes with an intuitive query builder, rich dashboards, alerting rules, notifications, and integrations for most languages and frameworks.
Uptrace can process billions of spans and metrics on a single server and allows you to monitor your applications at 10x lower cost.
In just a few minutes, you can try Uptrace by visiting the cloud demo (no login required) or running it locally with Docker. The source code is available on GitHub.
What's next?
Now that you've instrumented your go-zero application, you can visualize traces, analyze performance metrics, and identify bottlenecks in your microservices architecture. Consider exploring Gin or gRPC instrumentation for additional Go observability patterns.