Top 10 Observability Tools in 2026: APM Platforms Compared
The observability tools market is projected to reach $62.9 billion by 2025, with Datadog commanding 51.82% market share in data center management and New Relic holding 24% in system administration. But which tool is right for your team?
OpenTelemetry has shifted the landscape significantly — now the second-largest CNCF project after Kubernetes, it has become the industry standard for instrumentation, with roughly half of organizations already using or planning to adopt it. This changes how you should evaluate platforms: instrumentation portability and freedom from vendor lock-in matter more than they did even two years ago.
This guide compares the top 10 observability platforms based on market share, user reviews, pricing, and real-world performance to help you make an informed decision.
What is Observability?
Observability gives you the ability to understand what's happening inside your systems by examining their outputs. Unlike traditional monitoring that tells you when something breaks, observability helps you understand why it broke and how to prevent it from happening again.
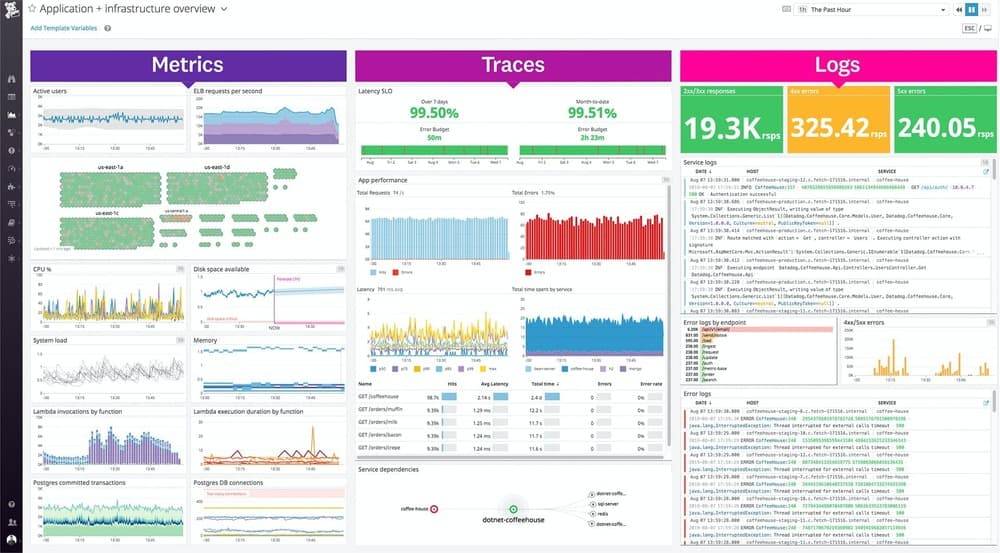
Observability platforms collect three types of data: metrics (performance numbers), logs (event records), and traces (request flows), then correlate them to provide complete system visibility. This is essential for teams managing complex, distributed applications where traditional monitoring falls short.
For a comprehensive understanding of observability see our detailed guide to observability.
Observability Tools vs Platforms
Observability Tools focus on specific functions like log analysis or metrics collection. Examples include Prometheus (metrics) or Jaeger (tracing).
Observability Platforms provide comprehensive, integrated solutions that combine multiple data types and analysis capabilities. Most organizations prefer platforms for unified visibility and reduced tool sprawl.
What's Changing in Observability in 2026
Three forces are reshaping how teams choose observability platforms this year.
OpenTelemetry as the default standard. With OpenTelemetry now the second-largest CNCF project after Kubernetes, it is the default instrumentation choice for new projects. Roughly 50% of organizations are using it or have active adoption plans. This matters for vendor selection: platforms built on OTel-native pipelines let you switch backends without re-instrumenting your code, while platforms using proprietary agents create long-term lock-in. The OpenTelemetry Collector handles routing telemetry to any backend, giving teams flexibility regardless of which platform they ultimately choose.
Cost pressure from per-host billing. Teams running at scale are scrutinizing Datadog invoices that combine per-host charges, per-GB ingestion fees, and per-custom-metric pricing. The unpredictability of this model — where adding a single new service can spike monthly costs significantly — is pushing engineering teams to evaluate alternatives more seriously. Several vendors, including Uptrace and Better Stack, have responded with flat-rate or consumption-based models that are easier to budget.
AI agent observability needs. March 2026 saw the first experimental release of OpenTelemetry GenAI Semantic Conventions — standardized attributes for tracing AI agent execution: gen_ai.request.model, gen_ai.usage.input_tokens, gen_ai.usage.output_tokens, and gen_ai.operation.name. Support has landed in Datadog (v1.37+) and Grafana. Teams running LLM-powered features now have a standard way to track model usage, token costs, and agent behavior across OpenAI, Anthropic, AWS Bedrock, and Azure AI.
Top 10 Observability Platforms: 2026 Comparison
| Tool | Market Share | Customers | Starting Price | Best For |
|---|---|---|---|---|
| Datadog | 51.82% | 47,431+ | $15/host/month | Enterprise |
| New Relic | 24.00% | 175,839+ | $99/month | Mid-market |
| Grafana (LGTM) | 4.03% | 26,550+ | Free / Cloud $49/mo | Flexible stacks |
| Dynatrace | 3.38% | 10,675+ | ~$69/host/month | AI-powered |
| Prometheus | 2.43% | 7,528+ | Free/Open Source | Metrics |
| Splunk | 1.82% | 14,885+ | Custom pricing | Security |
| Elastic | 1.20% | 5,000+ | $95/month | Log-heavy |
| Jaeger | CNCF graduated | Wide adoption | Free/Open Source | Distributed tracing |
| Better Stack | Growing | 5,000+ | Free / $24/month | Logs + uptime |
| Uptrace | Growing | 3,000+ | $30/month | OTel-native APM |
Enterprise Leaders
Datadog
Market Position: Dominant market leader with 51.82% share
Datadog built its position on breadth: 450+ integrations, strong APM, infrastructure monitoring, security, and a polished UI that teams can adopt quickly without deep configuration work. For organizations running multi-cloud environments with diverse technology stacks, no other platform matches its coverage or ecosystem depth.
The cost structure is its biggest friction point. Per-host pricing starts at $15/host/month for infrastructure monitoring, but APM, log management, custom metrics, and security features each add separate line items. At 100+ hosts with full-stack monitoring, annual contracts frequently exceed $100K. The combination of per-host + per-GB + per-custom-metric billing makes budgeting difficult as systems scale, which has driven many teams to evaluate alternatives.
Best For: Large enterprises with complex, multi-cloud environments and budget to match
Pricing: $15–$23/host/month; full-stack monitoring scales significantly with features and volume
New Relic
Market Position: Strong second with 24% market share, 175,839+ customers
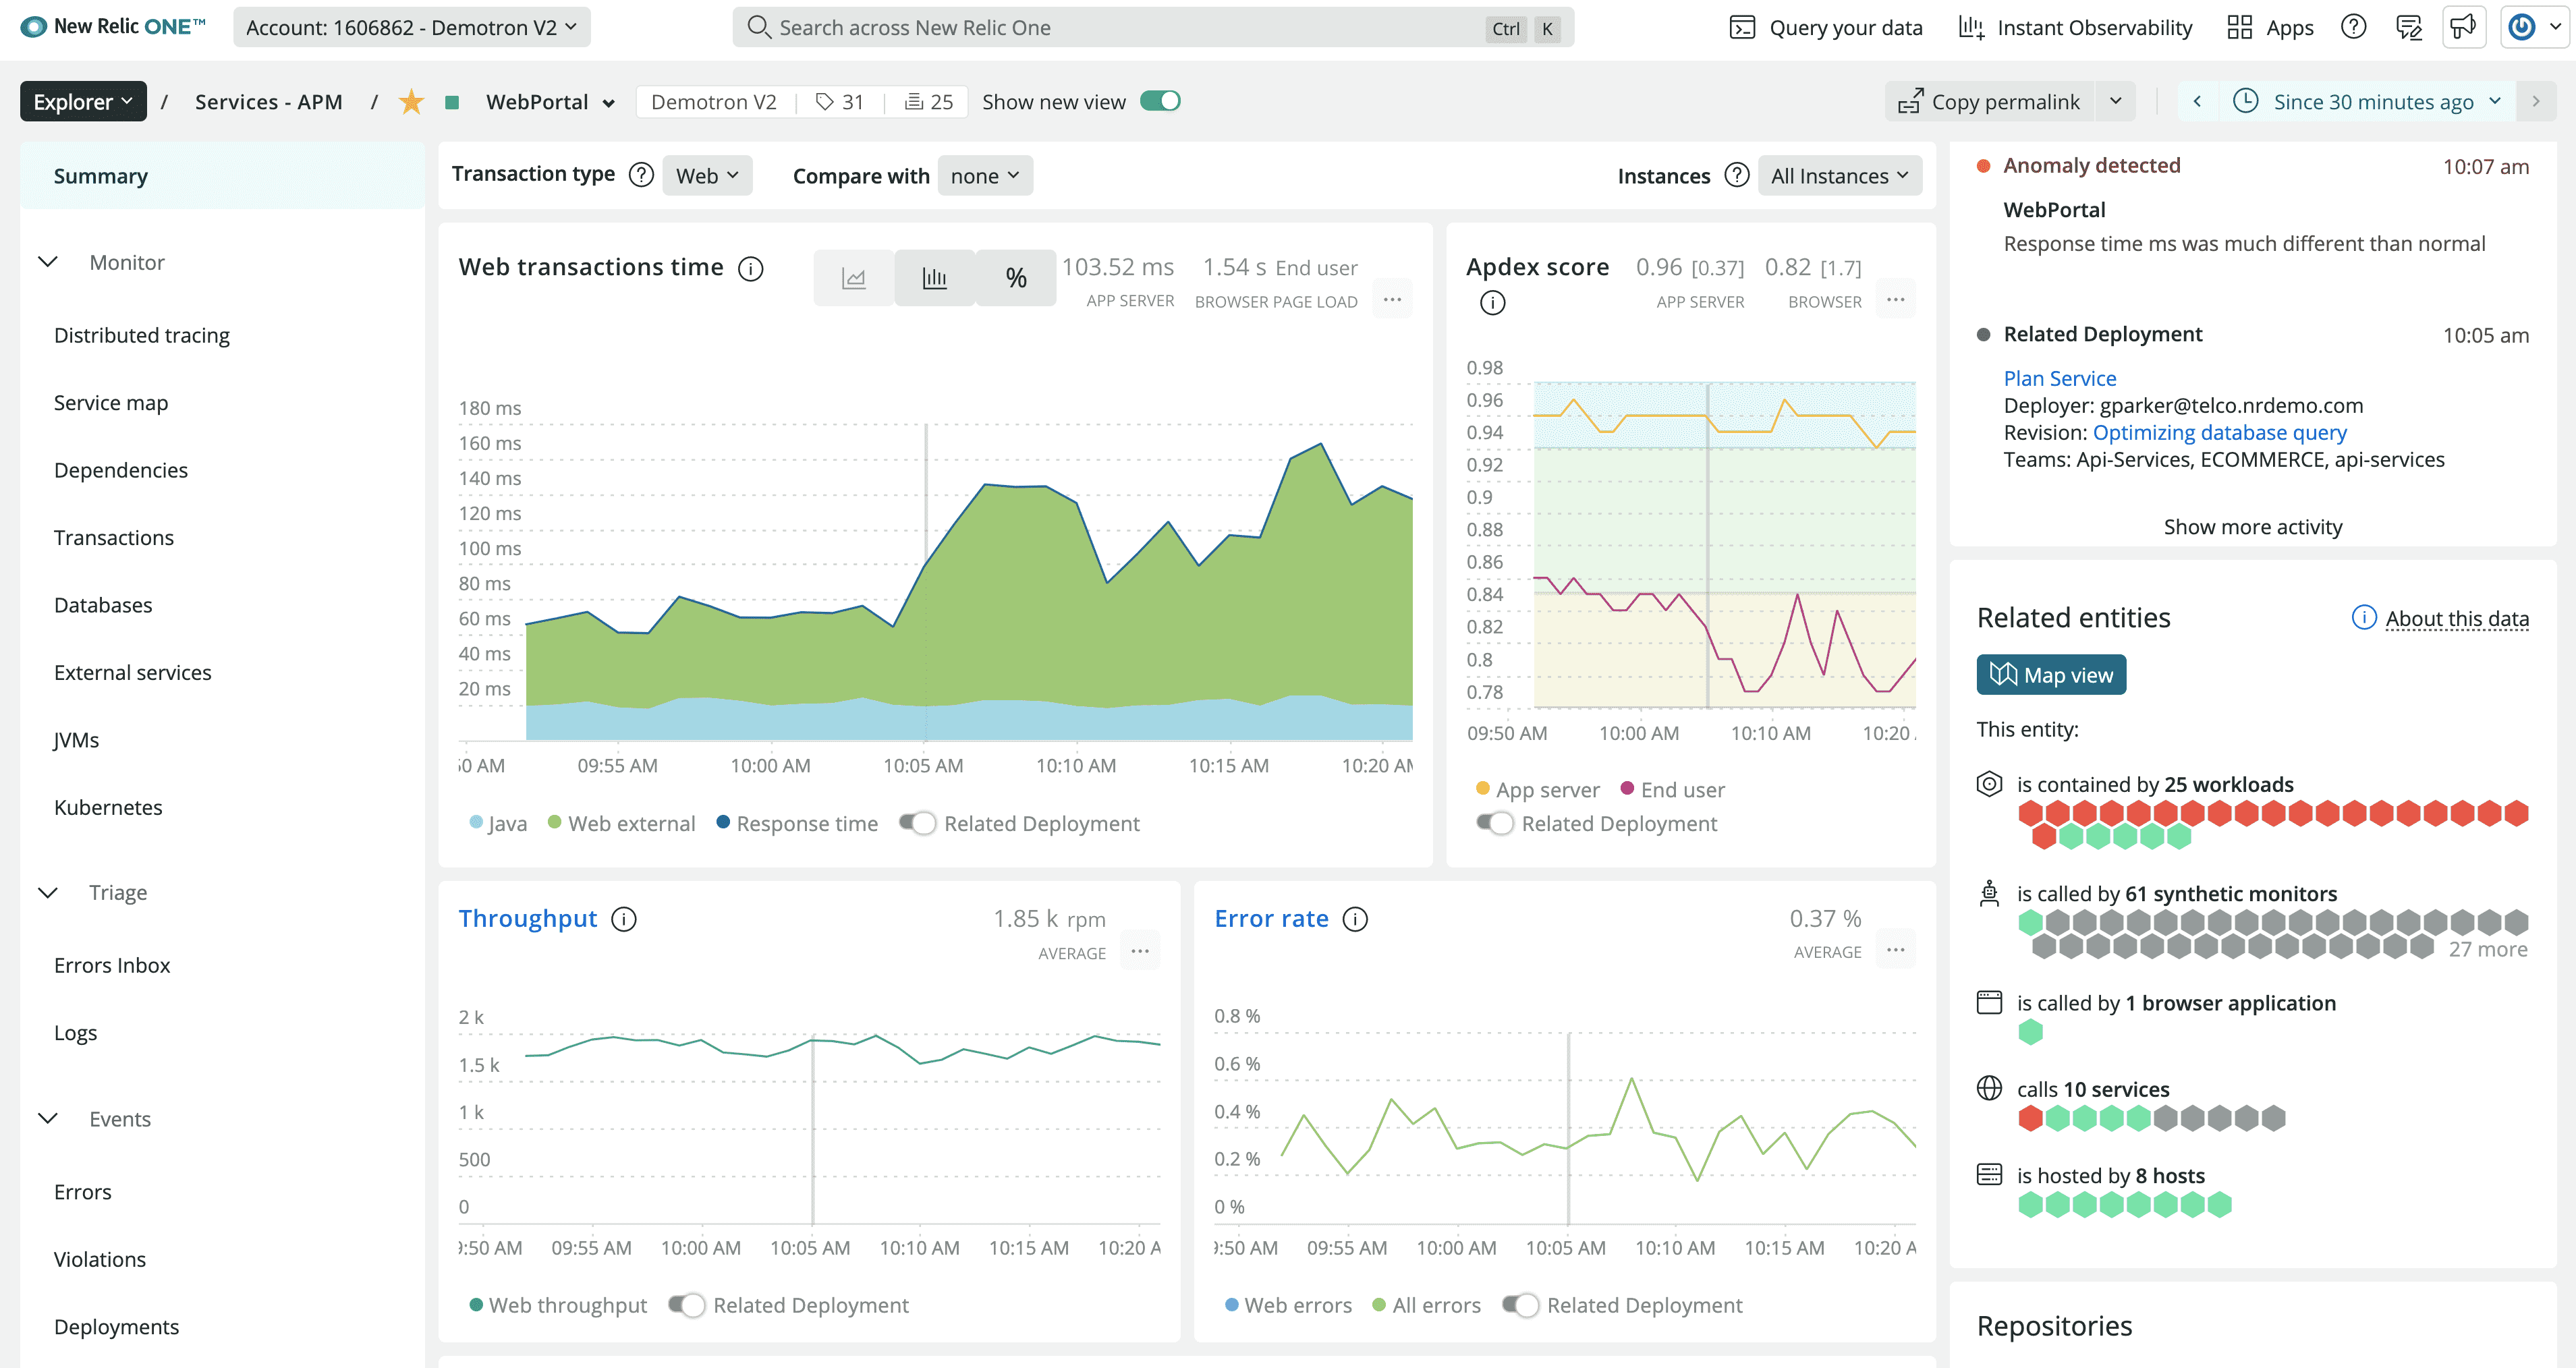
New Relic shifted to consumption-based pricing in 2021, which made costs more predictable for teams that previously struggled with per-host models. The 100GB/month free tier covers meaningful workloads, and the platform handles traces, metrics, and logs in a single UI without requiring multiple tool integrations.
Costs can still surprise at high data volumes — ingestion above the free tier scales at $0.30/GB. The platform's depth is solid for application monitoring but less comprehensive than Datadog for infrastructure-level coverage.
Best For: Growing companies needing scalable observability with predictable, usage-based pricing
Pricing: Free tier (100GB/month), paid plans from $99/month
Dynatrace
Market Position: Premium AI-first platform, 3.38% market share
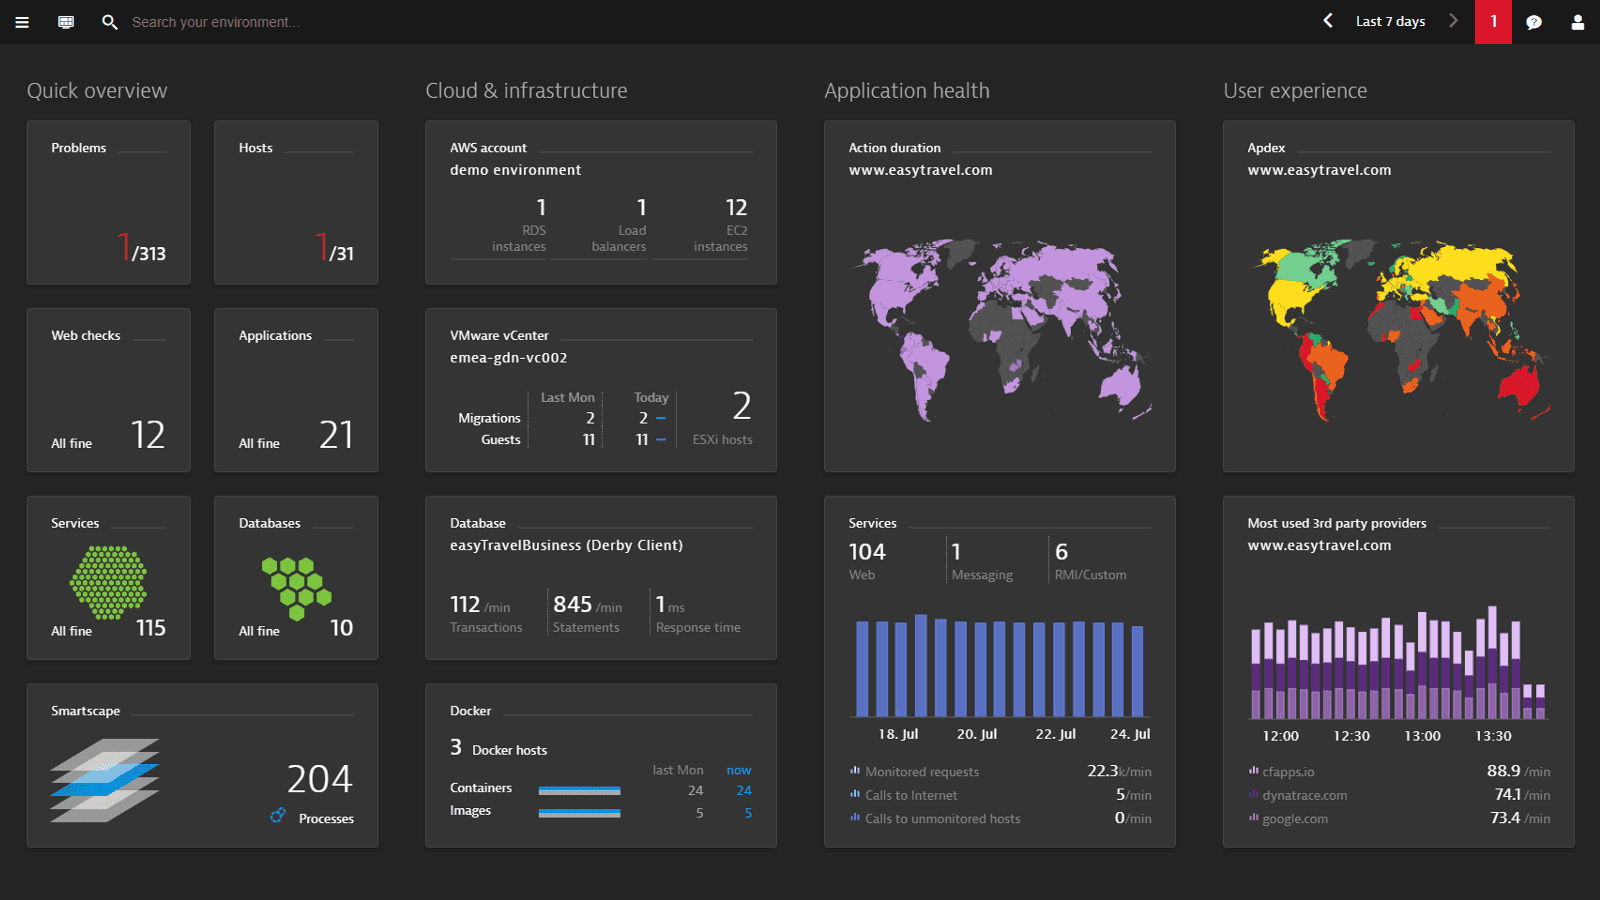
Dynatrace's Davis AI engine provides automated root cause analysis that goes beyond anomaly detection — it maps causal relationships between degraded services, infrastructure events, and user impact. For large organizations where on-call engineers diagnose production incidents at 2am, this automation has measurable value in reducing mean time to resolution.
The trade-off is cost and configuration overhead. Enterprise deals typically start around $69/host/month and often exceed $100K annually for full deployments. The proprietary OneAgent instrumentation is thorough but creates platform dependency that makes migrations expensive.
Best For: Large enterprises prioritizing automated incident response and AI-driven root cause analysis
Pricing: Custom enterprise pricing, approximately $69/host/month baseline
Open Source Platforms
Uptrace
Market Position: OpenTelemetry-native APM with ClickHouse backend, 3,000+ deployments
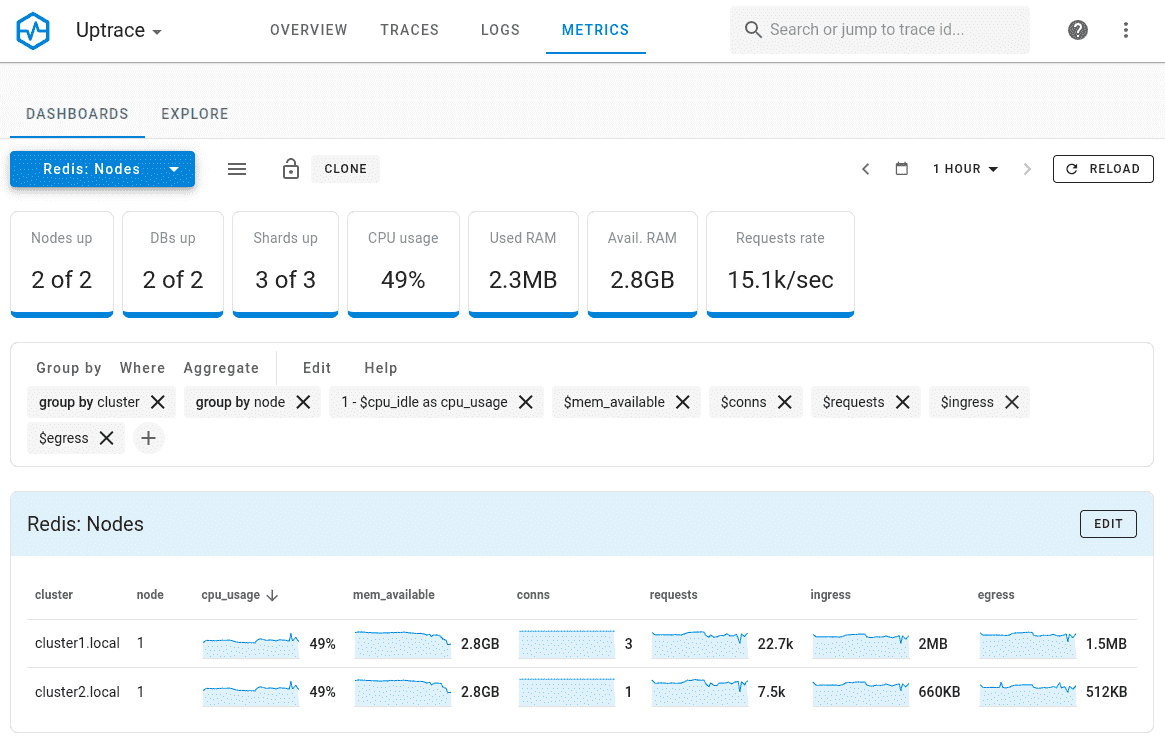
Uptrace is purpose-built for OpenTelemetry APM — it accepts data exclusively via OTLP, stores it in ClickHouse, and provides a unified view of traces, metrics, and logs without proprietary agents. Because it uses the OTel open standard throughout, there is no re-instrumentation required if you switch backends. ClickHouse enables fast queries against high-cardinality trace data at a fraction of the storage cost of traditional time-series databases, which is why Uptrace can offer competitive pricing where others cannot.
Compared to Datadog, teams running Uptrace typically report 70–90% lower costs for equivalent data volumes. The self-hosted option is fully open source; the cloud version starts at $30/month. The trade-off is a smaller ecosystem and less built-in integration coverage — but for teams already on OpenTelemetry, instrumentation portability means that gap matters less.
Best For: Cost-conscious teams using OpenTelemetry who want enterprise functionality without enterprise pricing
Pricing: Open source (self-hosted free), cloud from $30/month
Grafana (LGTM Stack)
Market Position: Leading open-source visualization and full-stack observability, 4.03% market share
Grafana has expanded from a visualization layer into a full observability stack through its LGTM components: Loki (logs), Grafana (dashboards), Tempo (distributed tracing), and Mimir (long-term metrics). Each component is open source and can be deployed independently or together. This modularity lets teams adopt pieces incrementally rather than committing to a full platform swap, and each component integrates cleanly with OpenTelemetry.
The stack requires real DevOps investment to operate at scale — capacity planning, storage tuning, and query optimization are ongoing work. Grafana Cloud simplifies operations but reintroduces cost at high data volumes, where it approaches Datadog's pricing tier.
Best For: Teams with DevOps expertise wanting maximum flexibility and open-source control over every component
Pricing: Open source free, Grafana Cloud from $49/month
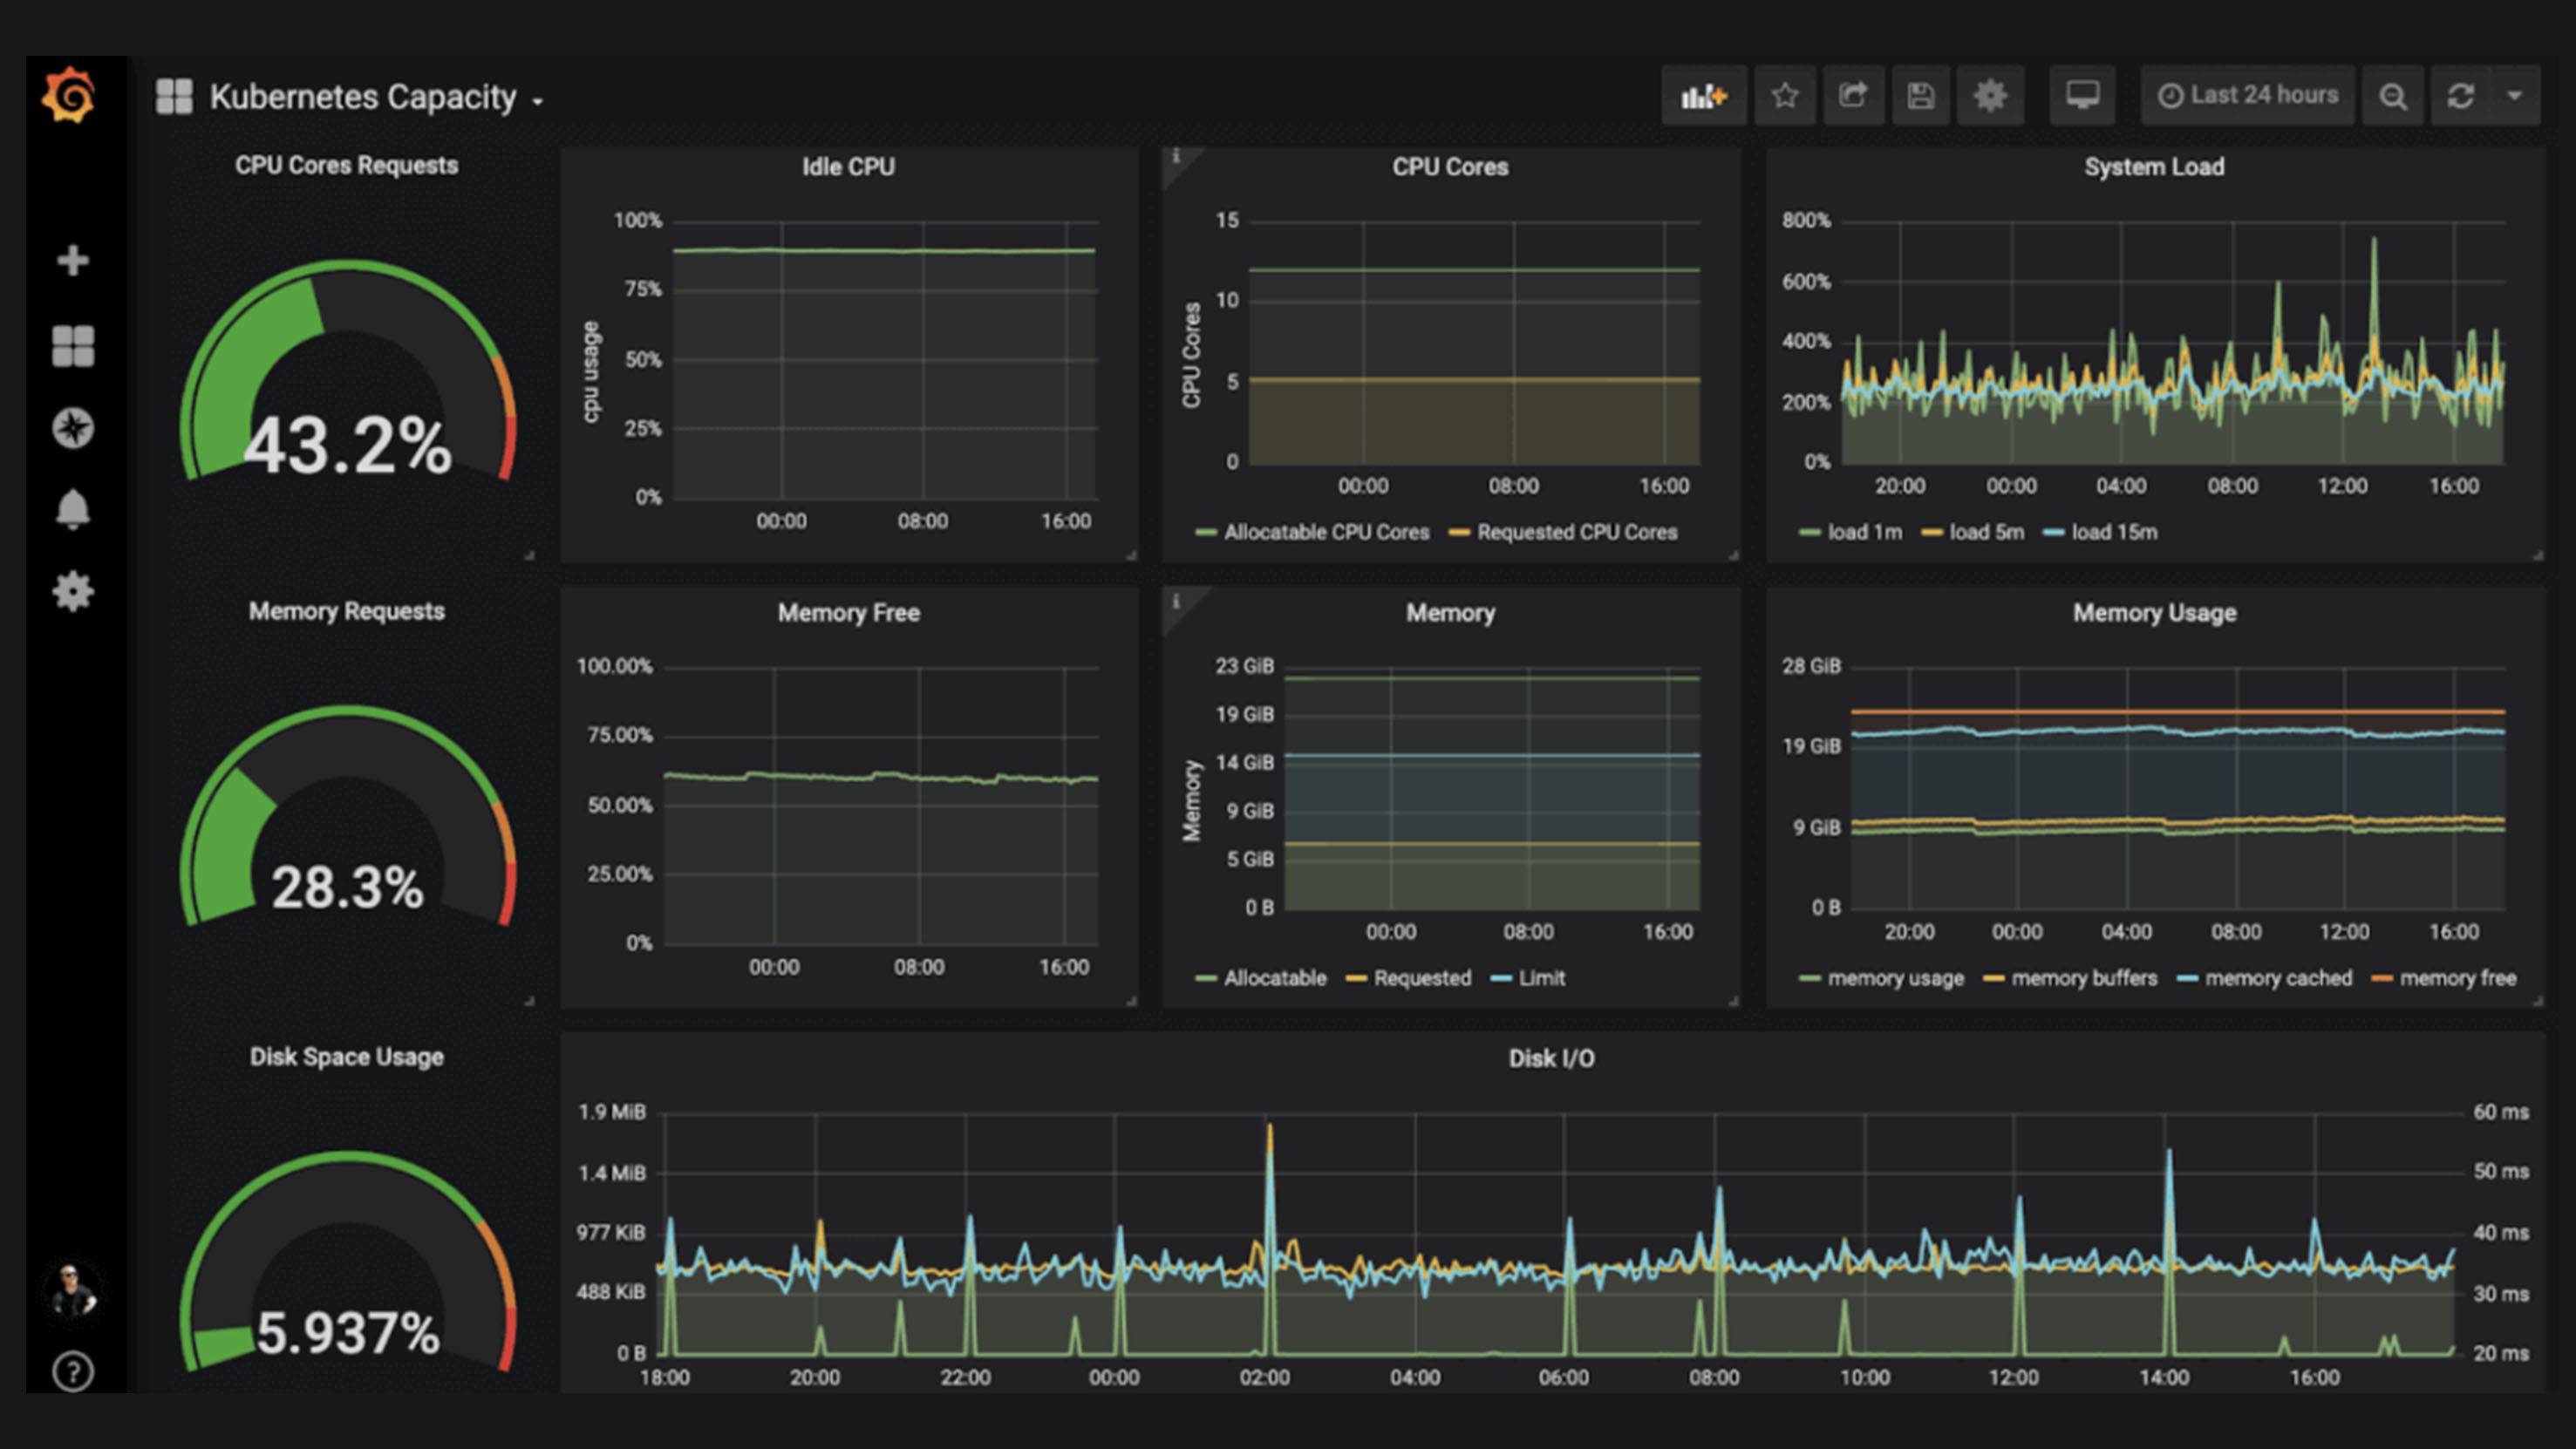
Prometheus
Market Position: Standard cloud-native metrics stack, 2.43% adoption
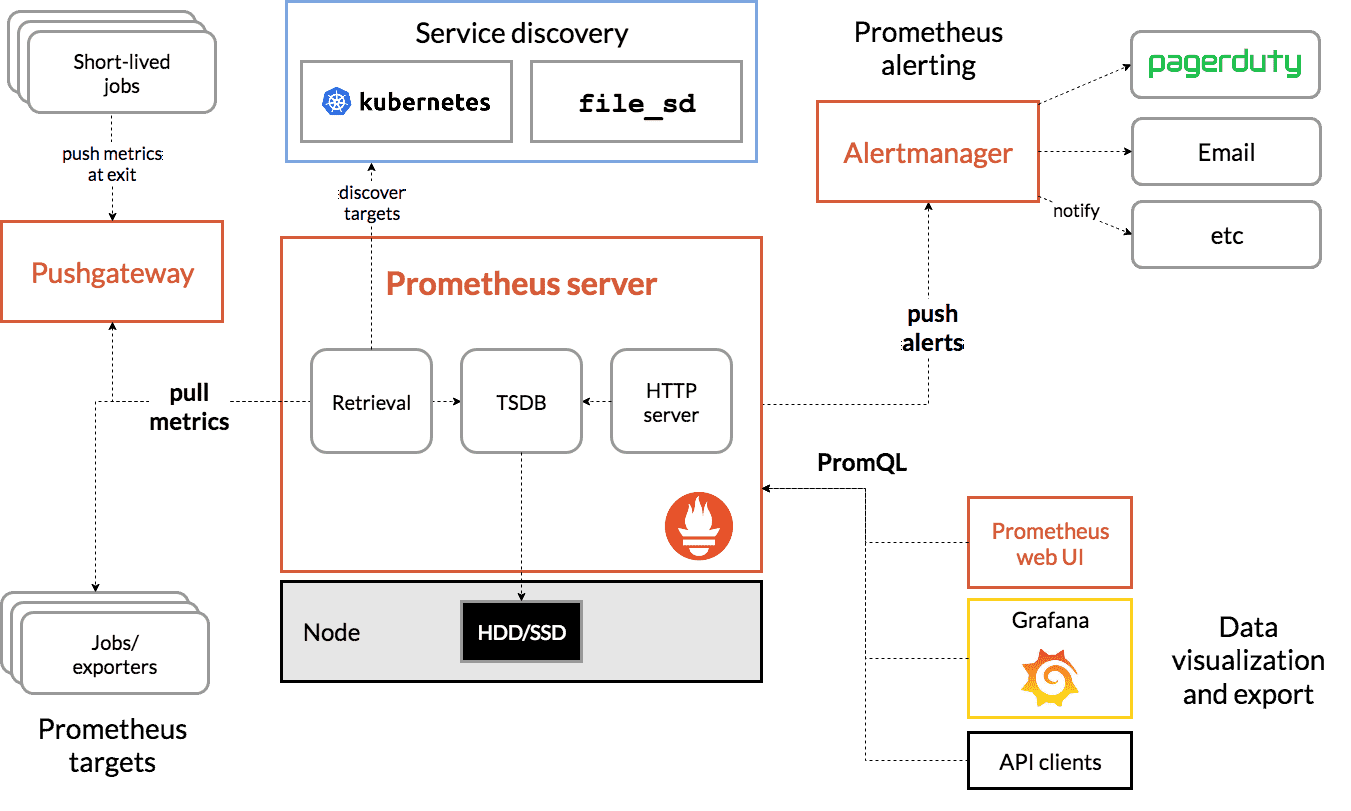
Prometheus is the de facto standard for Kubernetes metrics collection. Its pull-based model, PromQL query language, and deep integration with the CNCF ecosystem (Kubernetes, Alertmanager, Grafana) make it the baseline for cloud-native monitoring. Most engineering teams running containers have Prometheus deployed even if they also use a commercial platform on top.
Prometheus handles metrics well but has known limits: no native log management, limited distributed tracing support, and cardinality challenges at high scale. Teams needing traces typically pair it with Jaeger or Grafana Tempo, and logs with Loki.
Best For: Cloud-native teams needing standard Kubernetes metrics collection and alerting
Pricing: Free (infrastructure costs apply)
Specialized Solutions
Elastic Observability
Market Position: Strong in log-heavy environments, leverages the Elasticsearch ecosystem
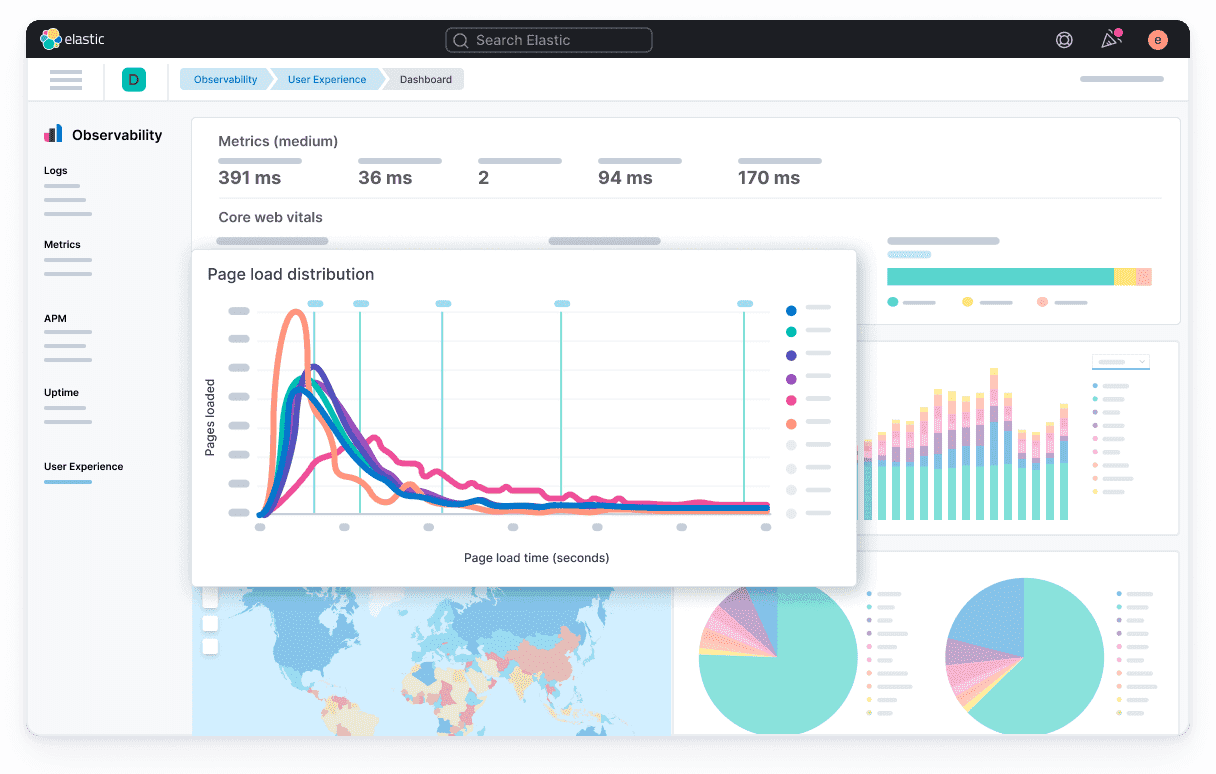
Elastic Observability extends the Elasticsearch stack with APM, distributed tracing, and infrastructure monitoring. For organizations already running Elastic for search or security, adding observability avoids introducing another vendor relationship. The log analysis capabilities are particularly strong — Elasticsearch's query performance and full-text search capabilities are hard to match for large, unstructured log volumes.
The operational cost of running Elasticsearch clusters at observability scale is significant. Storage grows quickly with indexed log data, and tuning cluster performance requires ongoing expertise that not all teams have in-house.
Best For: Organizations with heavy logging requirements or existing Elastic Stack investments
Pricing: Open source available, cloud from $95/month
Splunk Observability
Market Position: Strong in security and compliance, 63.56% SIEM market share
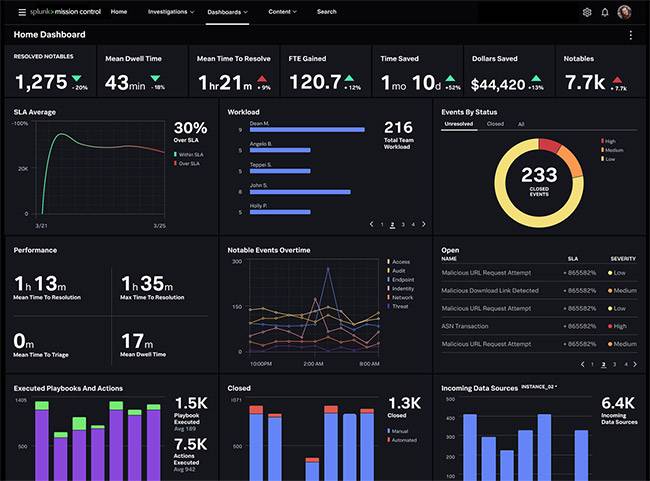
Splunk's observability offering is strongest when it is part of a broader Splunk deployment covering security (SIEM) and IT operations. Its NoSample technology captures 100% of traces rather than sampling, which matters for organizations that need complete audit trails or are tracking low-frequency, high-impact events.
Pricing is the main barrier — Splunk operates on custom enterprise contracts, and the licensing structure has historically been complex. For teams not already invested in the Splunk ecosystem, the entry cost is difficult to justify against alternatives.
Best For: Security-focused organizations or those with existing Splunk SIEM investments
Pricing: Custom enterprise pricing
Jaeger
Market Position: Leading open-source distributed tracing solution, CNCF graduated project
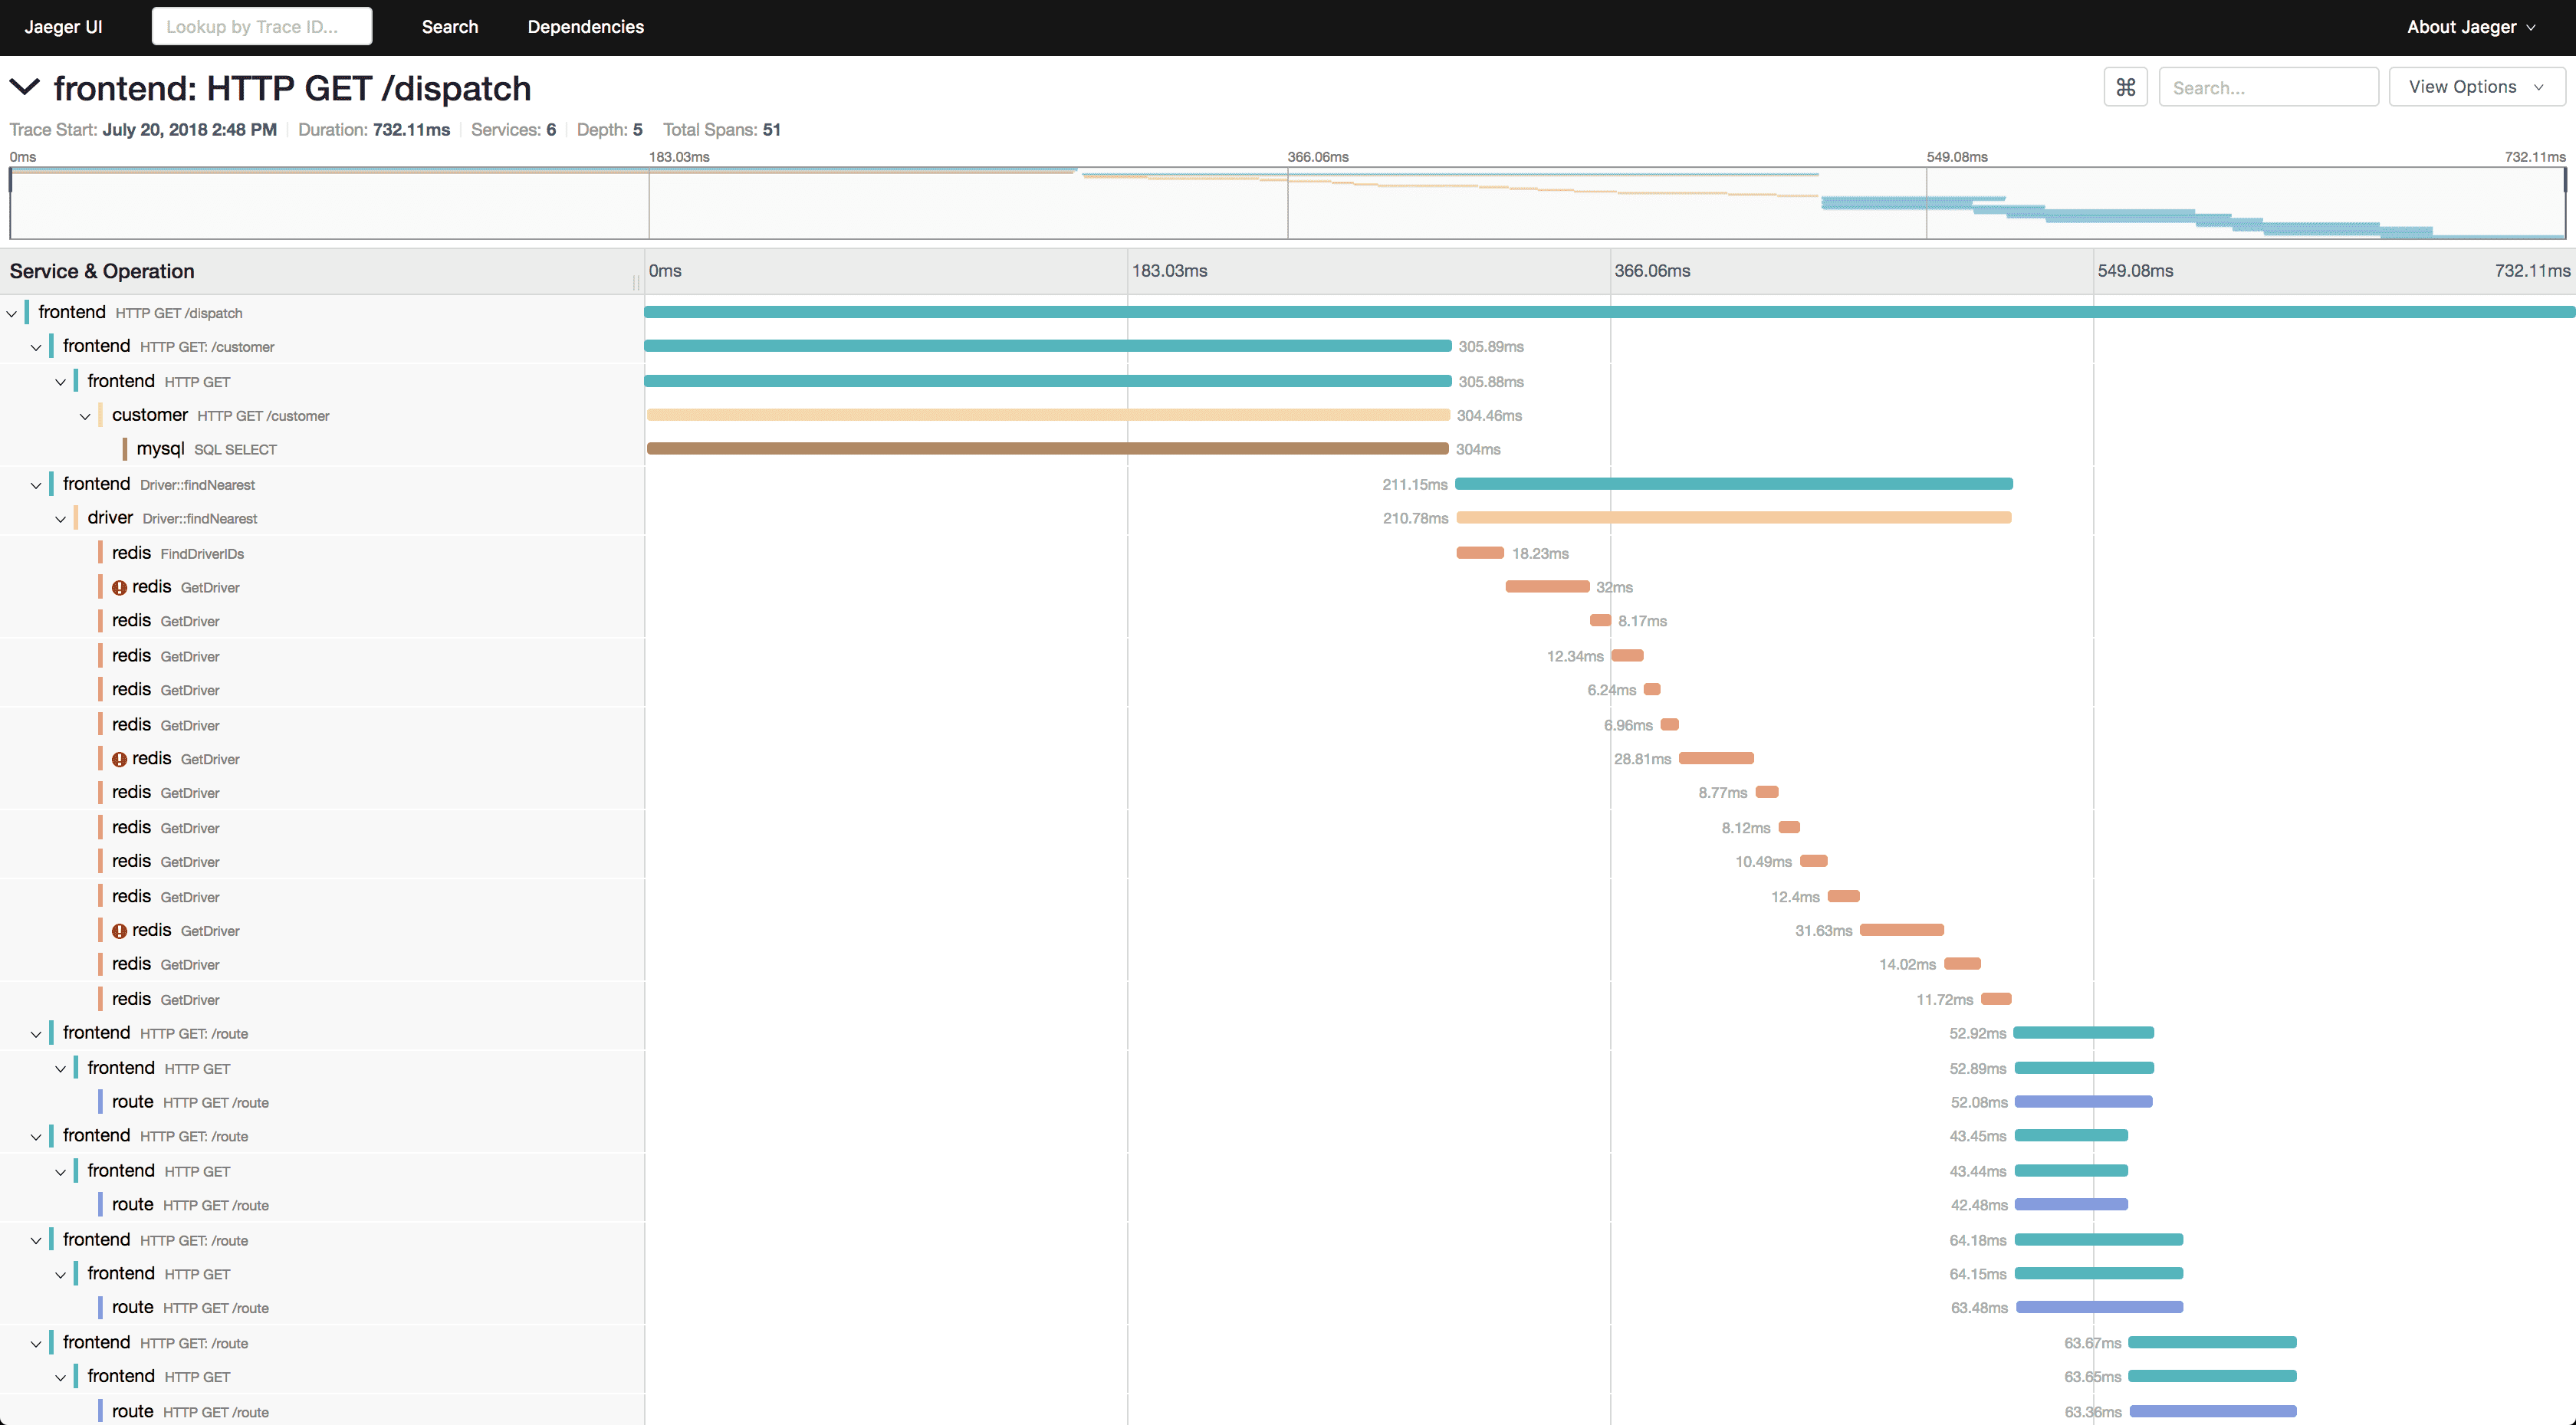
Jaeger was donated to CNCF by Uber and has become the reference implementation for distributed tracing in cloud-native environments. It integrates natively with OpenTelemetry, supports multiple storage backends (Cassandra, Elasticsearch, ClickHouse), and is widely deployed as the tracing component in self-managed observability stacks.
Jaeger is purpose-built for tracing only — it does not collect metrics or logs. Teams needing full observability typically run Jaeger alongside Prometheus (metrics) and a separate log aggregation solution, which adds operational complexity.
Best For: Teams needing a dedicated, battle-tested open-source distributed tracing backend
Pricing: Open source, free to use
Better Stack
Market Position: Log management and uptime monitoring with ClickHouse backend, fast-growing
Better Stack combines log management, uptime monitoring, and incident management in a single platform. Its log storage is built on ClickHouse — the same columnar database Uptrace uses — which enables fast aggregations across billions of log lines without the query degradation that affects Elasticsearch-based systems at high cardinality.
The platform is positioned as a cost-effective alternative for teams primarily concerned with logs and uptime visibility rather than deep distributed tracing. Setup time is low compared to running a self-managed ELK stack, and the pricing is predictable, with a free tier that covers small teams.
Best For: Teams wanting fast log search and uptime monitoring without infrastructure overhead
Pricing: Free tier available, paid plans from $24/month
How to Choose the Right Observability Tool
By Company Size
Startups/Small Teams (< 50 people):
- Uptrace: Best value with enterprise features, OTel-native from day one
- New Relic: Generous free tier for early stages
- Grafana + Prometheus: If you have DevOps expertise in-house
Mid-Market (50–500 people):
- New Relic: Balanced features and predictable pricing
- Datadog: If budget allows and you need breadth
- Uptrace: Cost-effective as you scale
Enterprise (500+ people):
- Datadog: Market leader with full feature set
- Dynatrace: AI-powered automation for large, complex environments
- Splunk: Security and compliance-first organizations
By Use Case
Cloud-Native/Kubernetes:
- Prometheus + Grafana (community standard)
- Uptrace (modern OTel-native alternative)
- Datadog (comprehensive, managed)
Microservices Debugging:
- Jaeger (open-source distributed tracing)
- Uptrace (unified traces, metrics, logs)
- Datadog (full APM with dependency maps)
Cost Optimization:
- Uptrace (transparent, flat-rate pricing)
- Grafana stack (open source)
- Better Stack (logs + uptime at low cost)
Enterprise Compliance:
- Dynatrace (automated compliance)
- Splunk (security-first)
- Datadog (comprehensive auditing)
Quick Decision Guide
Choose Datadog if: Budget isn't a primary concern and you need the broadest integration coverage and enterprise support
Choose New Relic if: You want balanced features with usage-based pricing and a generous free tier
Choose Uptrace if: You're on OpenTelemetry and cost matters, but you don't want to sacrifice functionality
Choose Grafana stack if: You have a strong DevOps team and want full open-source control over every component
Choose Dynatrace if: You're running a large enterprise environment and prioritize AI-driven automation
Choose Better Stack if: You primarily need fast log search and uptime monitoring at a predictable cost
Conclusion
The observability landscape in 2026 is more competitive than it was two years ago, largely because OpenTelemetry has neutralized instrumentation lock-in as a differentiator. Teams that adopt OTel-native instrumentation now can switch backends without rework, which changes the calculus for platform selection. Cost structure and query performance on high-cardinality data — areas where ClickHouse-backed platforms like Uptrace and Better Stack have an advantage — are increasingly the deciding factors at scale.
Datadog's comprehensive coverage and ecosystem remain unmatched for large enterprises with complex requirements. For teams watching costs or building on open standards, the gap between commercial and open-source platforms has narrowed considerably.
Test before committing. Most platforms offer free trials or generous free tiers, and real-world query performance on your actual data volumes will tell you more than any benchmark.
FAQ
What's the difference between observability and monitoring? Monitoring tells you when something breaks using predefined metrics. Observability helps you understand why it broke by providing deep insights into system behavior and performance patterns.
How much should I budget for observability tools? Small teams: $500–2,000/month. Mid-market: $2,000–15,000/month. Enterprise: $15,000–100,000+/month. Costs vary significantly based on data volume and feature requirements.
Can I use multiple observability tools together? Yes, many organizations use specialized tools for different purposes. However, unified platforms often provide better correlation and reduced complexity.
Which observability tool is best for startups? Uptrace offers the best value with enterprise features at startup pricing. New Relic provides an excellent free tier. Both are more cost-effective than Datadog for smaller teams.
Do I need observability if I have APM tools? APM focuses on application performance while observability provides broader system insights including infrastructure, business metrics, and cross-service dependencies. For complex systems, both complement each other.
How do I calculate ROI for observability tools? Measure reduced mean time to resolution (MTTR), decreased incident frequency, improved system performance, and developer productivity gains. Most teams see positive ROI within 3–12 months.
You may also be interested in: