Top 11 Grafana Alternatives [comparison 2025]
Grafana is a widely used open-source platform for monitoring and visualization. Grafana has a lot of built-in functionality and also provides a large amount of community templates that can improve your overall experience.
However, Grafana requires quite a lot of configuration and the documentation can be a bit overwhelming for beginners. In this article, we explore seven alternatives that can be simpler to use and can provide seamless integration of traces, logs, and metrics.
Grafana pros
Grafana is an open source analytics and visualization platform that works with many popular databases. It is a powerful and feature-rich tool for creating, exploring, and sharing dashboards with your team.
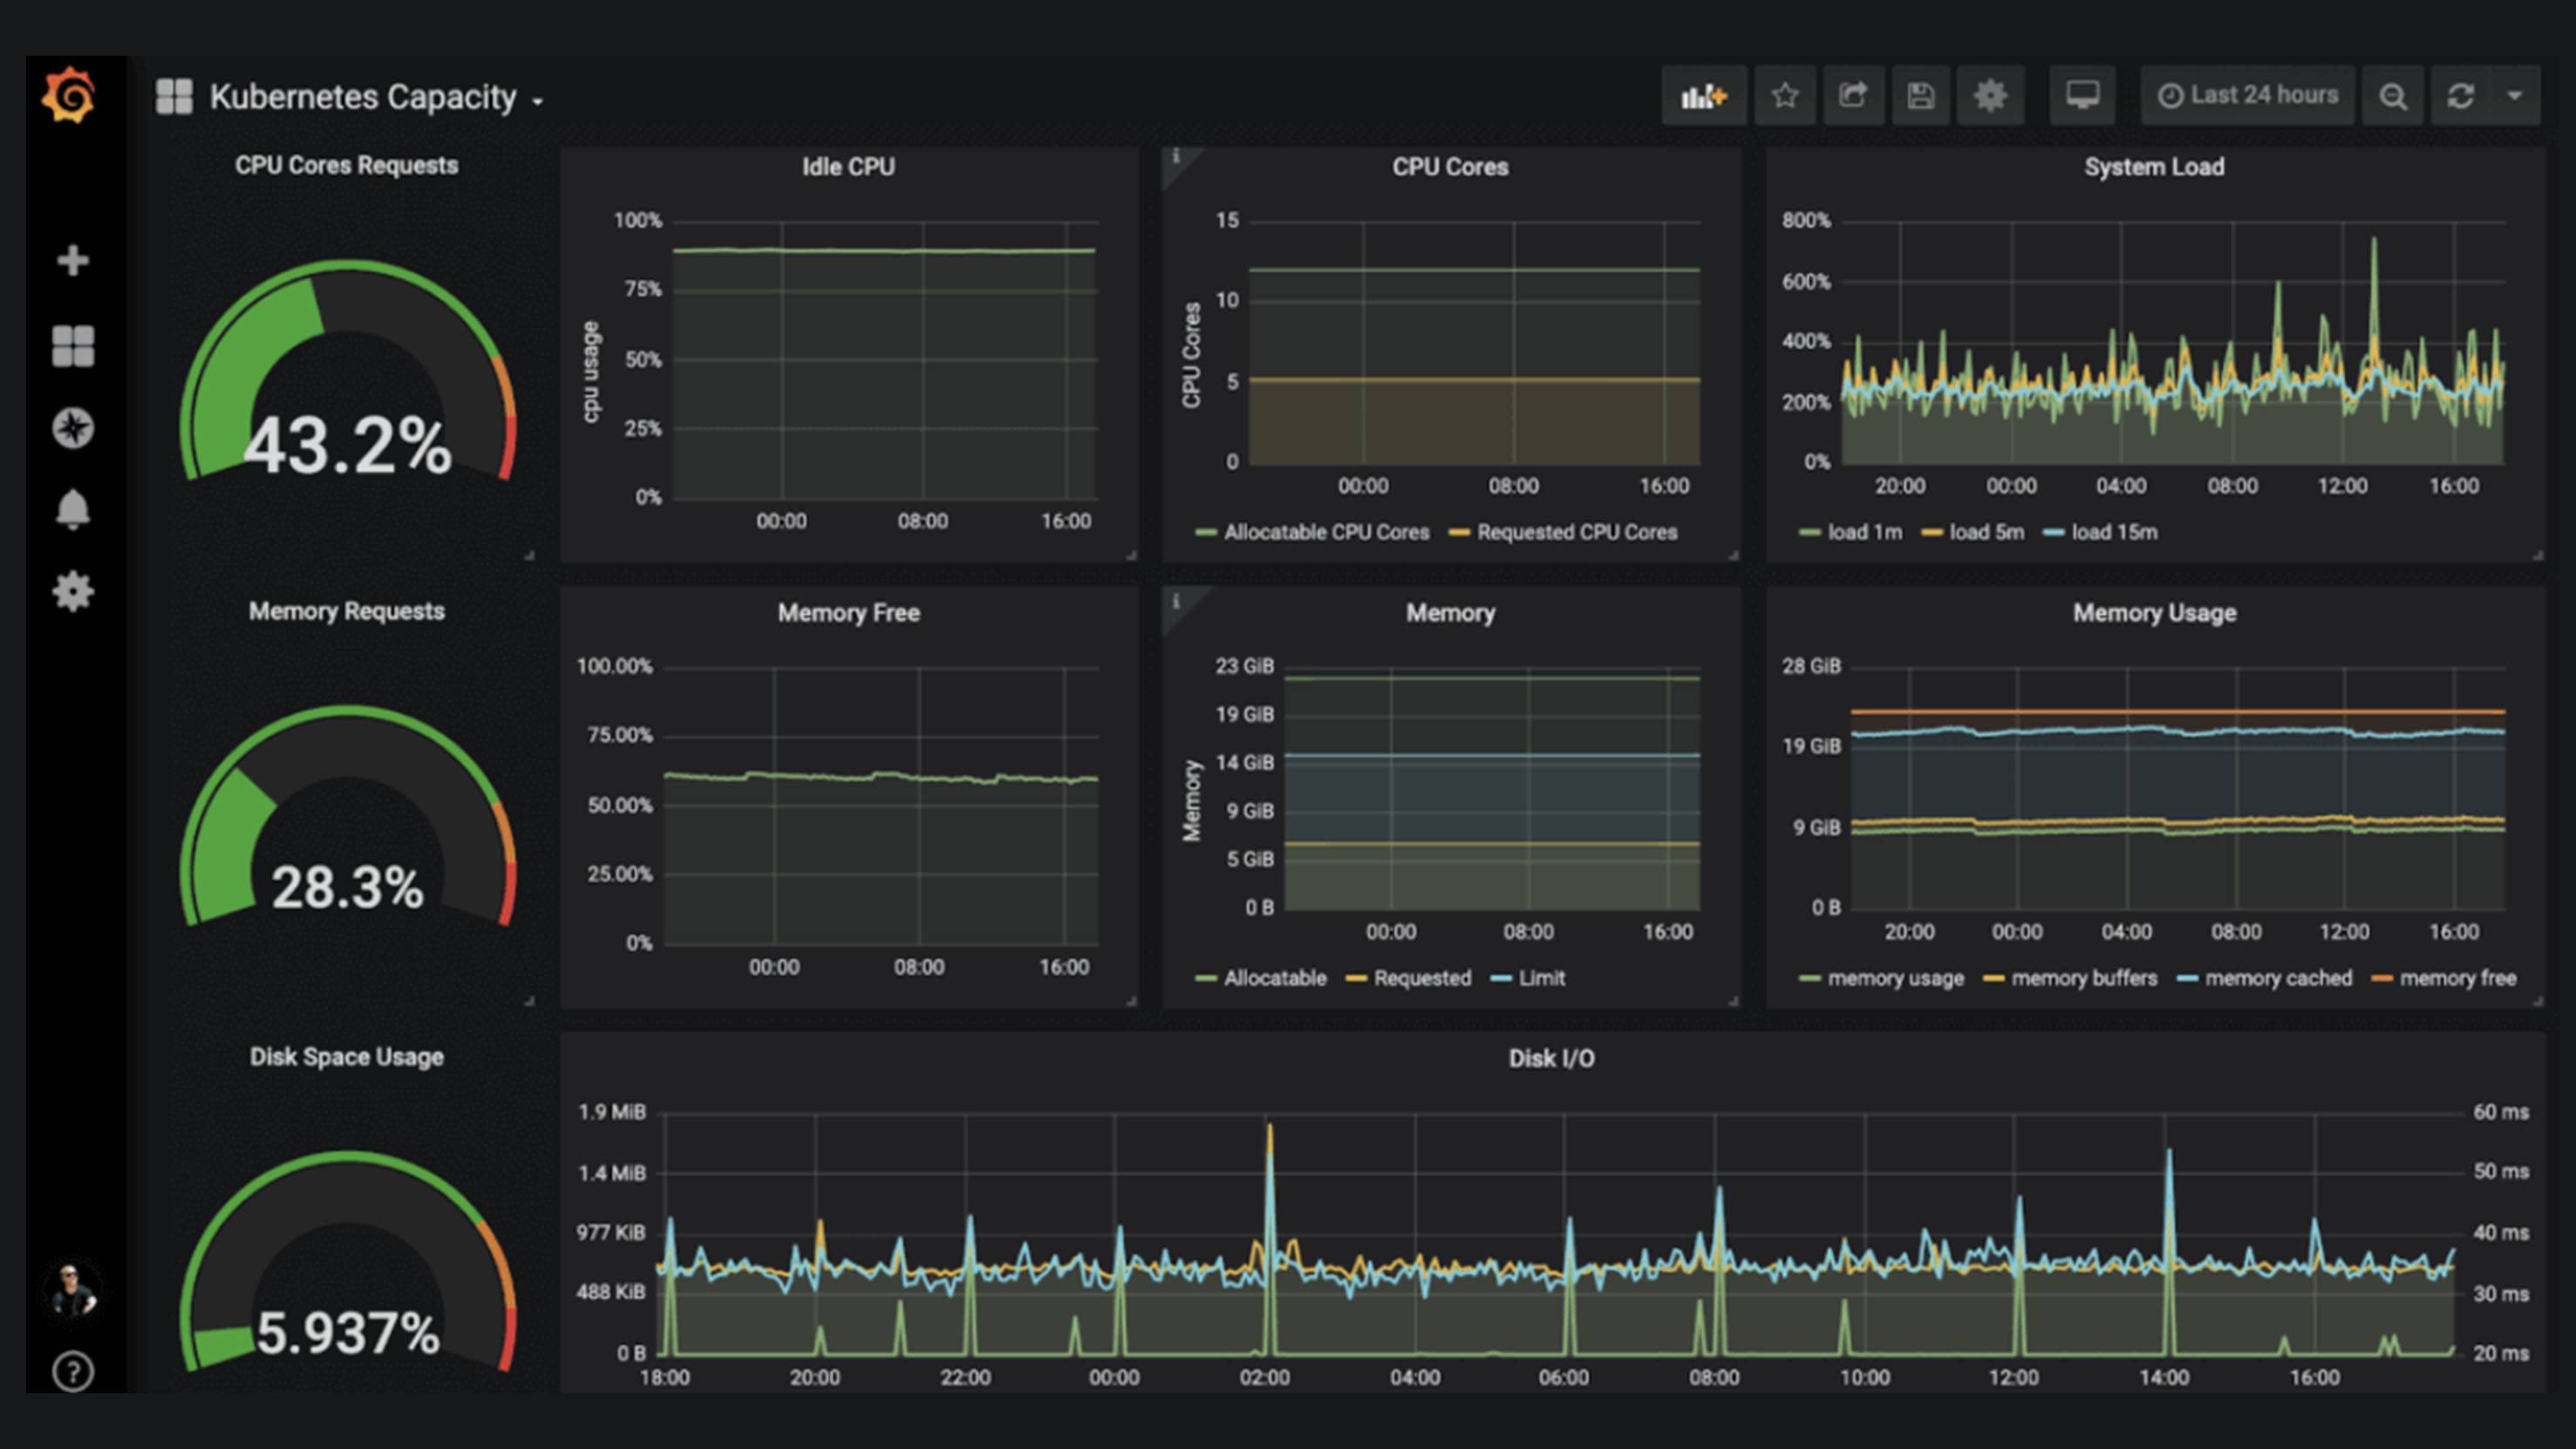
Grafana is commonly used by startups as a quick way to get started with infrastructure and application monitoring. It provides pluggable panels and data sources allowing to easily customize dashboards for your needs.
Grafana allows to visualize metrics, logs, and traces from multiple sources like Prometheus, Loki, Elasticsearch, InfluxDB, Postgres and many more.
You can also create dynamic and reusable dashboards with template variables that appear as dropdowns at the top of the dashboard.
In summary, Grafana is a powerful and flexible platform for data visualization and monitoring, designed to help teams understand and analyze large amounts of time series data. With its ability to collect data from a variety of sources and its rich set of visualization and alerting features, Grafana has become a popular tool for many organizations.
Grafana cons
Here are some of the cons or limitations of Grafana:
- Complexity. Grafana has a lot of features and options that can make it difficult to use for beginners or those who don't have technical expertise.
- Resource-intensive. Grafana can be resource-intensive and may require powerful hardware to run smoothly, especially when working with large amounts of data.
- Limited alerting capabilities. Although Grafana does have alerting capabilities, it may not be as flexible or comprehensive as other dedicated alerting tools.
- Dependence on external data sources. Grafana is highly dependent on external data sources to display information, and may require additional setup and configuration to integrate with these sources.
Grafana alternatives
Uptrace
Uptrace allows to build custom dashboards to monitor health and performance of your hosts, containers, services, dababase servers, and more. In seconds, you get actionable insights backed by the combined power of traces, logs, and metrics.
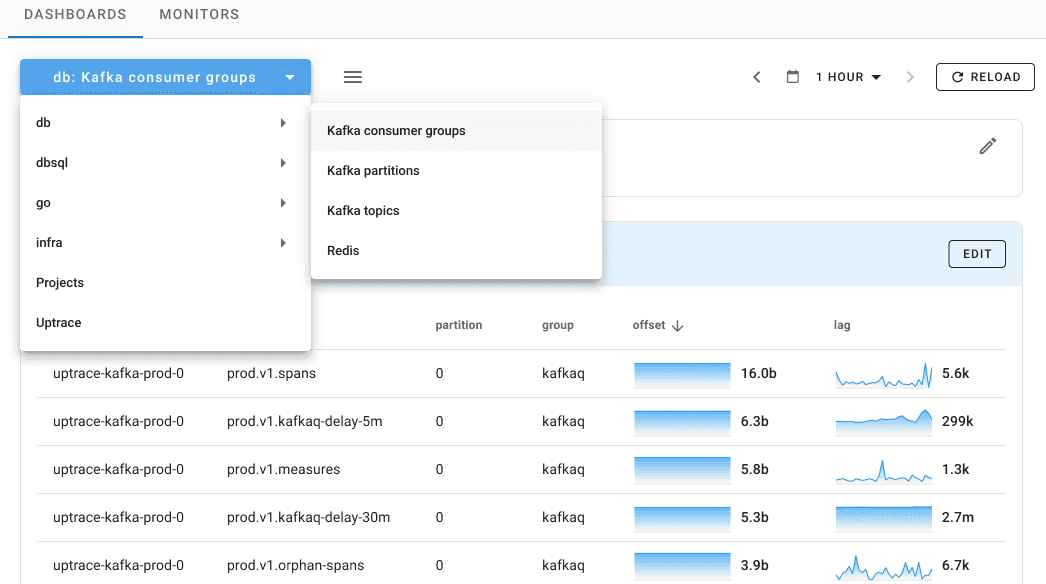
You can just start sending data and Uptrace will automatically create detailed dashboards for the most popular applications such as PostgreSQL, MySQL, Redis, Nginx, Kafka etc.
Like Grafana, Uptrace allows to create dynamic parameterized dashboards that appear as filters at the top of the dashboard.
You can enhance dashboards with monitors that will raise an alarm whenever there is an increase in CPU, memory, disk consumption, or any other metric.
Pros
- Public playground to play with the product.
- Clean and simple interface.
- Full stack monitoring.
- Ability to analyze and search logs.
DataDog
DataDog and Grafana are both popular monitoring tools that help organizations monitor the performance of their applications and infrastructure.
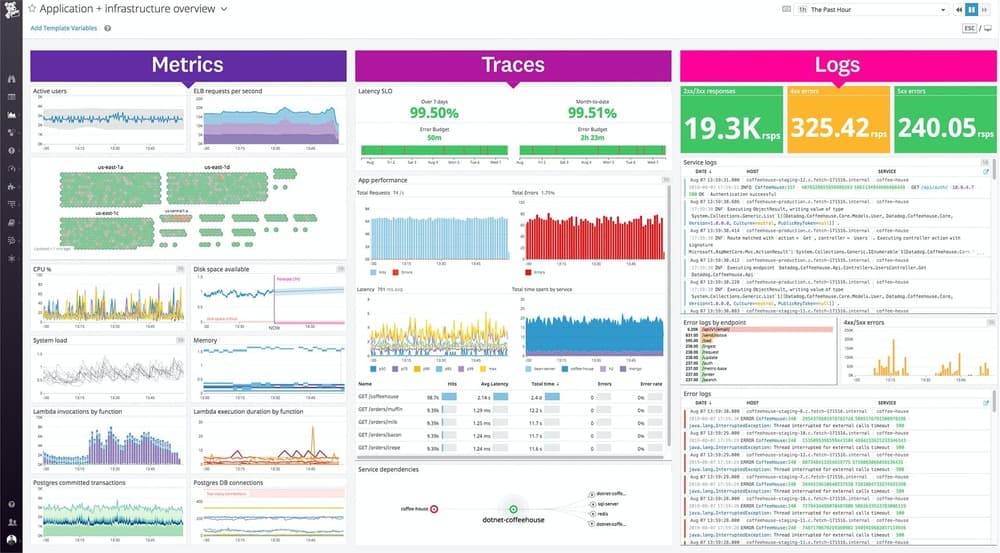
Datadog is a cloud-based monitoring and analytics platform that provides a comprehensive solution for monitoring your applications, infrastructure, and network. It integrates multiple data sources, including logs, metrics, traces, and synthetic monitoring, and provides a centralized view of all the data.
DataDog also provides alerts, dashboards, and machine learning-based anomaly detection, making it well-suited for monitoring dynamic and large environments.
In summary, Datadog provides a comprehensive monitoring and analytics platform that integrates multiple data sources, while Grafana provides data visualization and dashboarding capabilities.
NewRelic
NewRelic is a comprehensive solution that provides real-time monitoring and analysis of applications and their underlying infrastructure.
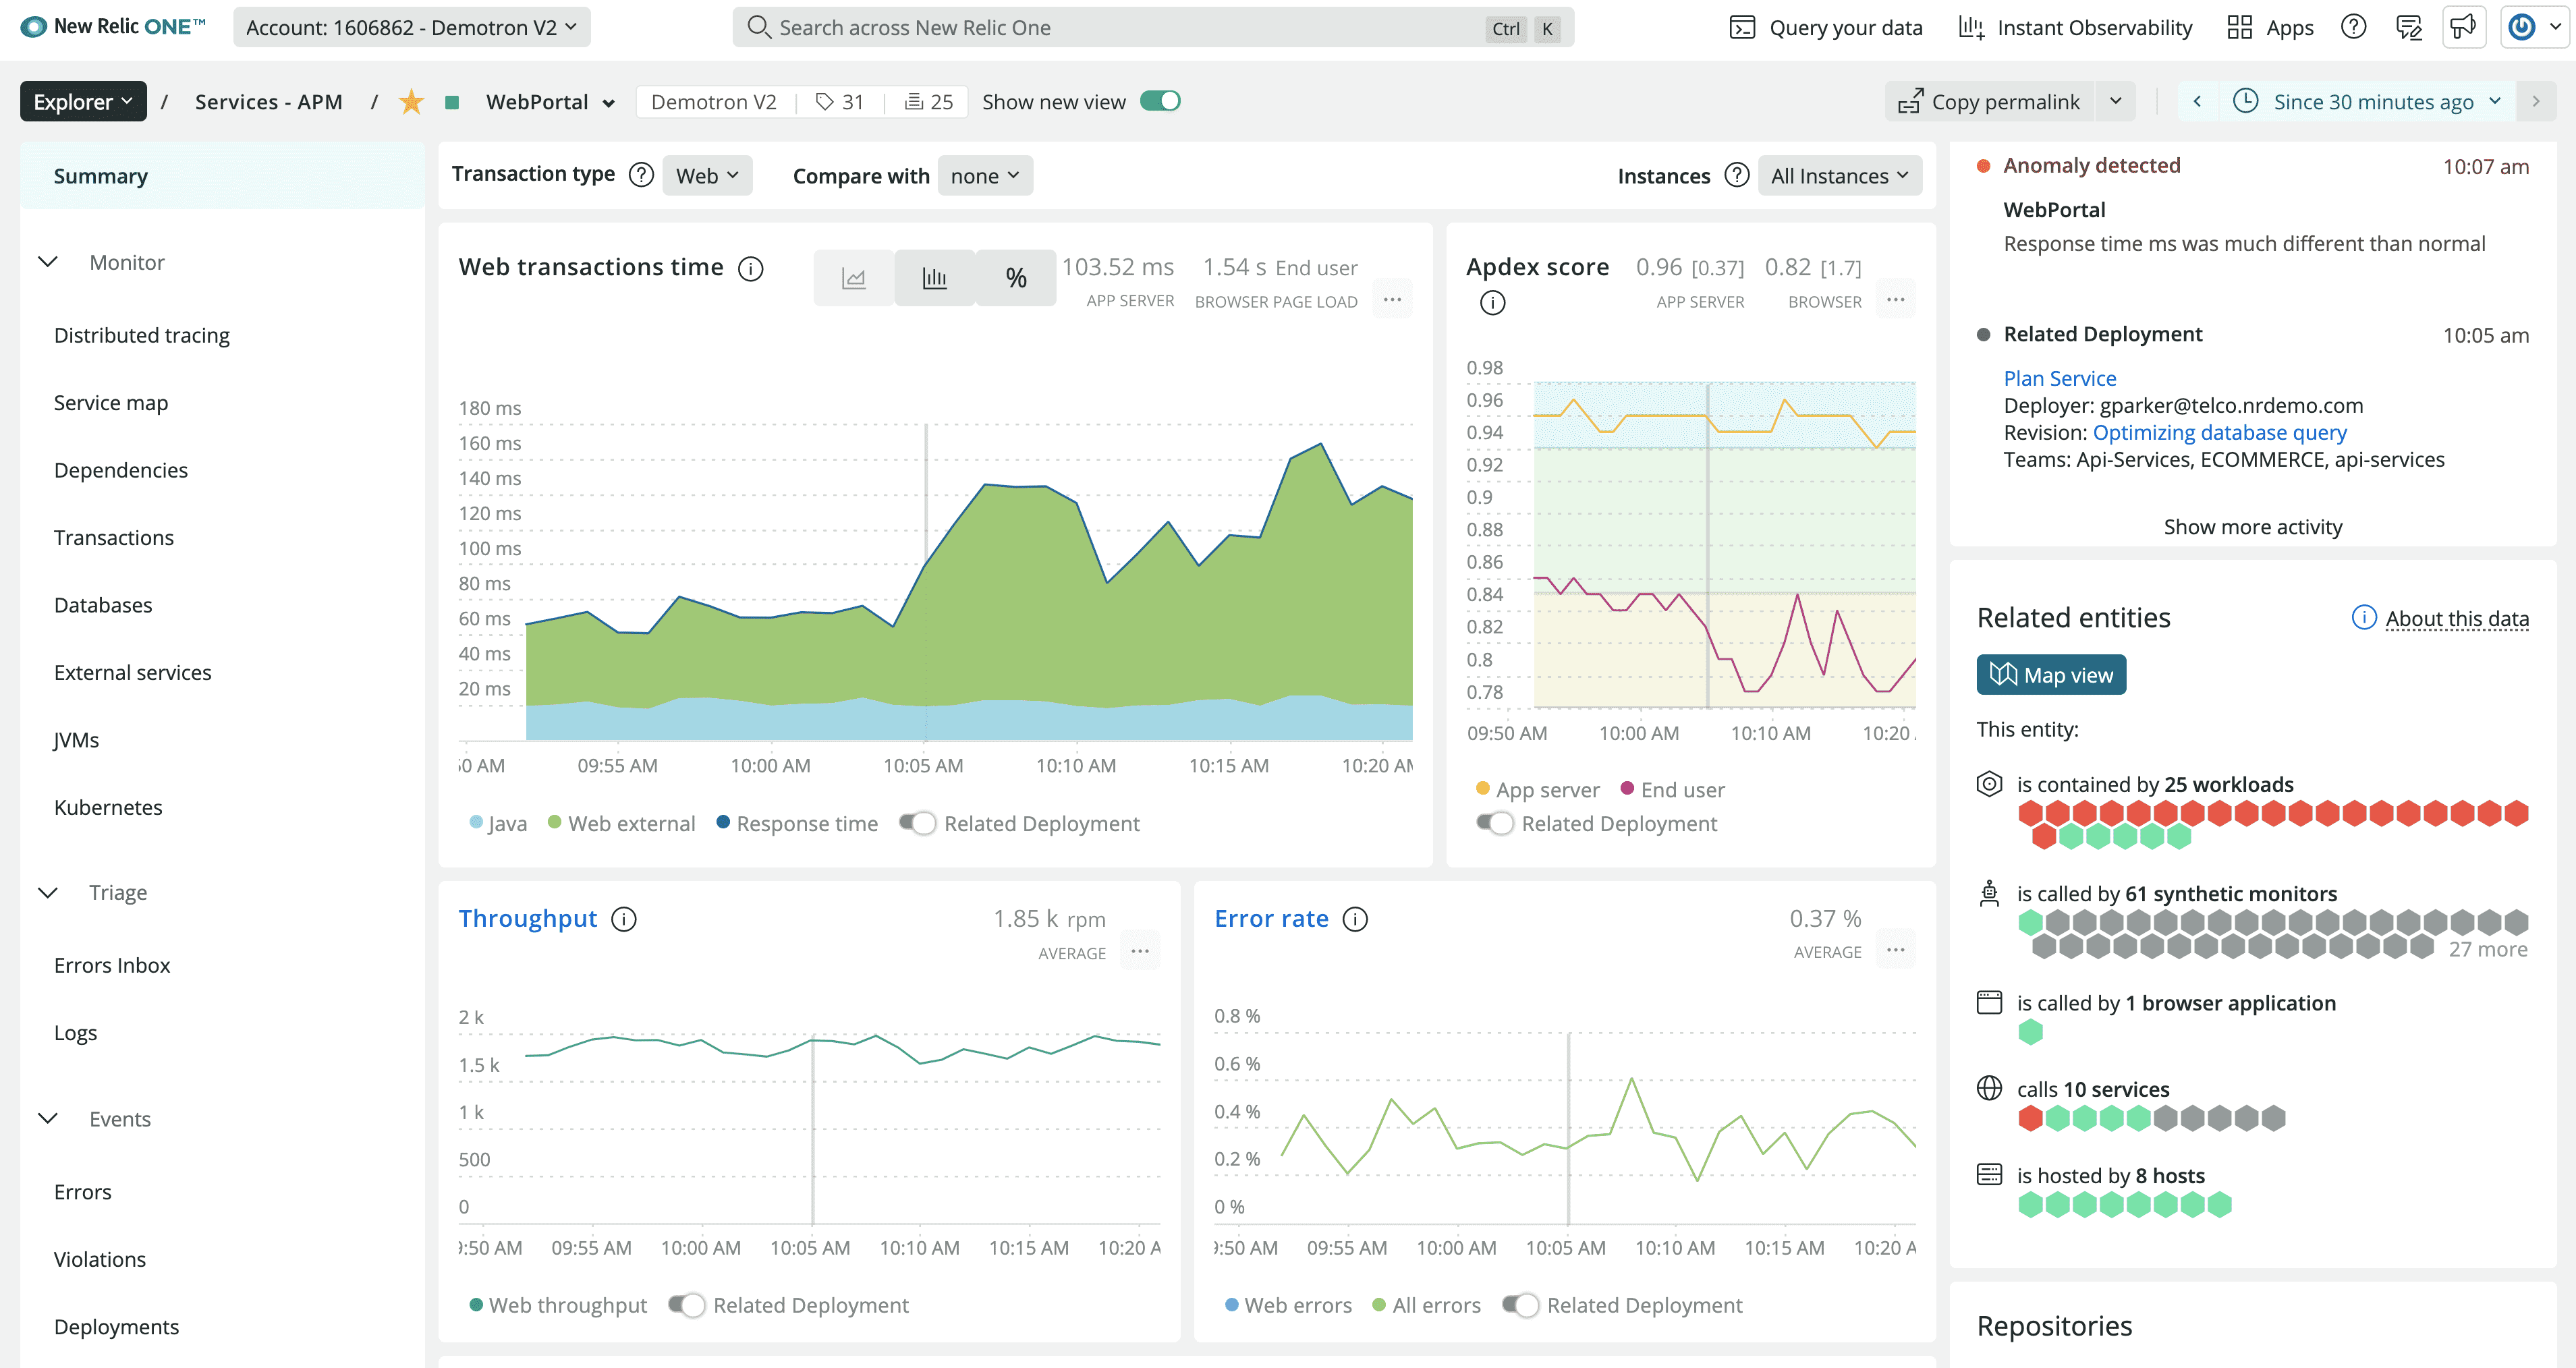
NewRelic provides detailed insights into the performance of applications, including request tracing, error tracking, and transaction monitoring.
NewRelic also provides features such as alerts, custom dashboards, and historical performance analysis.
In summary, New Relic provides a more comprehensive solution for application performance monitoring, while Grafana is more focused on real-time data visualization and alerting for a variety of data sources.
Top 5 New Relic Competitors & Alternatives in 2025 Including Open-Source
Instana
Instana is an AI-powered application performance management (APM) solution that automatically discovers, maps, and monitors the components of your applications, their dependencies, and the infrastructure they run on.
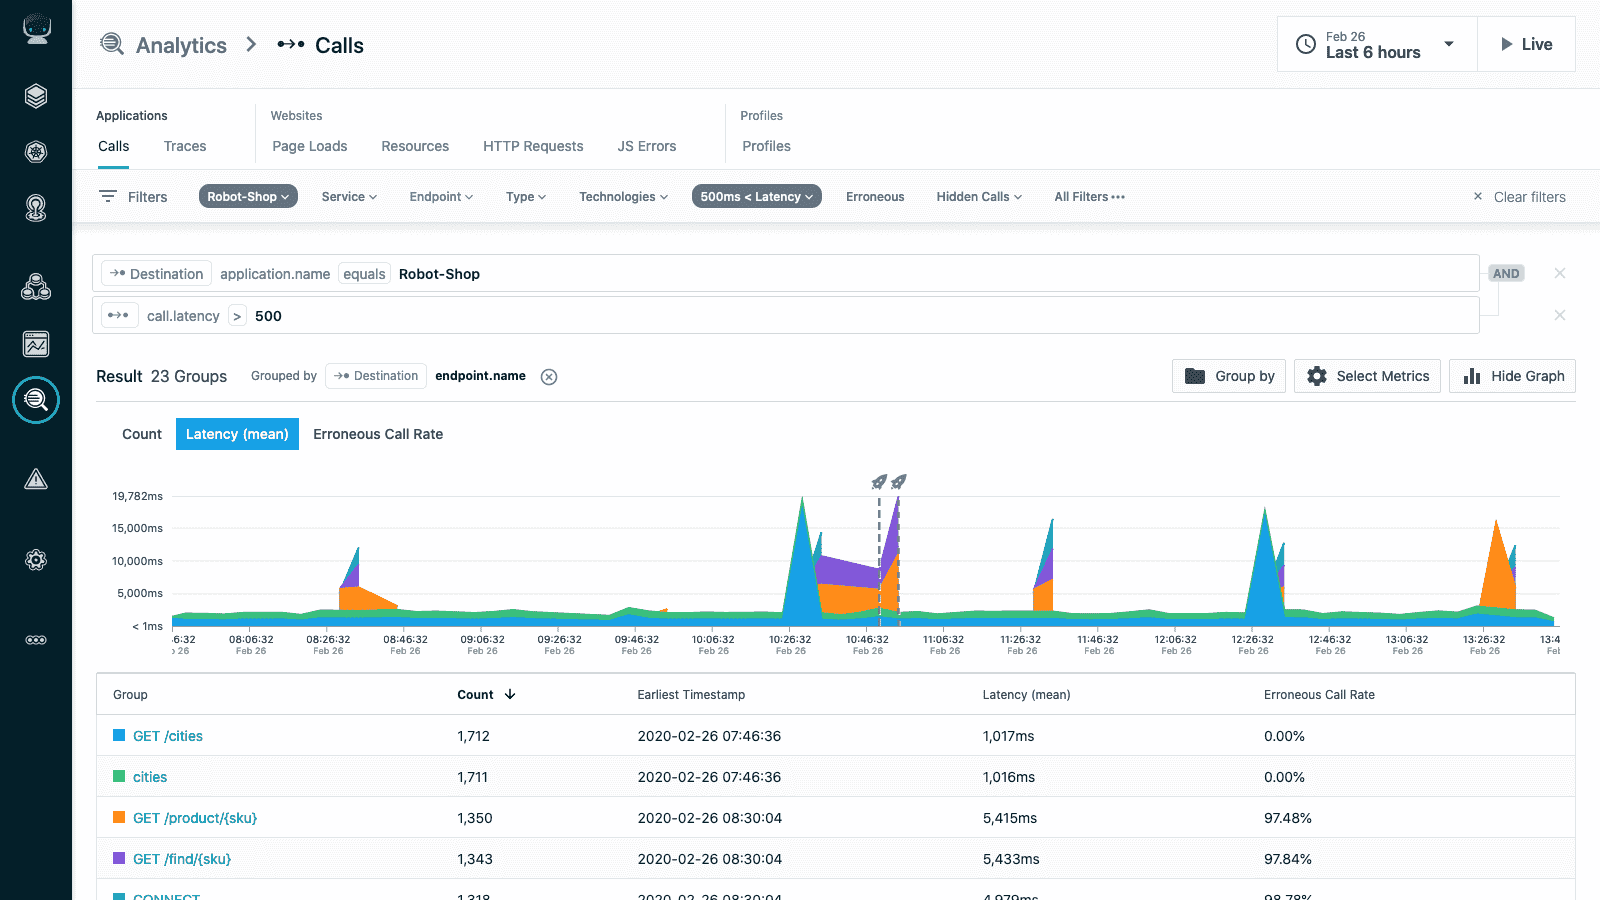
Instana provides a complete view of your application's performance, including transaction traces, code-level visibility, and metrics from various sources, including your infrastructure, application servers, databases, and cloud services.
Instana also provides real-time alerting and anomaly detection, powered by its AI engine, which can help you quickly identify and resolve performance issues.
In summary, Instana provides a more comprehensive solution for APM, while Grafana is more focused on data visualization and analysis. If you're looking for a tool that provides a complete view of your application performance, including real-time alerting and anomaly detection, then Instana may be a better choice. If you're looking for a flexible and customizable dashboard and visualization tool, then Grafana may be the better choice.
Kibana
Kibana is an open user interface that lets you visualize your Elasticsearch data and navigate the Elastic Stack.
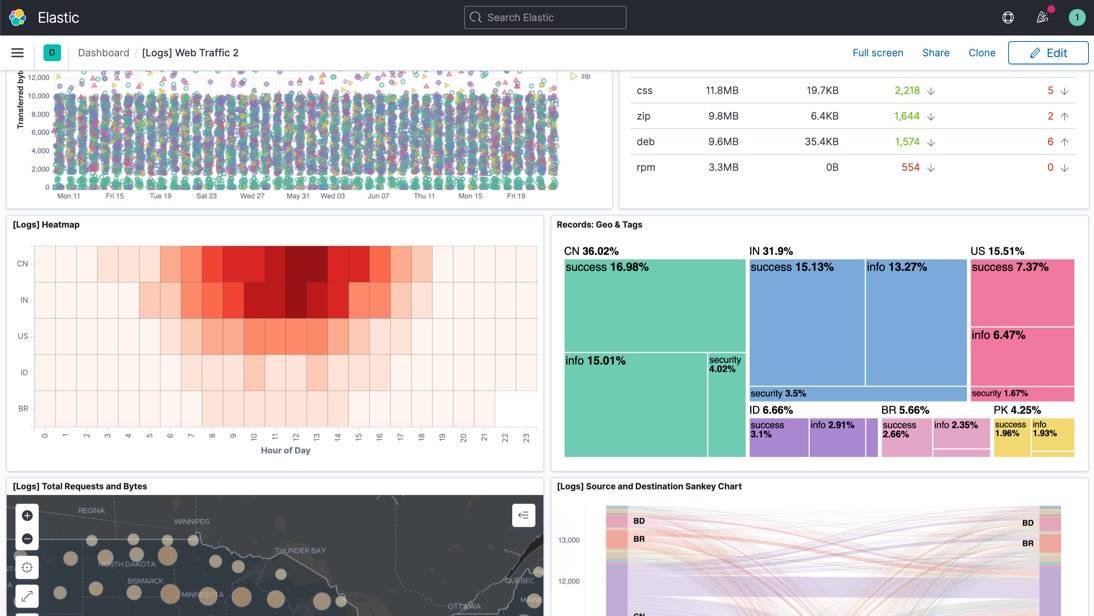
Kibana is written in the JavaScript language which makes it an excellent choice for developers and non-developers alike.
Kibana allows you to search Elasticsearch data for specific events and visualize them using charts, tables, geographical maps, and more.
Just like Grafana, Kibana allows to create dashboards that can be customized for any purposes. It provides anomaly detection and alerting to monitor your applications.
Pros
- Full stack monitoring.
- Ability to analyze and search logs.
Cons
- Low number of dashboards.
- Must be used with other products from ELK stack.
Cyclotron
Cyclotron is a browser-based platform for creating dashboards. It allows you to query and visualize your metrics no matter where they are stored.
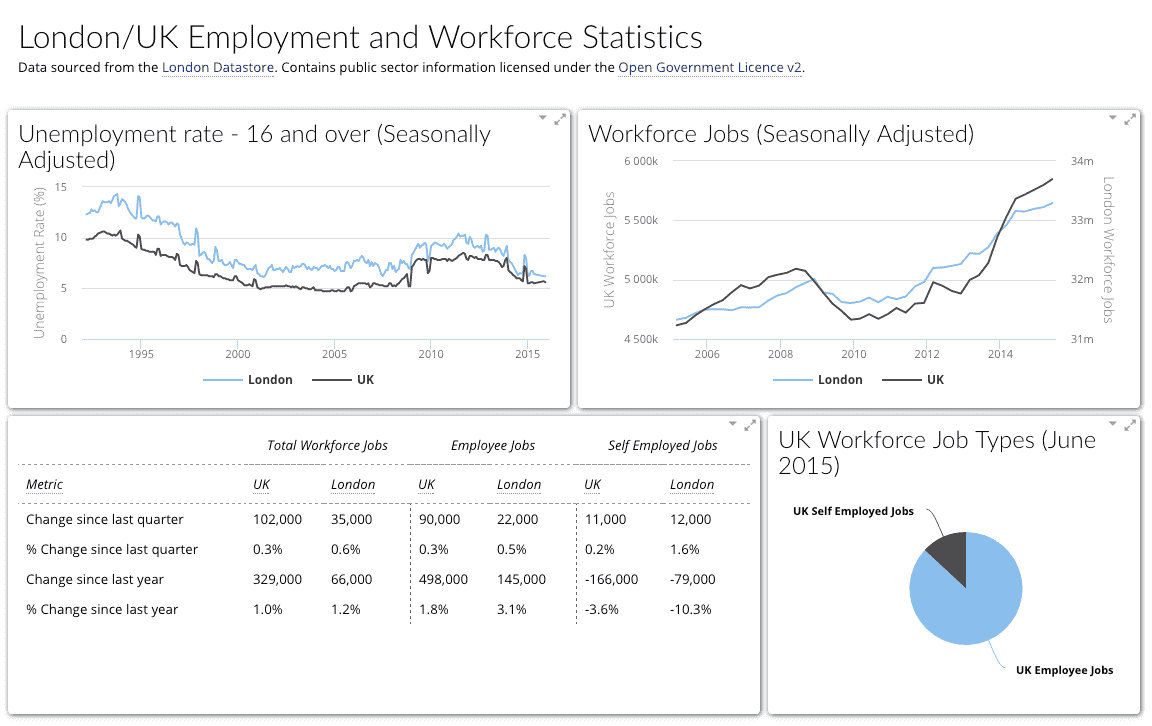
Cyclotron makes it easy for non-technical users to create and share data-driven insights and information, without having to rely on technical expertise.
Cyclotron provides standard boilerplate and plumbing, allowing non-programmers to easily create and edit dashboards using customizable components. It has a built-in dashboard editor, and hosts the dashboards directly.
Dashboards are defined declaratively as a JSON document, which contains all the properties required to render the Dashboard.
One of the key features of Cyclotron is its ability to integrate with a variety of data sources, including spreadsheets, databases, and cloud-based data services like Google Analytics and Salesforce. This allows users to connect to the data they need, without having to rely on IT or data engineering teams.
In summary, Cyclotron is geared towards business intelligence and reporting, while Grafana is focused on observability and infrastructure monitoring. Depending on your use case, one or the other may be better suited to your needs.
Pros
- Vast range of widgets.
Cons
- Low number of pre-built dashboards.
- No built-in interactivity.
Redash
Redash is a powerful open source project that allows you to connect and query data sources and visualize them in dashboards. Redash offers integrations with the most popular databases and platforms.
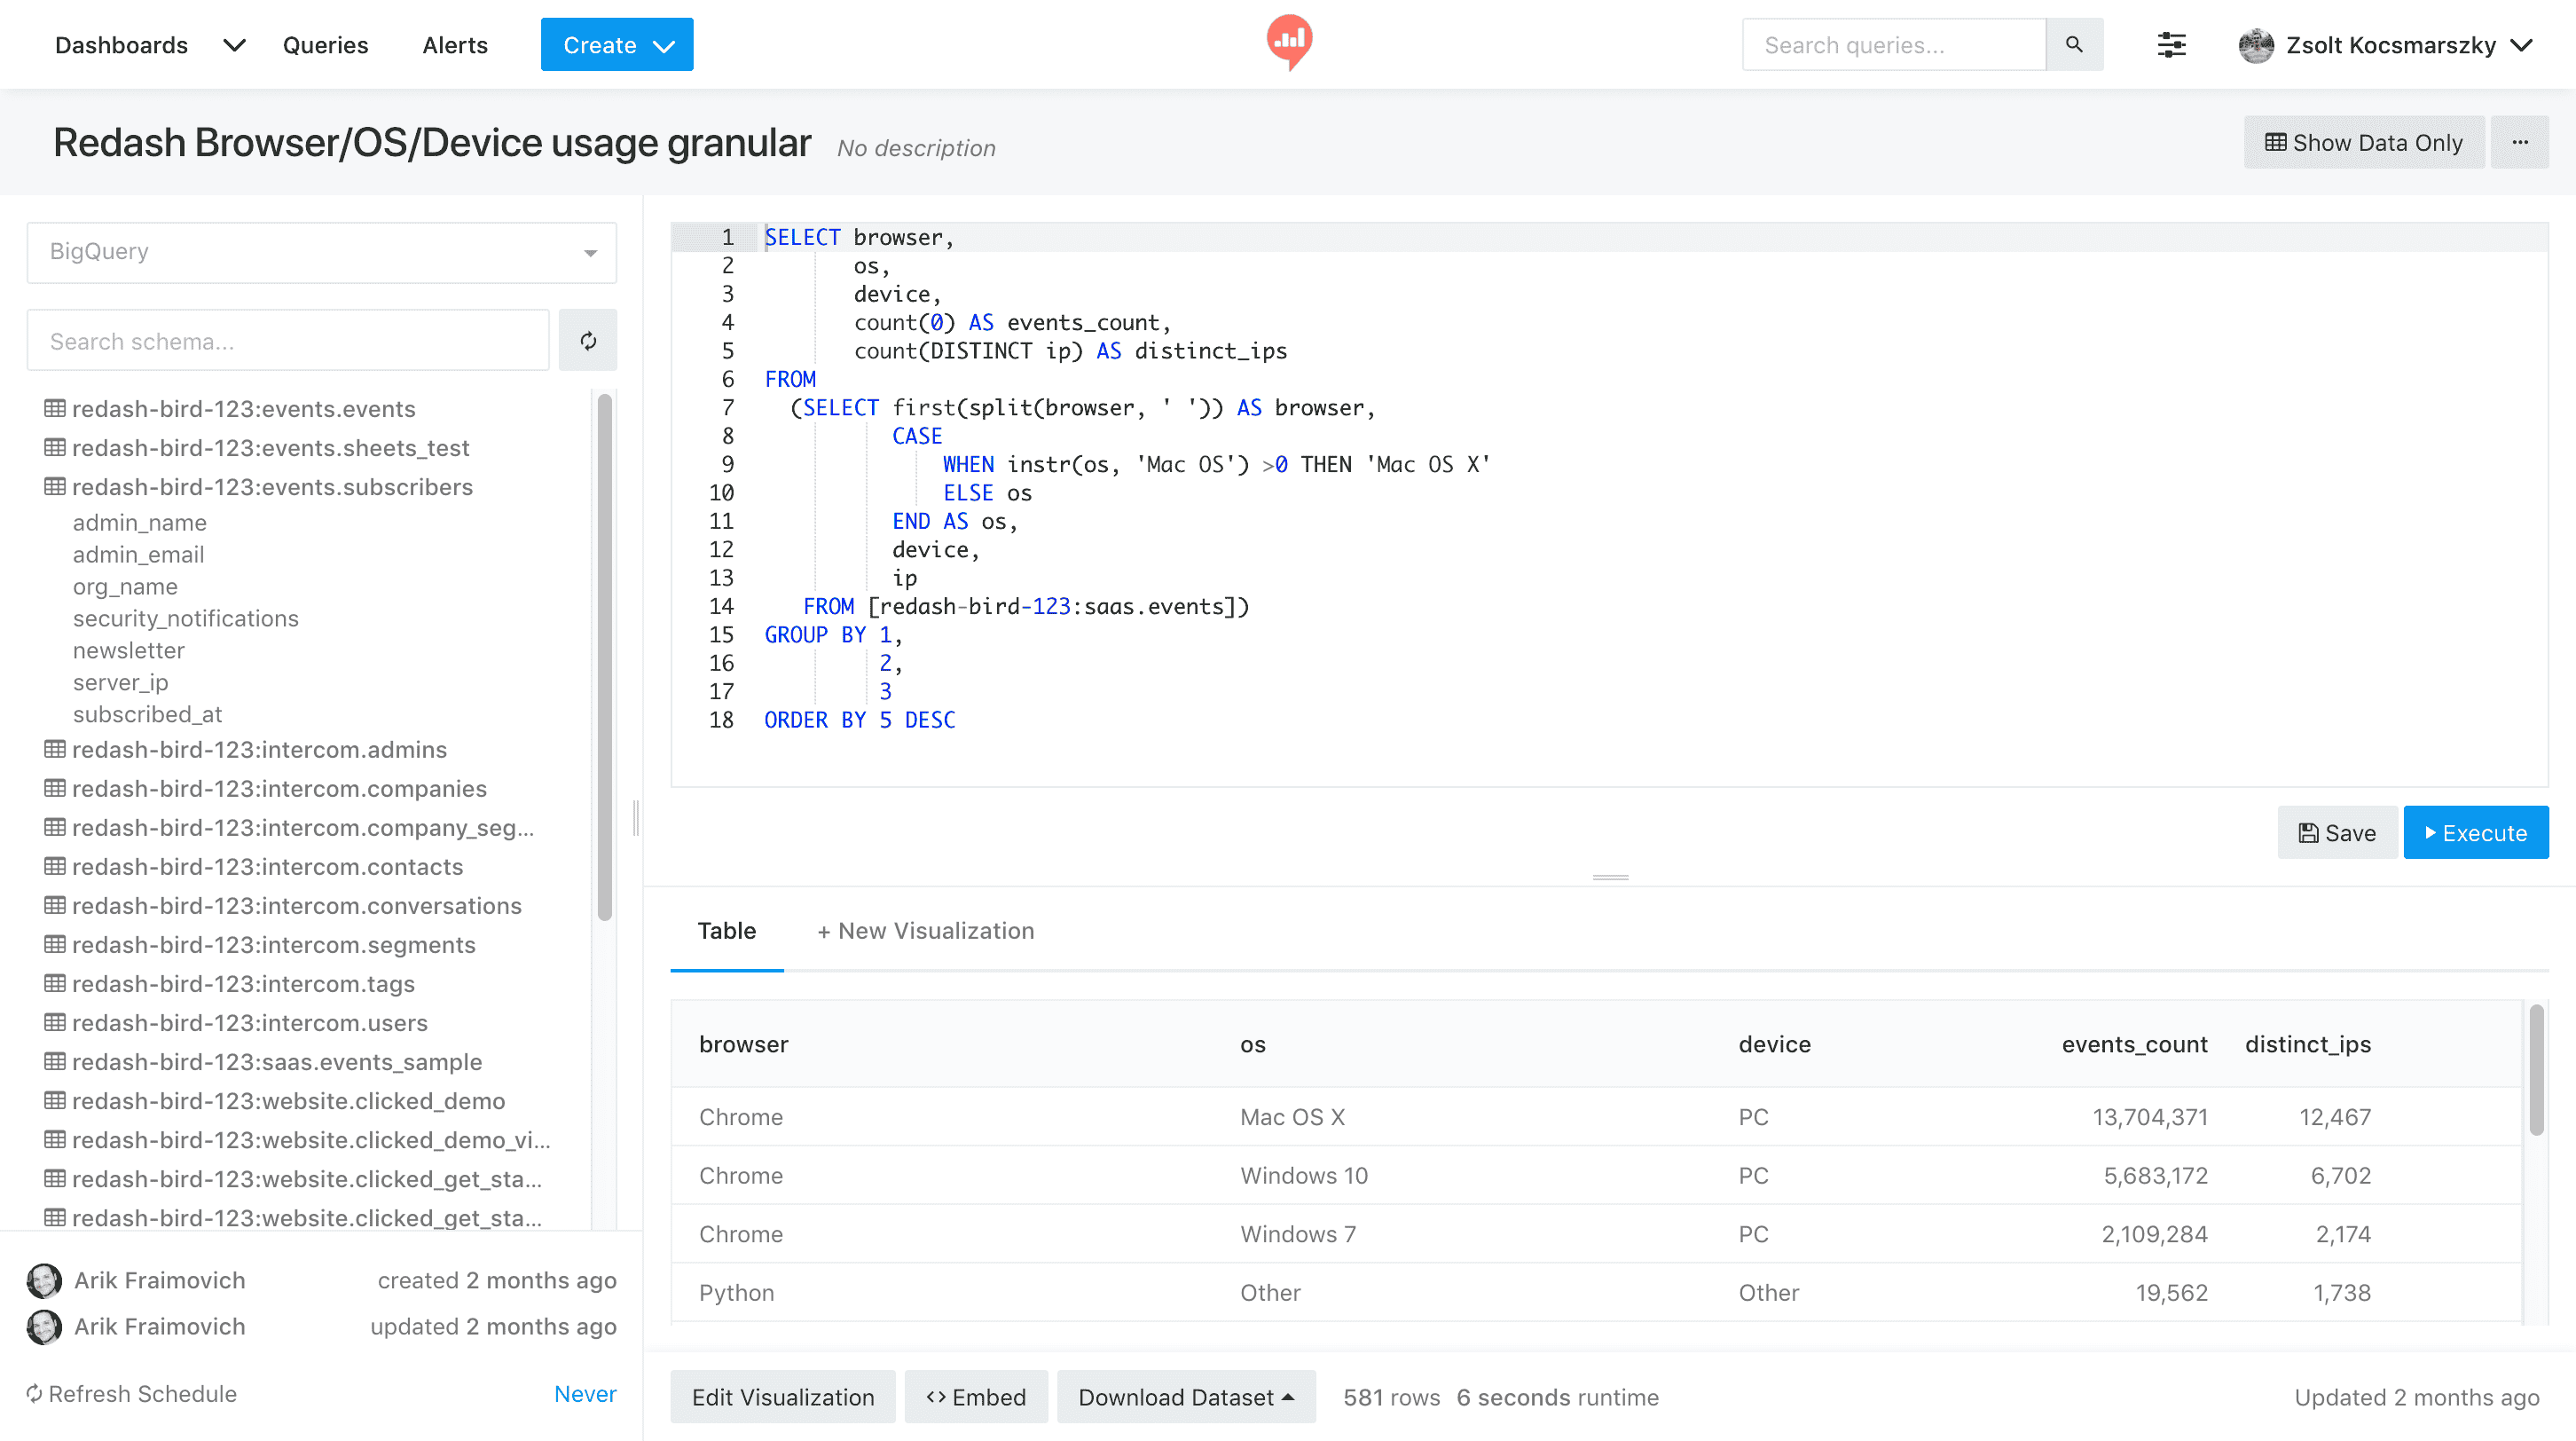
Redash enables SQL users to explore, query, visualize, and share data from any data sources. Redash also allows you to define conditions and be alerted instantly when your data changes.
Redash is written in Python and provides a web interface in which you can build and share dashboards. It has no extra dependencies.
Redash allows you to choose from a vast amount of visualization options such as graphs, tables, and heatmaps.
In summary, Redash is a more general-purpose data visualization tool, while Grafana is geared towards time-series data and infrastructure monitoring. The choice between the two will depend on the specific needs and requirements of your use case.
Pros
- More than 35 SQL and NoSQL data sources.
- Lots of different visualization types.
Cons
- Requires writing complex SQL queries.
Prometheus
Prometheus is an open-source monitoring system with flexible query language and real-time alerting. It records metrics in a time series database using a HTTP pull model.
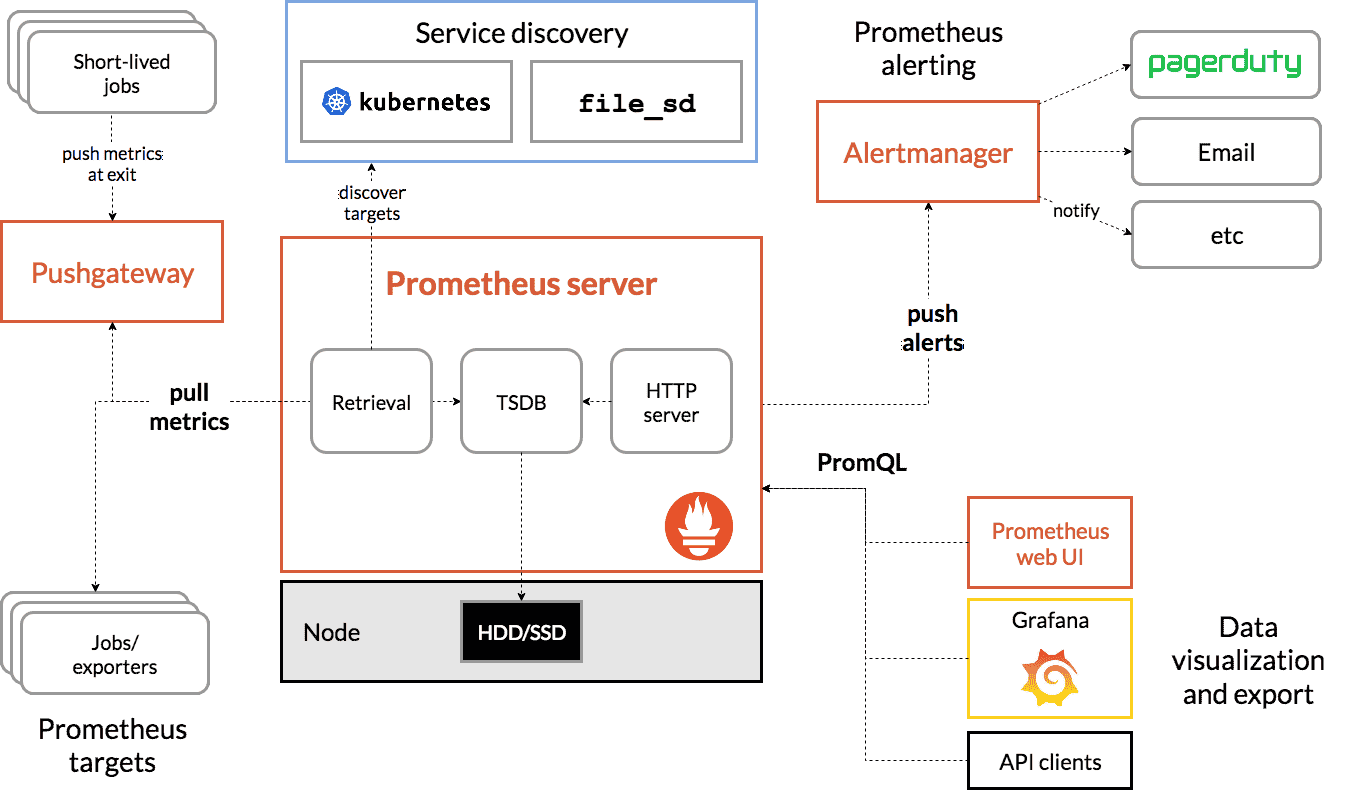
Prometheus pulls metrics from monitored targets at given intervals allowing you to monitor things like CPU, memory, and disk space usage, and more.
Prometheus offers a powerful query language to query and aggregate metrics, for example, you can select a list of running threads sorted by CPU usage.
You can also configure alerts to be notified when, for example, filesystem usage reaches a certain threshold.
Most Prometheus components are written in Go, making them easy to build and deploy as static binaries. Prometheus has a decentralized architecture making it scalable and fault-tolerant.
Prometheus is responsible for collecting, storing, and querying metrics, while Grafana is responsible for visualizing and analyzing the data. Both tools complement each other, making it possible to build a complete monitoring solution that provides a deep understanding of the system's performance.
Pros
- Simple setup and deploy.
- Fast and feature-rich query language.
Cons
- Limited visualization capabilities. Must be used with Grafana or alternatives.
- Scaling for high-load can be challenging.
InfluxDB
InfluxDB is a scalable datastore for metrics, events, and real-time analytics. InfluxDB does not replace Grafana, but you can use it as a Grafana datasource.
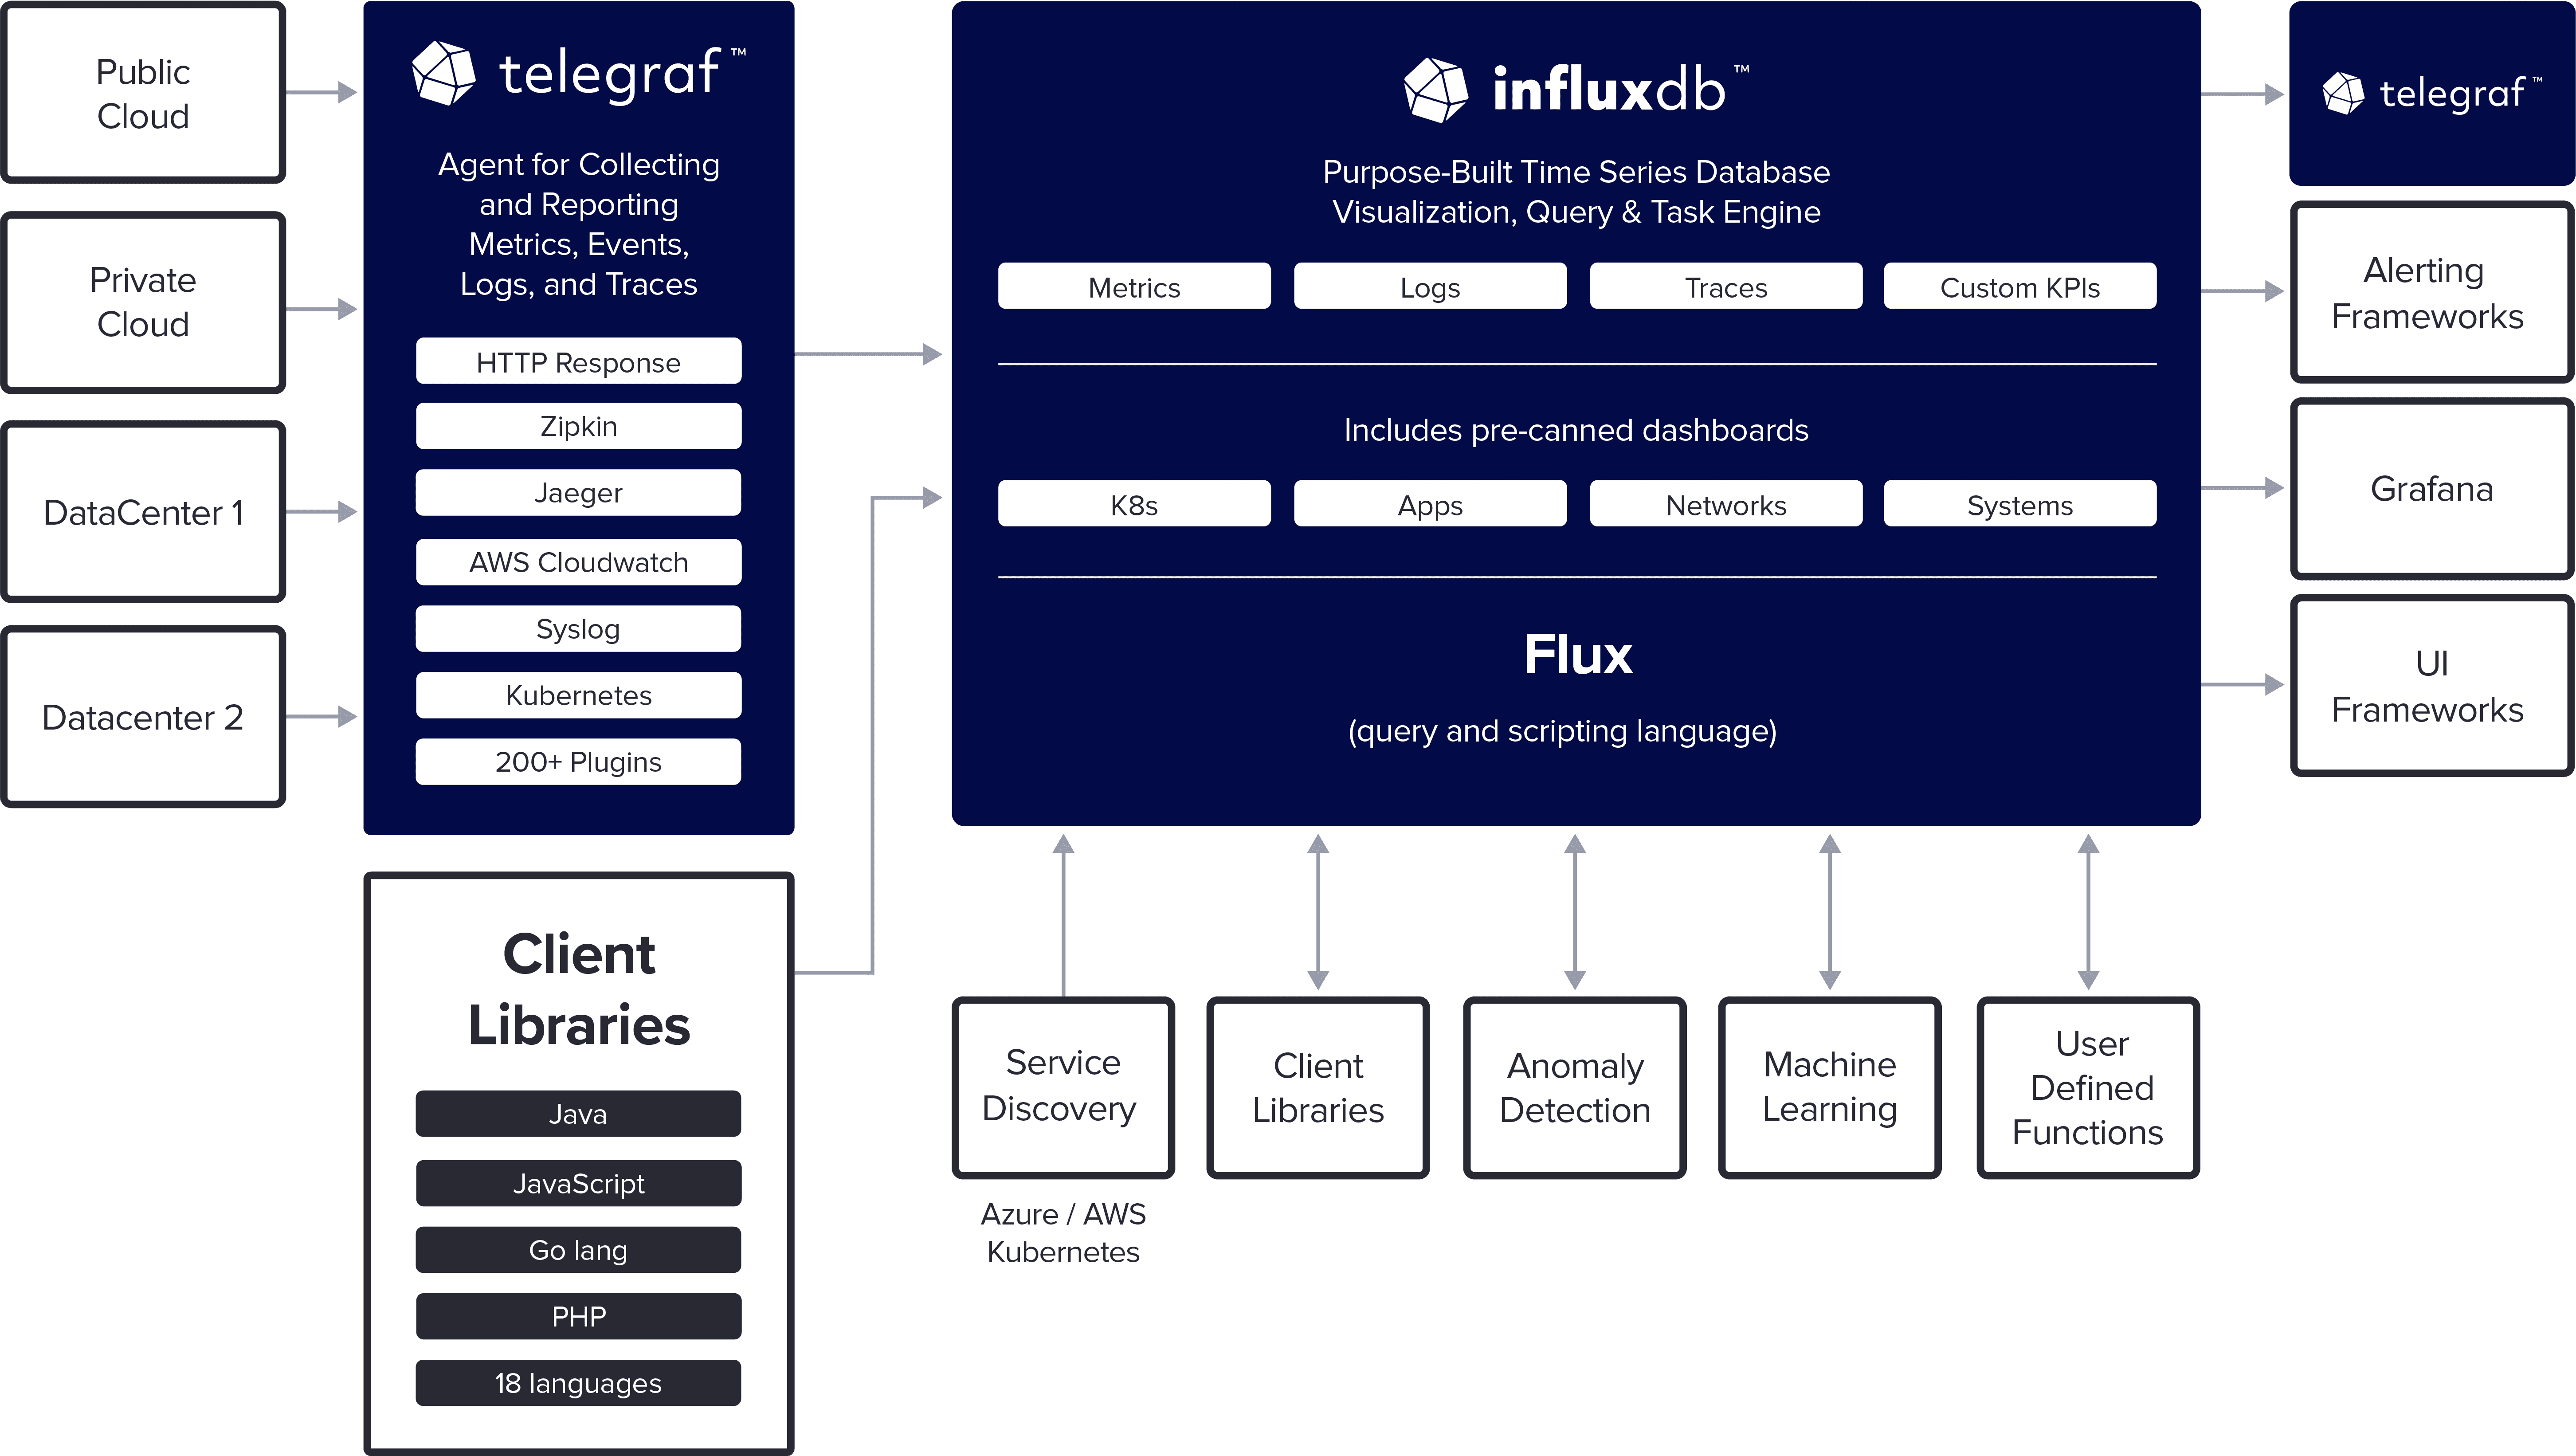
Grafana and InfluxDB are both open-source tools used for monitoring and observability. However, they have different purposes and are typically used together in a monitoring solution.
InfluxDB is written in Go, supports pluggable extensions, and comes with clients and libraries for most popular programming languages and frameworks.
InfluxDB is schemaless, so you can add new fields on the fly without changing your data model. You can use a powerful query language called InfluxQL to analyze your data in many different ways.
Pros
- Powerful query language called InfluxQL.
- Schemaless.
Cons
- No visualization. Must be used with Grafana or alternatives.
- Requires learning InfluxQL.
- Somewhat slower than other timeseries databases.
VictoriaMetrics
VictoriaMetrics is fast, cost-effective monitoring solution and time series database.
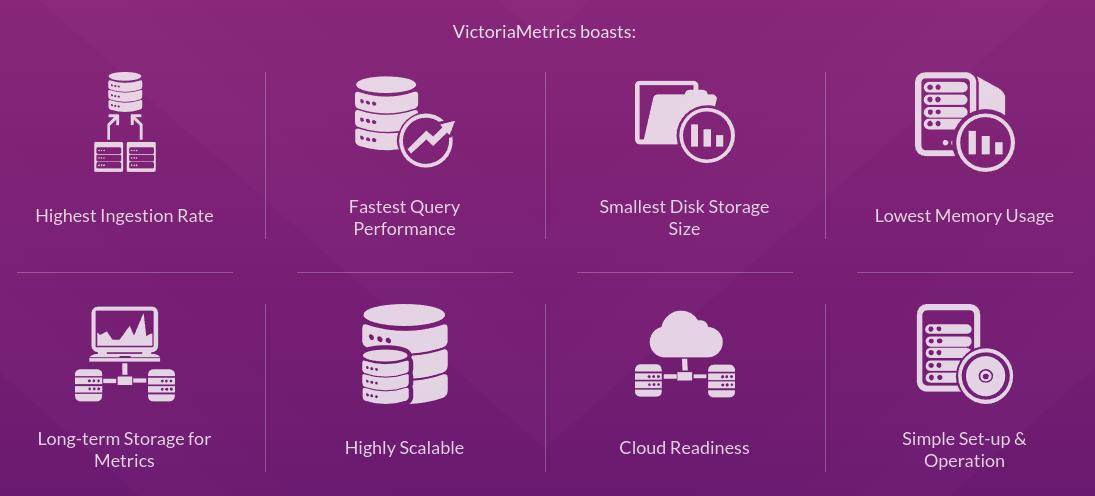
VictoriaMetrics can be used as drop-in replacement for Prometheus. For reading the data and evaluating alerting rules, VictoriaMetrics supports PromQL and MetricsQL.
For data ingestion, VictoriaMetrics supports the Prometheus pull model and various push protocols such as Graphite, InfluxDB, OpenTSDB, and more.
VictoriaMetrics is a time-series database designed for storing, querying, and processing large amounts of metrics data with high performance and reliability. It's well-suited for storing time-series data from sources such as Prometheus and can handle high write and query loads. VictoriaMetrics also supports advanced features such as data retention policies, continuous queries, and a complex query language.
VictoriaMetrics is written in Go and consists of a single small executable without external dependencies.
Pros
- Faster and uses less RAM than Prometheus/InfluxDB.
- PromQL-based query language.
- Good vertical and horizontal scalability.
Cons
- No visualization. Must be used with Grafana or alternatives.
Sematext
Sematext allows to detect and troubleshoot production & performance issues with logs, metrics, synthetic and real user monitoring.
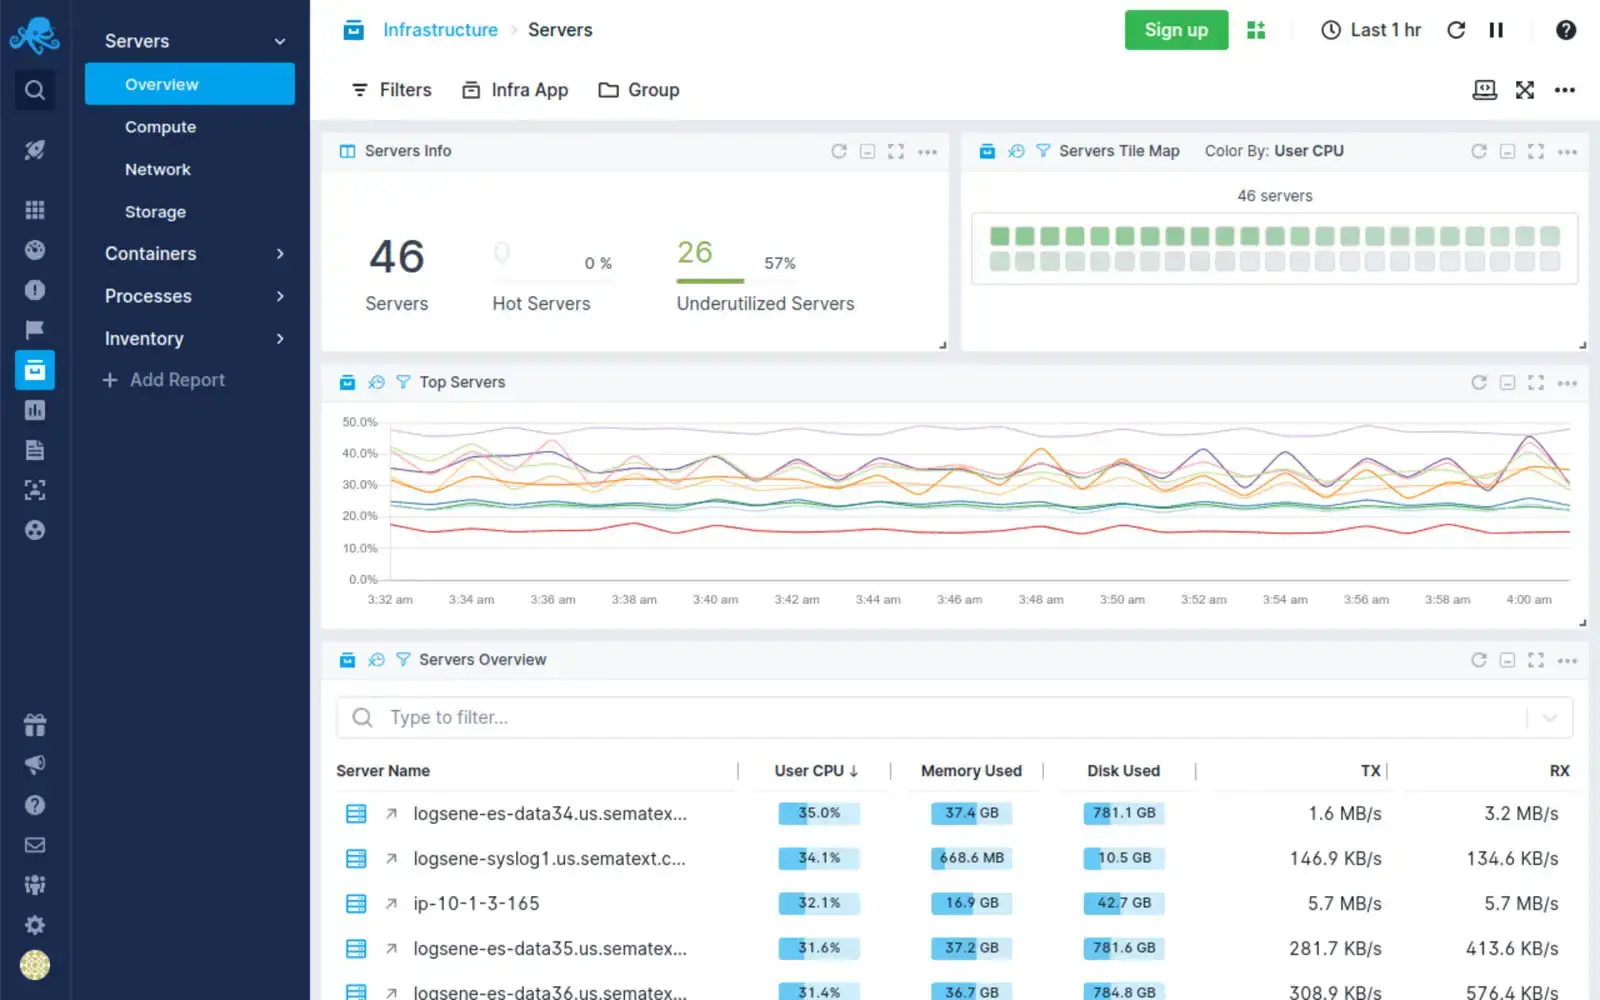
Dashboards and infrastructure metrics (e.g., common databases and NoSQL stores, servers, containers, etc.) come out of the box and can be customized.
Sematext also provides powerful alerting with anomaly detection and scheduling. It provides actionable insights and alerts in real-time, so you can resolve issues in no time.
Pros
- Powerful dashboards with Grafana-like UI.
- Elasticsearch API and Kibana integration.
Cons
- Limited query language.
- No open source version.
In summary, Sematext provides a comprehensive monitoring and logging platform that integrates multiple data sources, while Grafana provides data visualization and dashboarding capabilities.
Conclusion
Each of these Grafana alternatives has its own strengths, features, and pricing models. It's important to evaluate your specific requirements and consider factors like data sources, ease of use, scalability, and integrations when choosing the best fit for your needs.
You may also be interested in: