Grafana vs Prometheus [Detailed Technical Comparison for 2025]
Grafana and Prometheus have become integral components in observability stacks. This comprehensive analysis examines Grafana and Prometheus, two leading open-source tools that address critical aspects of system observability.
We'll dissect their architectures, compare key features, and evaluate their performance in various deployment scenarios. Our goal is to provide a detailed, technical comparison that enables informed decision-making for implementing effective monitoring strategies in complex, distributed environments.
Ease of Deployment: Even Ground
Prometheus
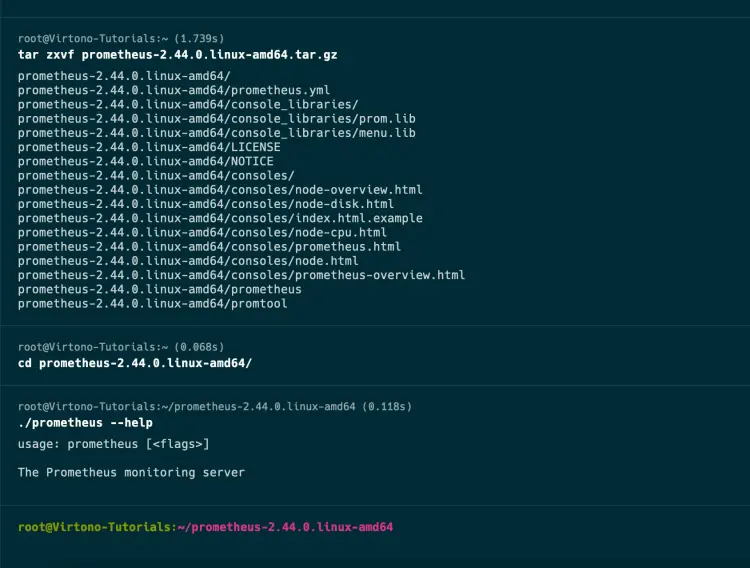
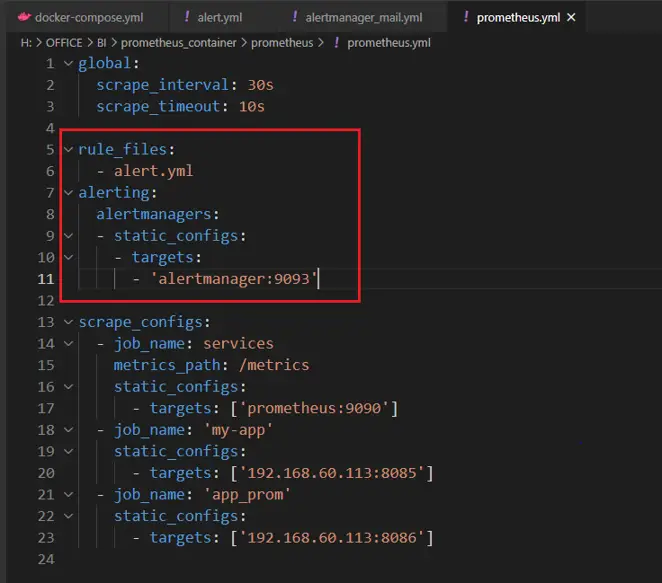
Prometheus offers a straightforward setup process with binaries available for various operating systems. Its configuration is YAML-based, making it familiar to many DevOps professionals.
Grafana
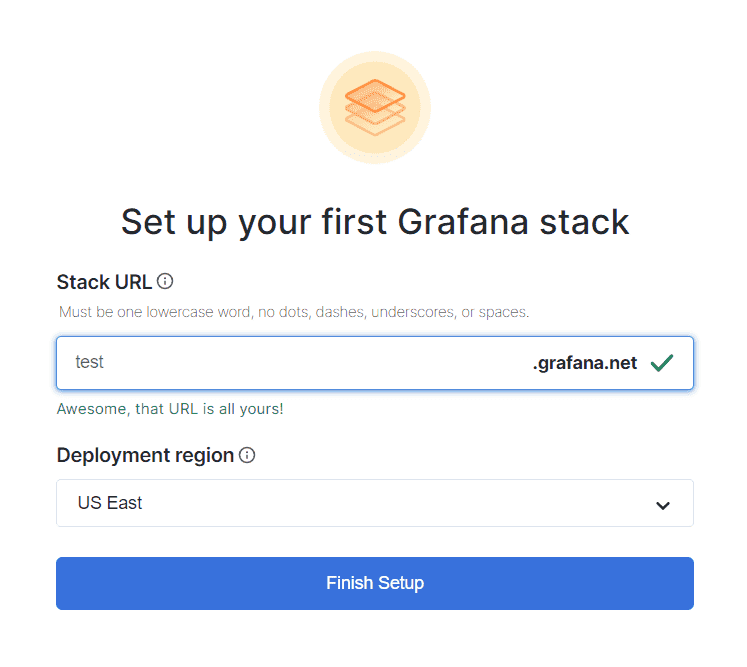
Grafana provides an easy installation process with options ranging from binary downloads to container images. Its initial setup can be done through a user-friendly web interface.
Summary
Both tools offer relatively simple setup processes, making this aspect evenly matched. The choice often depends on personal preference and existing infrastructure.
Data Collection: Prometheus Leads
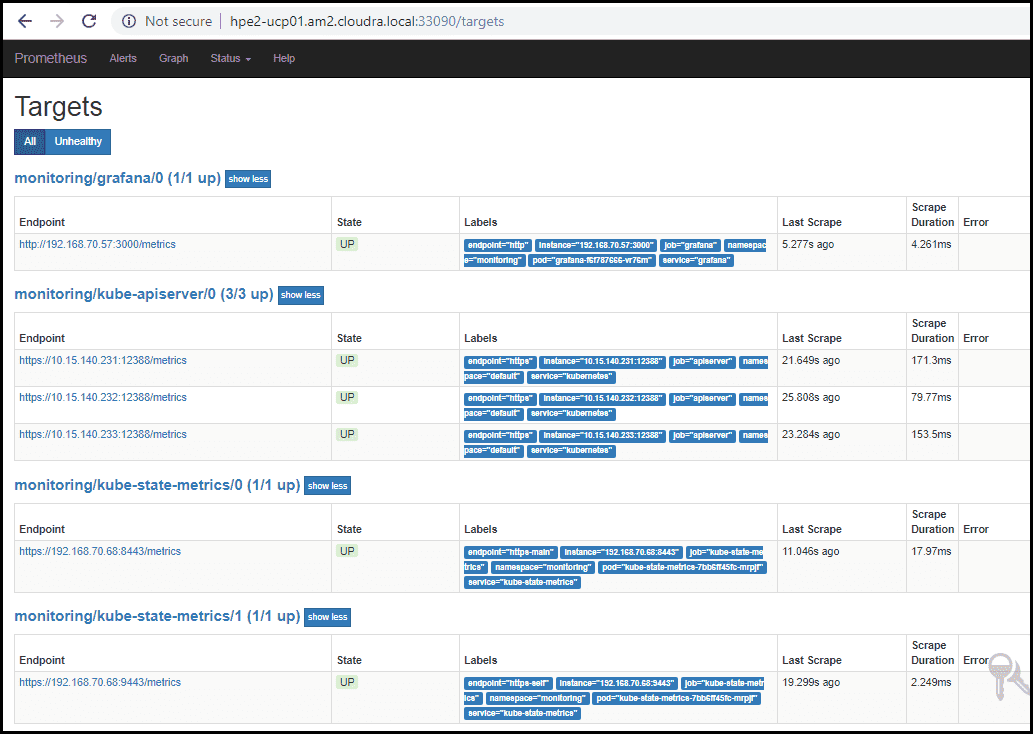
Prometheus
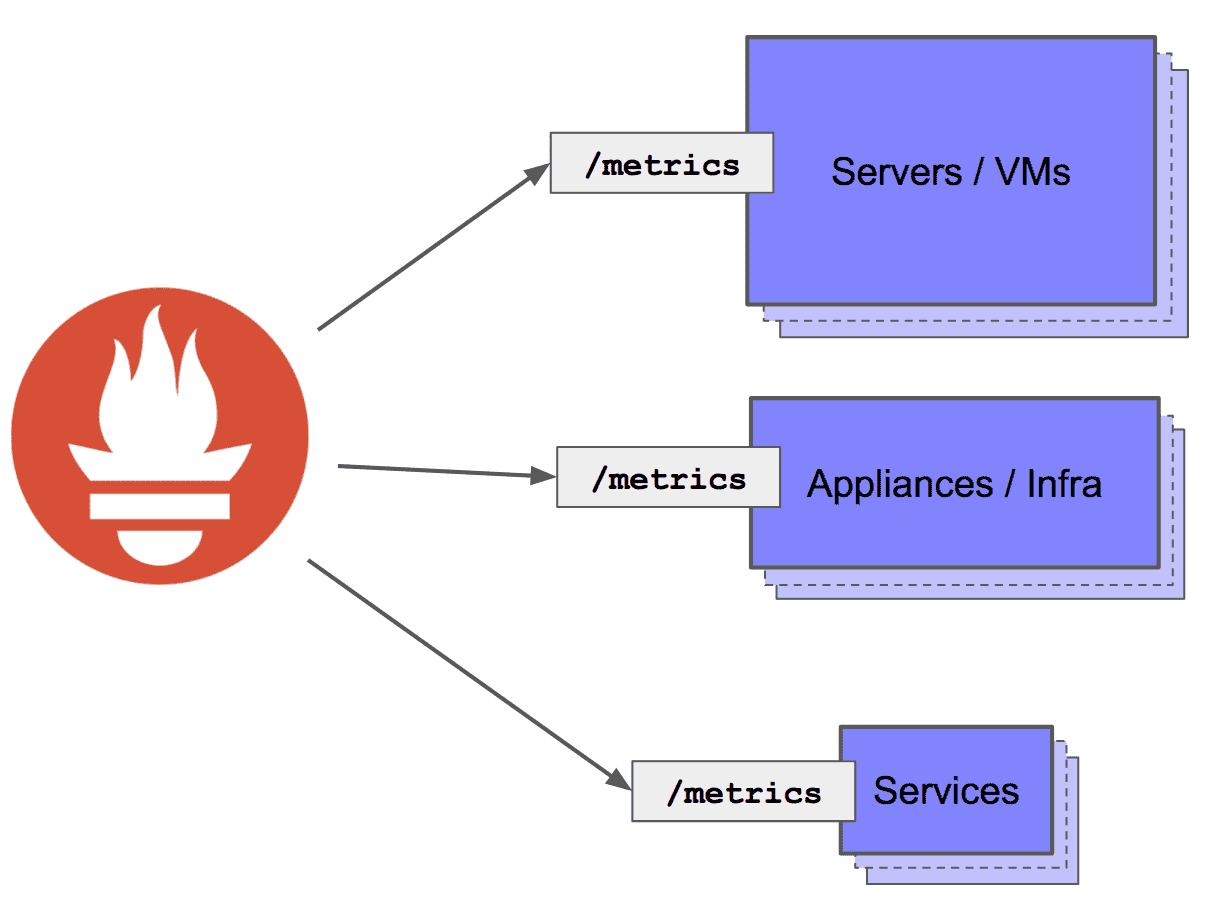
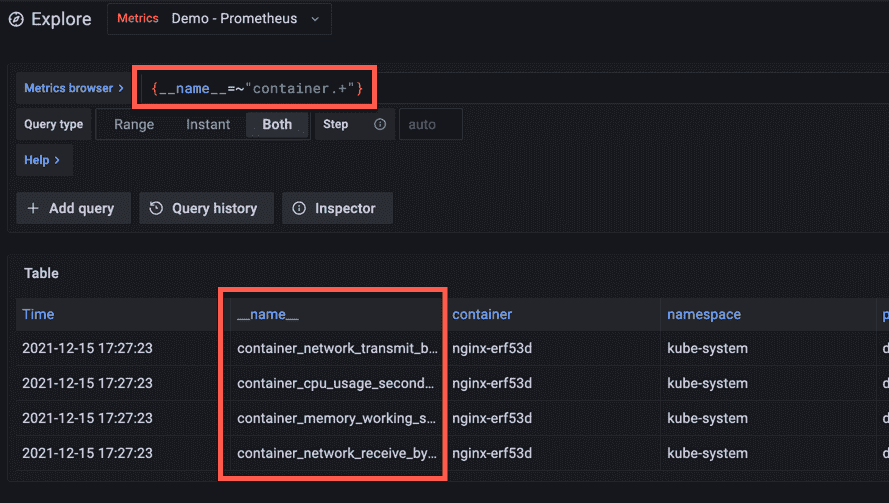
Prometheus uses a pull-based model, actively scraping metrics from configured targets. It supports a wide range of exporters for various systems and applications. For comprehensive observability solutions, you can combine Prometheus and OpenTelemetry to leverage the strengths of both systems while extending metric collection capabilities across distributed environments.
Grafana
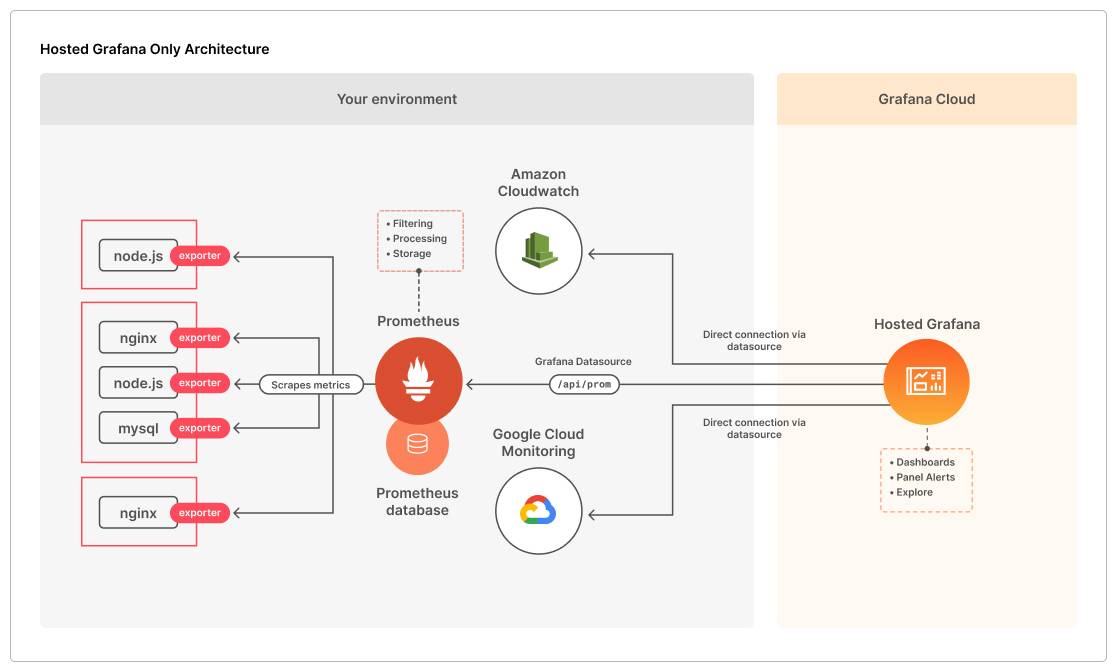
While Grafana excels in visualization, it relies on external data sources for metrics collection. It can integrate with Prometheus and other monitoring systems but doesn't collect metrics itself.
Summary
Prometheus takes the lead in this category due to its native metrics collection capabilities.
Visualization Capabilities: Grafana Shines
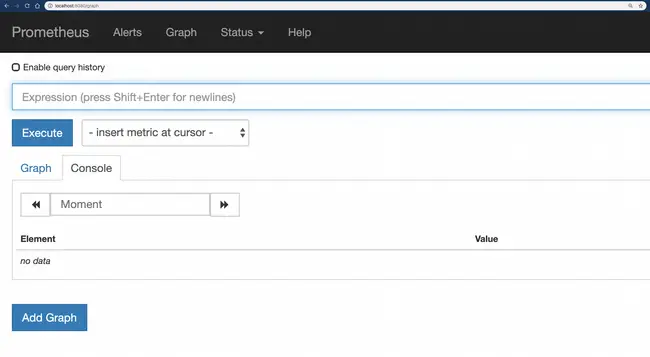
Prometheus
Prometheus includes a basic web UI for querying and graphing. While functional, it's limited in terms of customization and advanced visualizations.
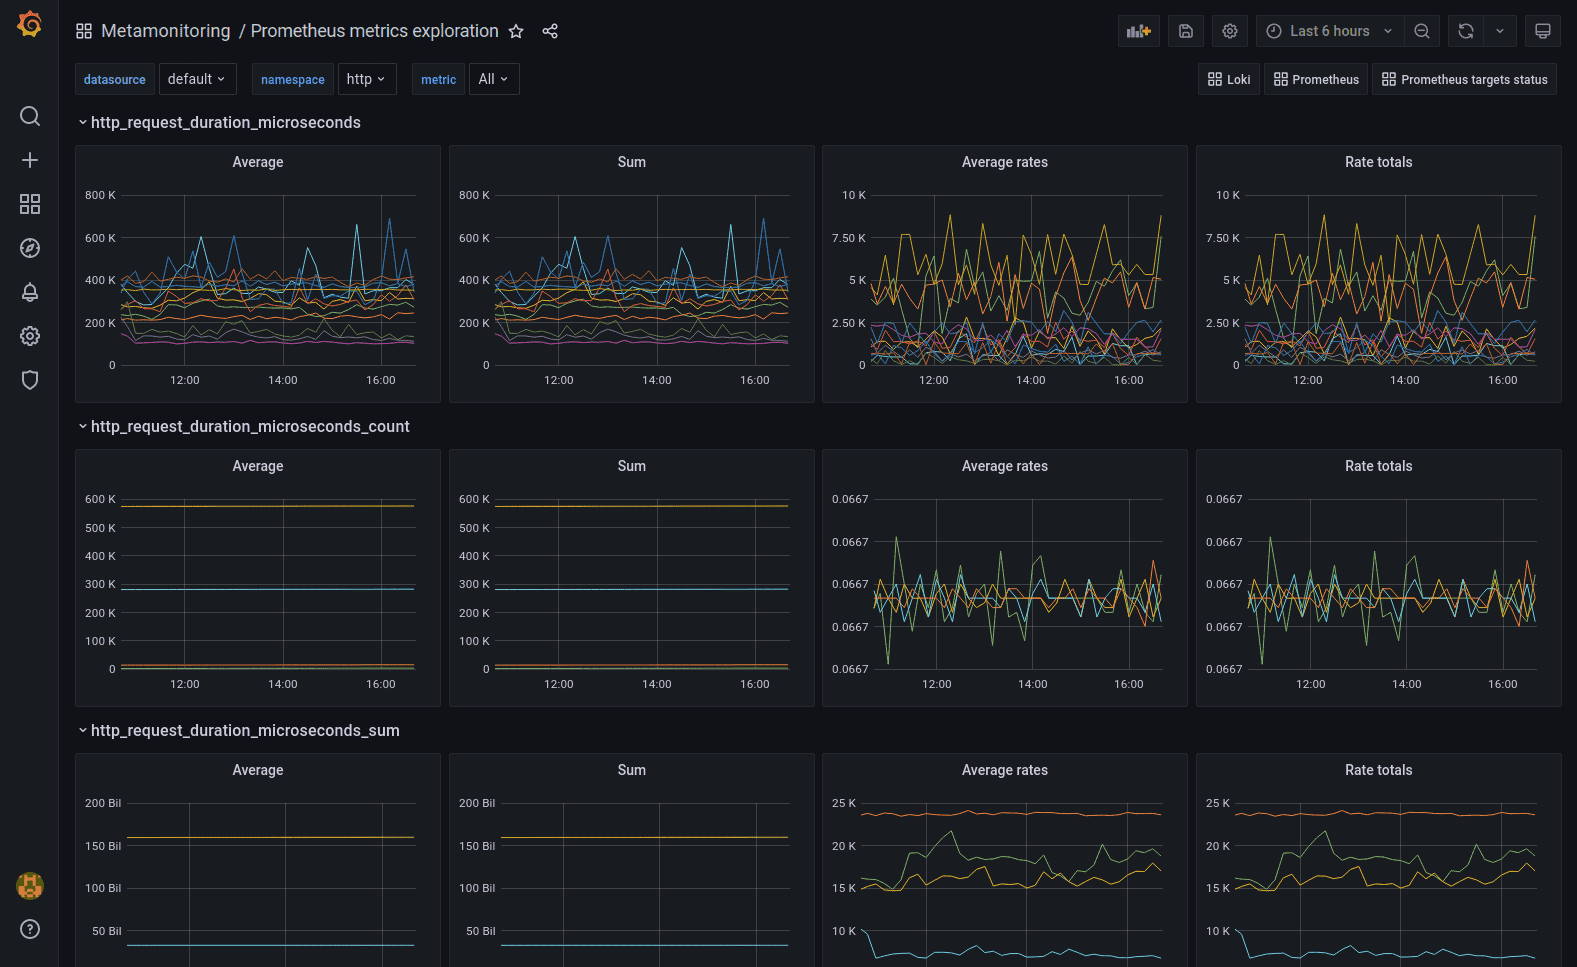
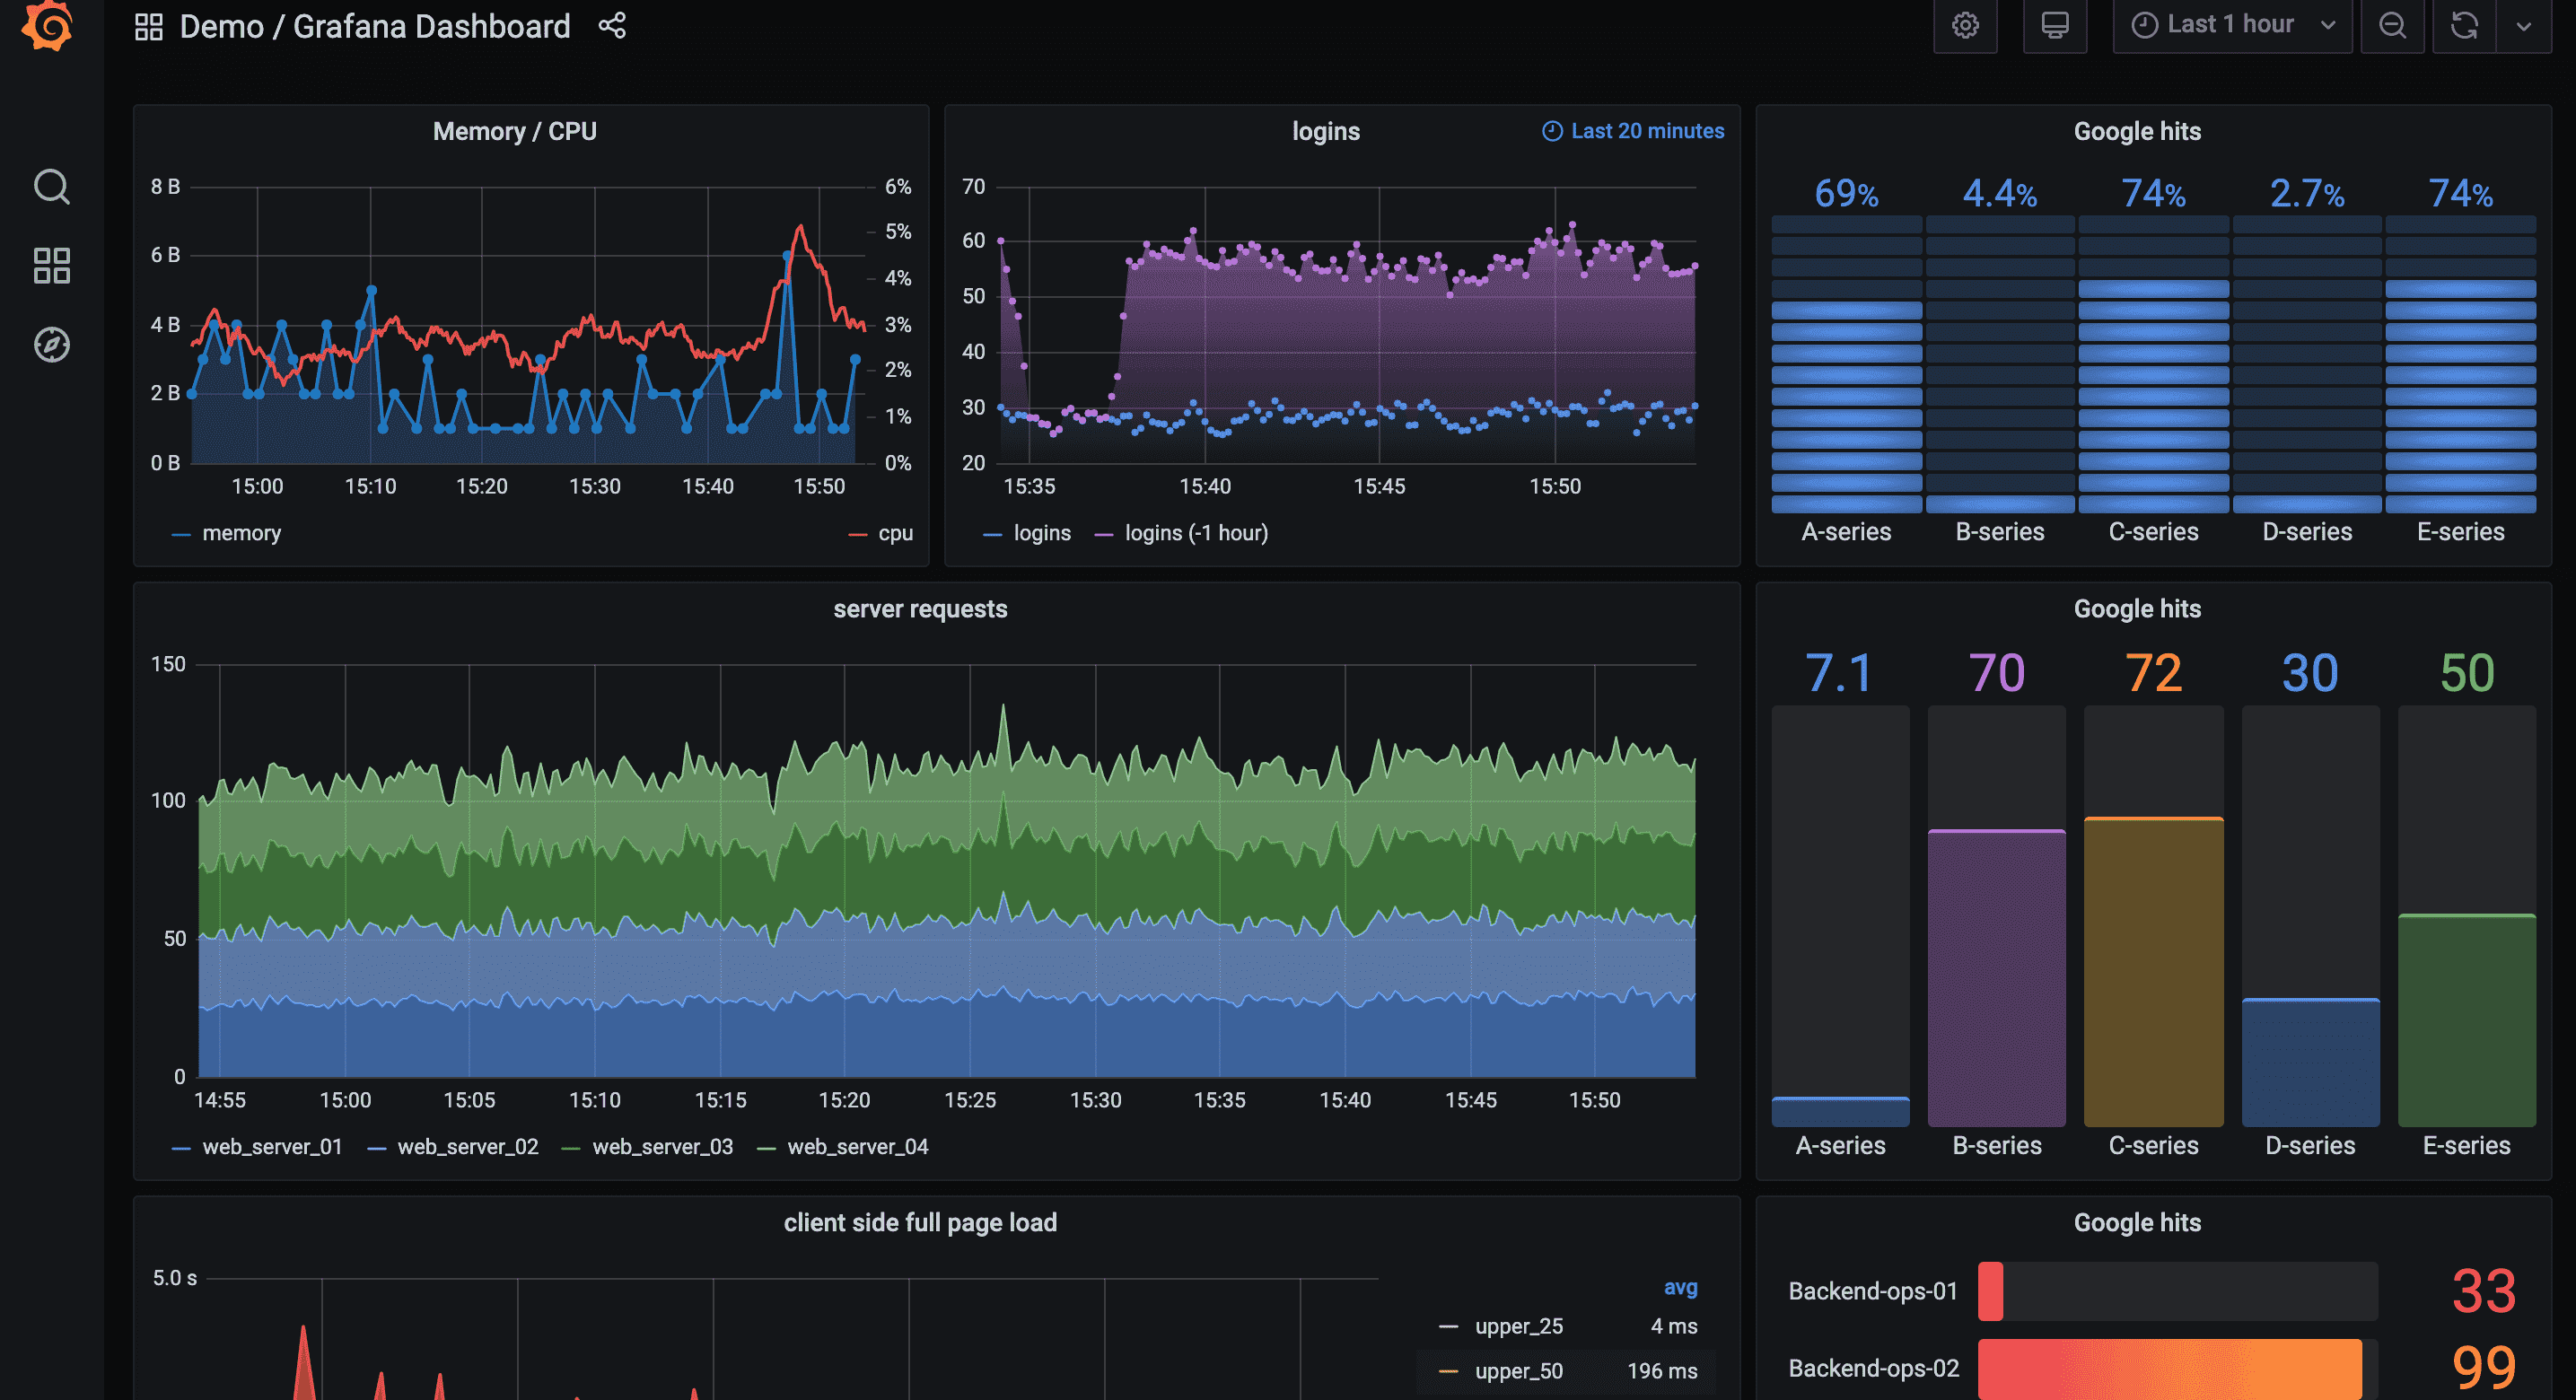
Grafana
Grafana is purpose-built for data visualization, offering a wide range of chart types, customizable dashboards, and the ability to combine data from multiple sources.
Summary
Grafana is the clear winner in visualization capabilities, offering more flexibility and aesthetically pleasing results.
Log Management: Grafana's Strength
Prometheus
Prometheus is primarily focused on metrics and doesn't handle log management natively.
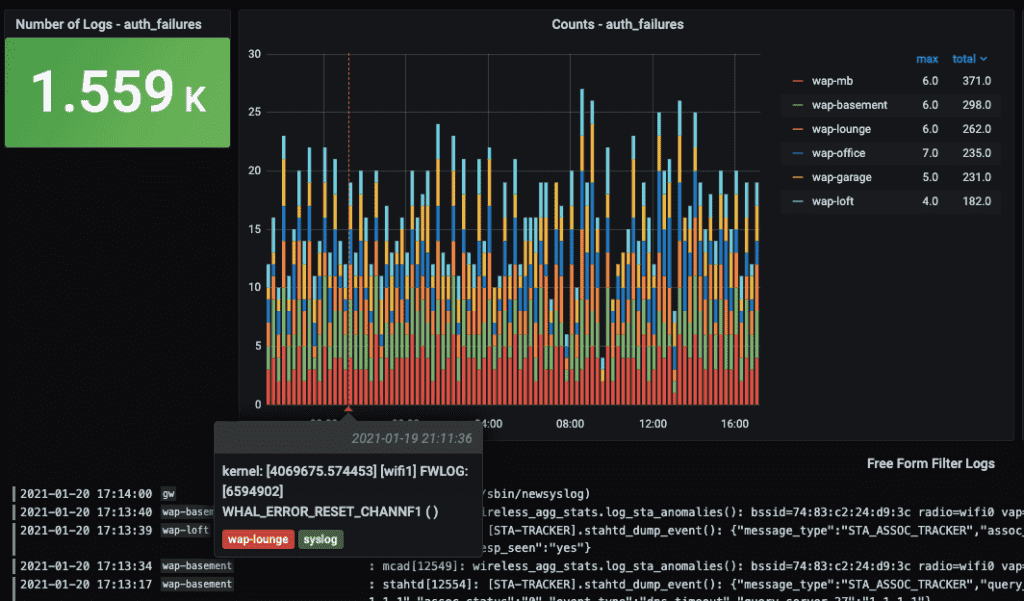
Grafana
Grafana, especially with the Loki integration, provides powerful log management capabilities alongside its metrics visualizations.
Summary
Grafana wins in the log management category, offering more comprehensive solutions for handling logs.
Application Performance Monitoring (APM): Grafana's Edge
Prometheus
While Prometheus can be used for some aspects of APM, it's not a full-fledged APM solution.
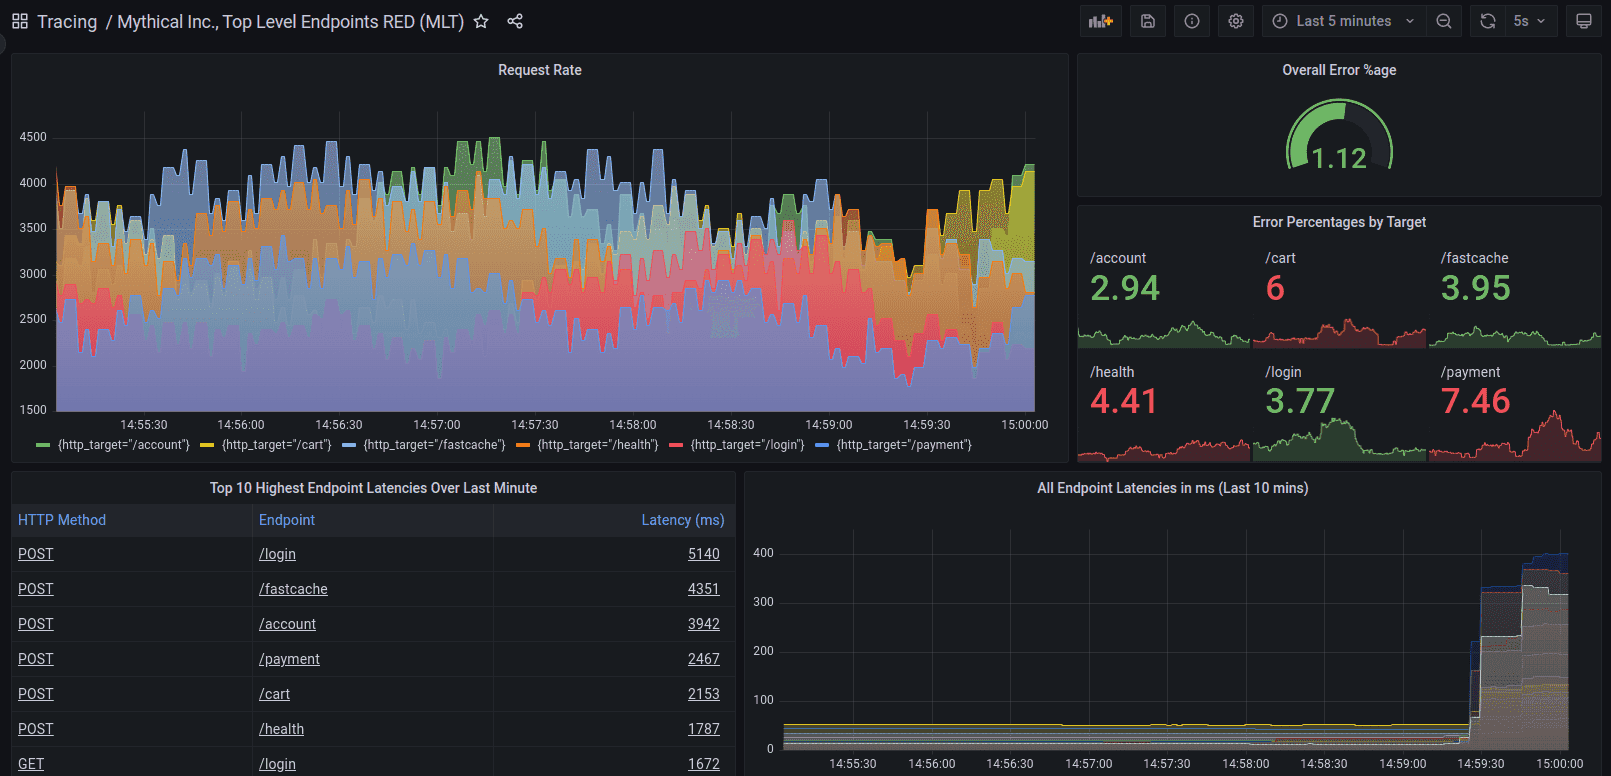
Grafana
Grafana, especially when combined with tools like Tempo, offers more robust APM capabilities, including distributed tracing.
Summary
Grafana has an edge in APM, particularly when considering its ecosystem and integrations.
Data Query: A Close Match
Prometheus
PromQL, Prometheus's query language, is powerful for time-series data and supports complex operations on metrics.
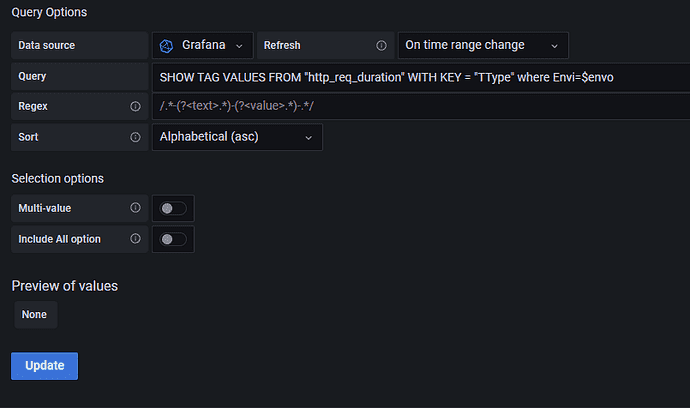
Grafana
Grafana supports multiple query languages depending on the data source, including PromQL when used with Prometheus.
Summary
This category is closely matched, as both offer strong querying capabilities suited to their primary functions.
Data Storage: Prometheus's Domain
Prometheus
Prometheus includes a built-in time-series database optimized for storing and querying metrics data.
Grafana
Grafana doesn't provide data storage; it relies on external databases and time-series stores.
Summary
Prometheus wins in this category due to its integrated storage solution designed for metrics.
Alerting: Neck and Neck
Prometheus
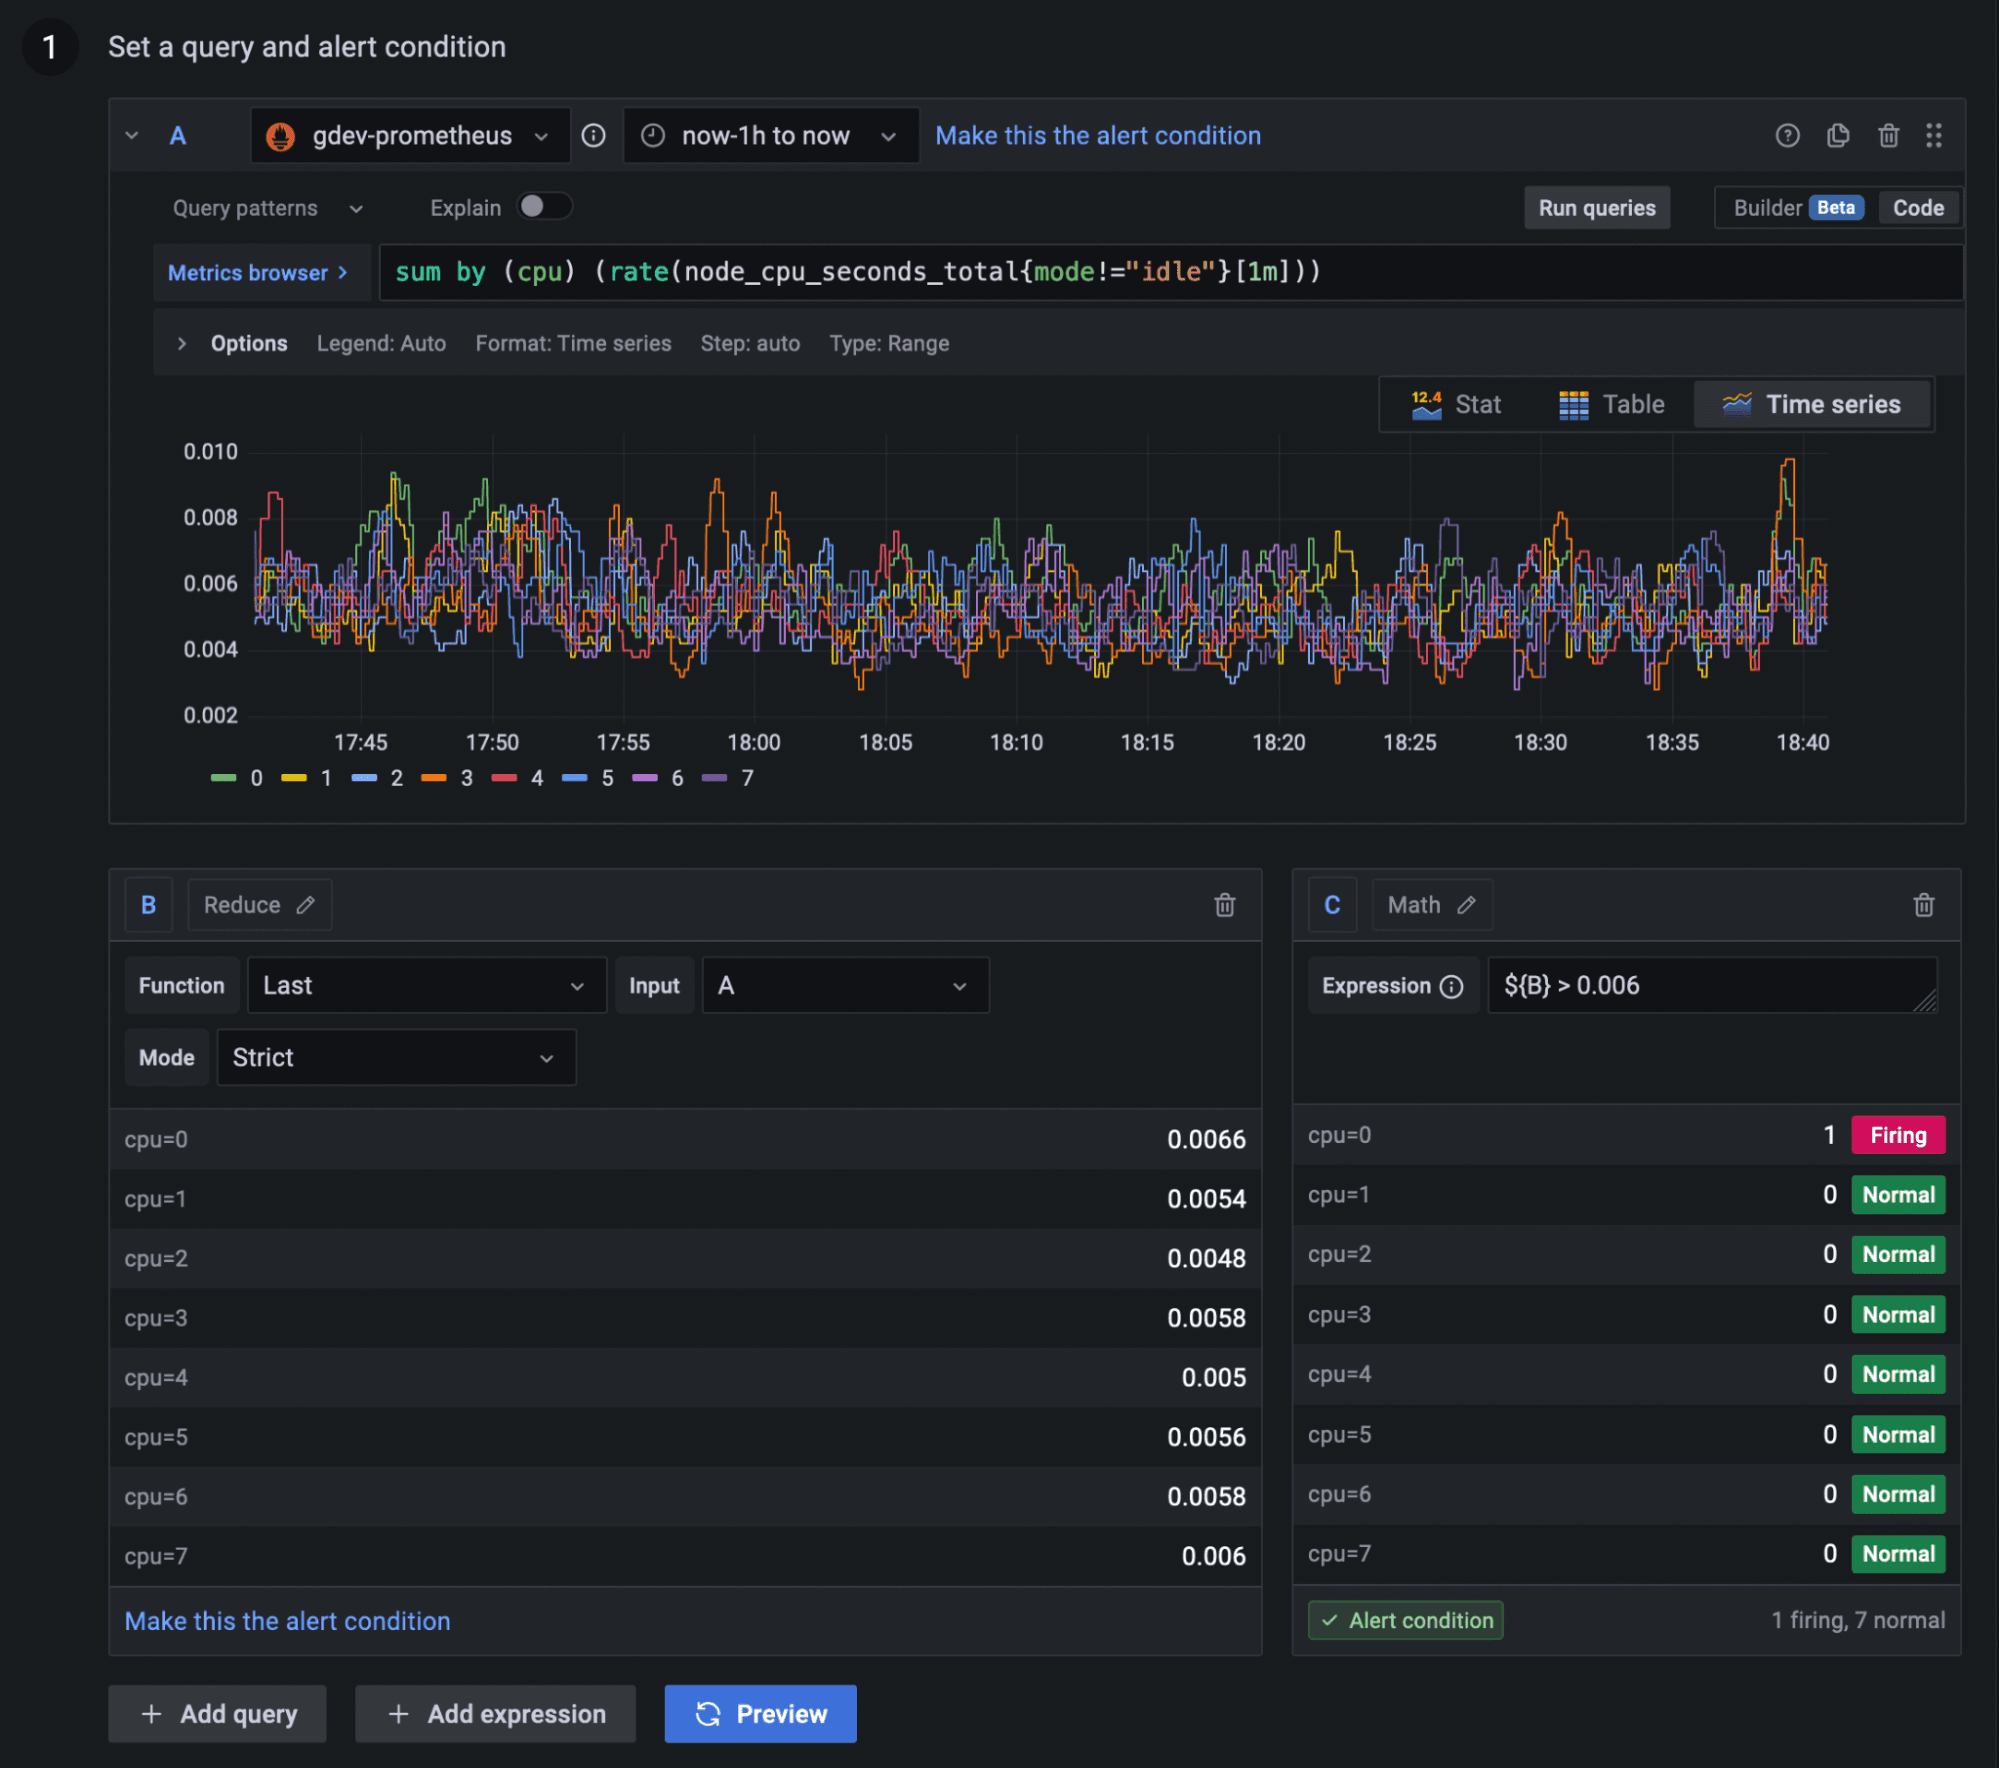
Prometheus includes a flexible alerting system that can be configured using the same PromQL language used for querying.
Grafana
Grafana offers a unified alerting system that works across different data sources, with a user-friendly interface for setting up alerts.
Summary
This category is evenly matched, with both offering robust alerting features that cater to different preferences.
Cloud Options: Grafana Takes the Lead
Prometheus
While Prometheus can be deployed in cloud environments, it doesn't offer a native managed cloud service.
Grafana
Grafana Cloud offers a fully managed, scalable solution. The open-source version can also be easily deployed in cloud environments.
Summary
Grafana wins in this category, particularly when considering its cloud offerings and scalability options.
UI/UX: Grafana's Forte
Prometheus
Prometheus's UI is functional but basic, focused more on utility than user experience.
Grafana
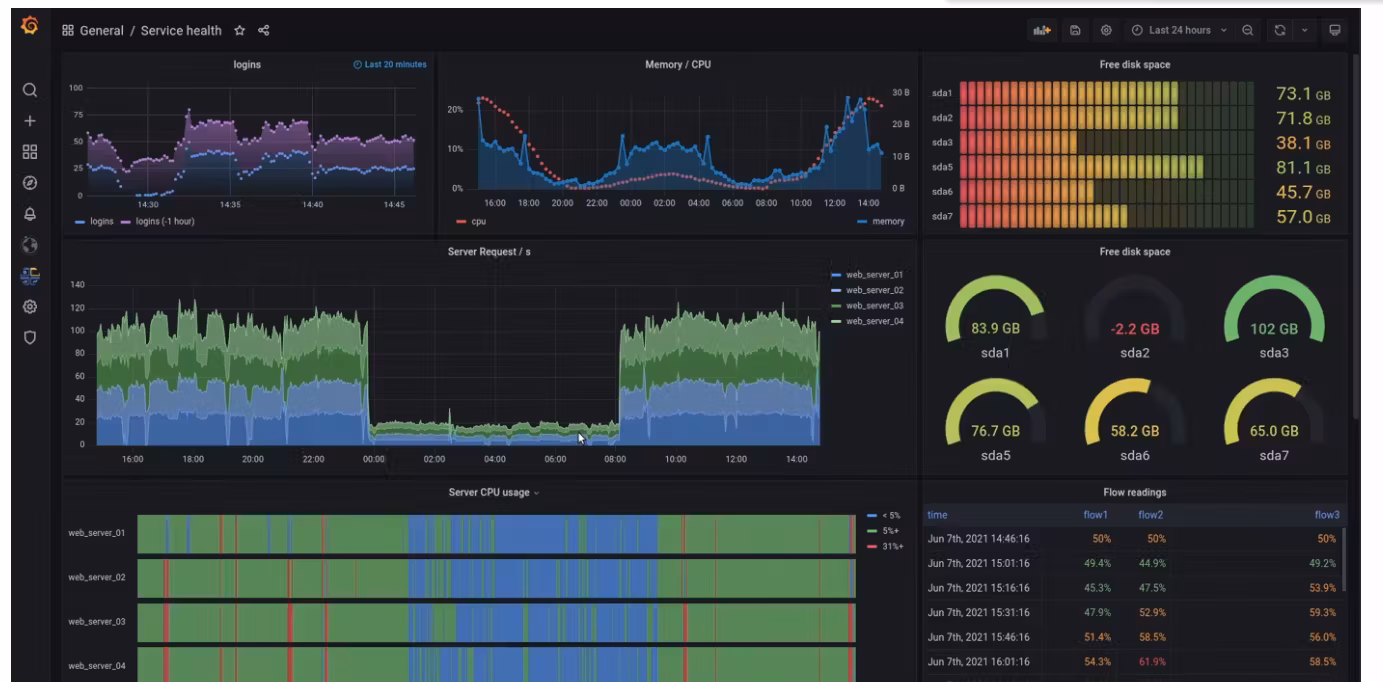
Grafana provides a polished, user-friendly interface with drag-and-drop dashboard creation and extensive customization options.
Summary
Grafana is the clear winner in UI/UX, offering a more intuitive and visually appealing experience.
Pricing: Prometheus Takes the Crown
Prometheus
Prometheus is completely open-source and free to use, with no paid tiers.
Grafana
While Grafana offers a robust open-source version, it also has paid plans for advanced features and managed services.
| Feature | Free | Pro | Advanced | Enterprise |
|---|---|---|---|---|
| Price (per user/month) | Free | $8 | Custom pricing | Custom pricing |
| Dashboards | Unlimited | Unlimited | Unlimited | Unlimited |
| Users | Unlimited | Unlimited | Unlimited | Unlimited |
| Data retention | 14 days | 1 year | Custom | Custom |
| Alerts | Basic | Advanced | Advanced | Custom |
| Plugins | Community only | Pro plugins | Pro plugins | Enterprise plugins |
| Support | Community Support | Standard support | Standard support | Dedicated support |
| Authentication | Basic | OAuth, SAML, LDAP | OAuth, SAML, LDAP | OAuth, SAML, LDAP |
Summary
Prometheus wins in terms of pricing, being entirely free and open-source.
Documentation and Community Support: Grafana Edges Ahead
Prometheus
Prometheus has strong documentation and an active community, with a wide range of resources available.
Grafana
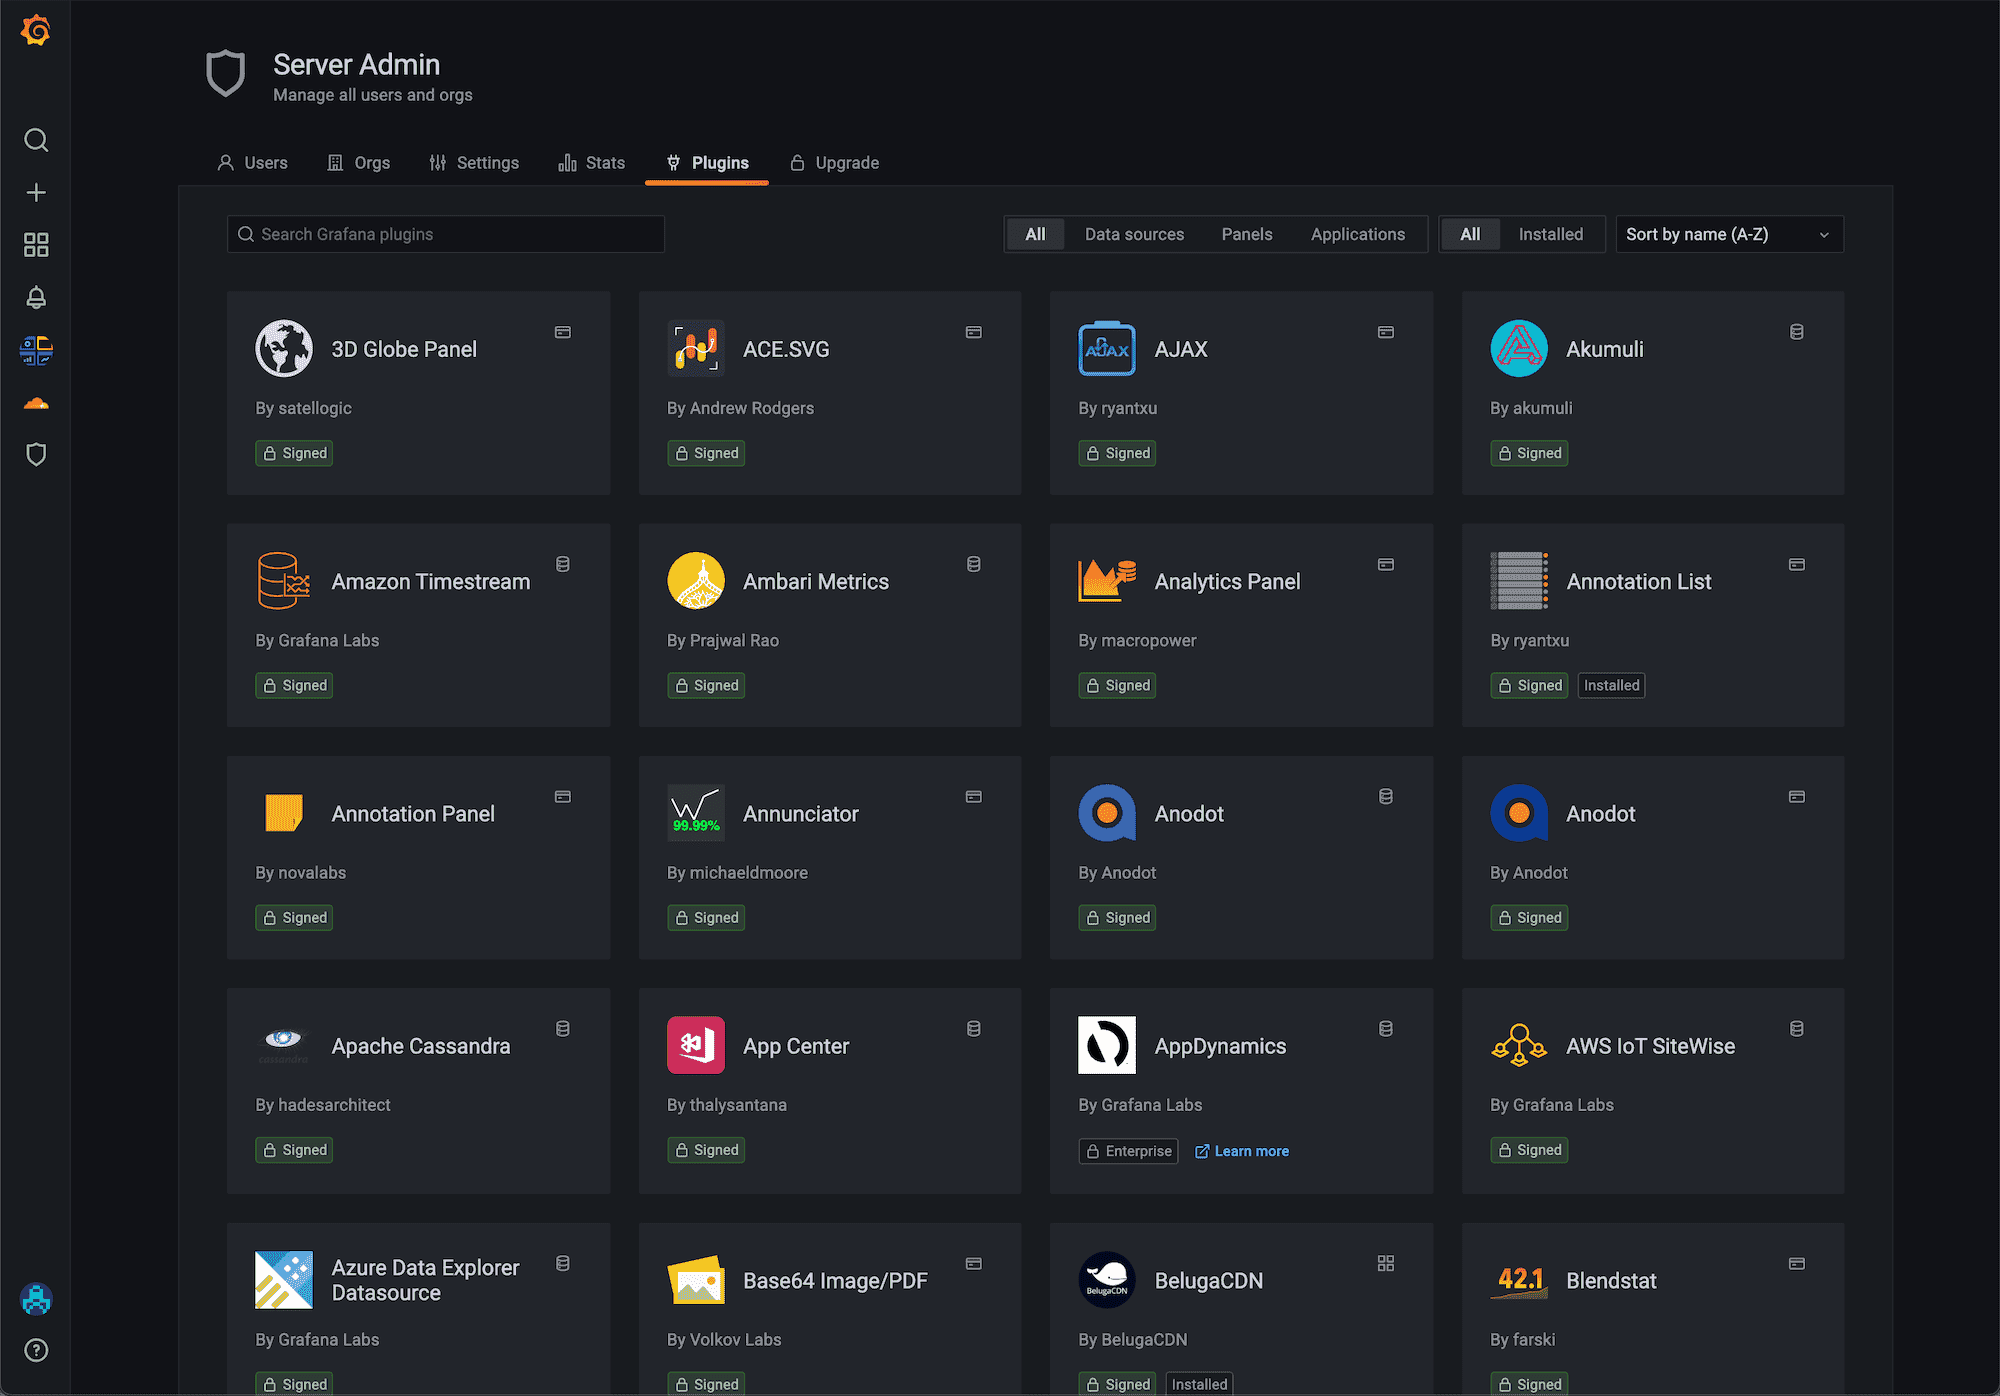
Grafana boasts extensive documentation, a large, engaged community, and a rich ecosystem of plugins and integrations.
Summary
While both have strong support, Grafana edges ahead slightly due to its more extensive ecosystem and community resources.
Grafana vs Prometheus: Conclusion
After this comprehensive comparison, it's clear that Grafana and Prometheus excel in different areas. Prometheus shines in metrics collection and storage, while Grafana dominates in visualization and user experience.
The reality is that these tools are often best used together:
- Use Prometheus for reliable metrics collection and storage
- Leverage Grafana for creating insightful dashboards and unifying data from multiple sources
By combining the strengths of both tools, you can create a powerful, flexible monitoring ecosystem that provides deep insights into your systems' performance and health.
Elevating Monitoring: Uptrace as a Comprehensive Alternative
While Grafana and Prometheus offer robust solutions for monitoring, some organizations may seek a more integrated approach. This is where Uptrace comes into play.
Uptrace provides a unified platform for metrics, logs, and traces, offering:
- Out-of-the-box integration with popular tech stacks
- Advanced visualization capabilities
- Customizable alerting
- Distributed tracing for in-depth performance analysis
Getting Started with Uptrace
To explore how Uptrace can enhance your monitoring and observability:
- Visit uptrace.dev to learn more about the platform.
- Sign up for a free trial to experience Uptrace's capabilities firsthand.
- Check out the documentation for detailed guides on setup and usage.
By considering tools like Uptrace alongside Grafana and Prometheus, you can ensure you're choosing the best solution for your specific monitoring and observability needs.
FAQ
- Can Grafana work without Prometheus? Yes, Grafana can work with many data sources besides Prometheus, including InfluxDB, MySQL, and more.
- Is Prometheus only for container environments? No, Prometheus can monitor any system or application that exposes metrics in a format it understands, including traditional servers and cloud services.
- How do Grafana and Prometheus handle high availability? Both tools offer ways to set up high availability. Prometheus can use tools like Thanos for distributed setups, while Grafana can be run in a clustered configuration.
- Can Grafana alert on data from Prometheus? Yes, Grafana can create alerts based on Prometheus data using its built-in alerting system.
- How does Uptrace compare to the Grafana-Prometheus stack? Uptrace offers an integrated solution for metrics, logs, and traces out-of-the-box, which can be advantageous for organizations looking for a unified observability platform.
You may also be interested in: