Kibana vs Splunk [Detailed Comparison 2025]
Kibana and Splunk are powerful data analytics and log management solutions. However, choosing between them can be challenging due to their distinct features and use cases. This comprehensive comparison will help you make an informed decision for your organization's needs in 2024.
Kibana vs Splunk: Quick Overview
Before we dive into the details, let's take a high-level look at how Kibana and Splunk compare:
| Feature | Kibana | Splunk |
|---|---|---|
| Primary Focus | Data visualization and analytics | Log management and operational intelligence |
| Ecosystem | Part of the Elastic Stack | Standalone platform with extensive ecosystem |
| Pricing | Open-source (free) with paid features | Commercial with tiered pricing |
| Learning Curve | Moderate | Steep |
| Scalability | Highly scalable | Highly scalable |
| Real-time Analysis | Yes | Yes |
| Custom Dashboards | Yes | Yes |
| Search Capabilities | Lucene query syntax | Splunk Processing Language (SPL) |
While this table provides a quick comparison, the real differences lie in the details of how each platform implements these features and the specific strengths they bring to different use cases.
Splunk and Kibana: Detailed Overview
Kibana
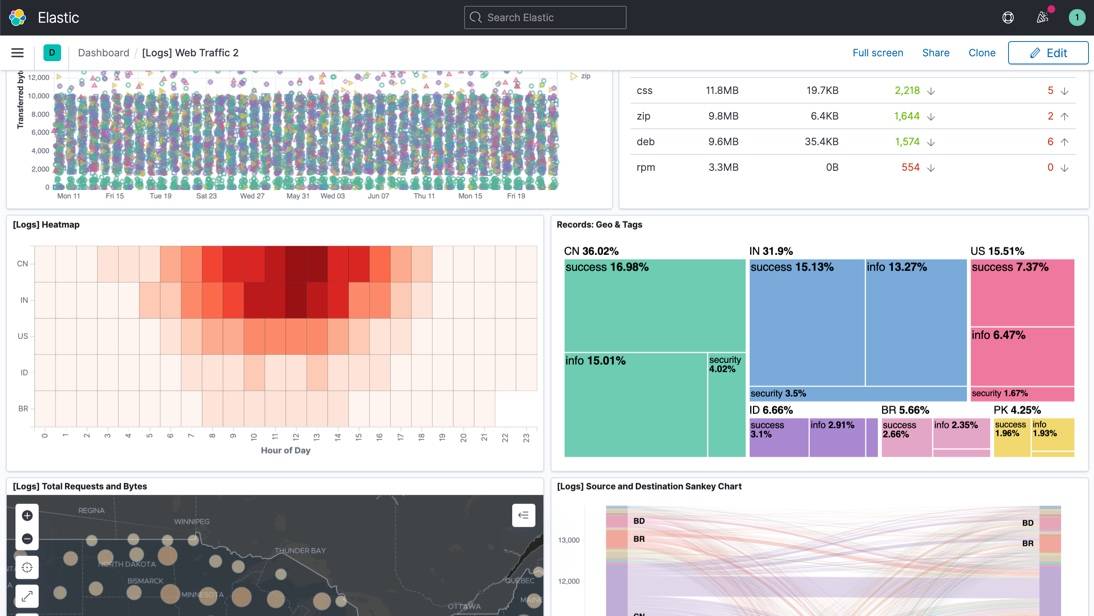
Kibana is an open-source data visualization dashboard for Elasticsearch. It serves as the visualization layer of the Elastic Stack, allowing users to explore, visualize, and share insights from their data stored in Elasticsearch indices.
Key aspects of Kibana include:
- Elasticsearch Integration: Kibana is tightly integrated with Elasticsearch, making it extremely efficient for visualizing and analyzing log data stored in Elasticsearch clusters. This integration allows for near real-time analysis of large datasets.
- Visualization Types: Kibana offers a wide range of visualization options, including line charts, bar charts, pie charts, heat maps, geospatial maps, and more. These visualizations can be combined into powerful dashboards for comprehensive data analysis.
- Discover Feature: The Discover interface in Kibana allows users to interactively explore their data. Users can submit search queries, filter results, and view document data, making it easy to drill down into specific events or logs.
- Machine Learning: With the X-Pack plugin, Kibana offers machine learning capabilities for anomaly detection and forecasting. This can be particularly useful for identifying unusual patterns in your data that might indicate issues or opportunities.
- Extensibility: Kibana is highly extensible, with a plugin architecture that allows developers to add new visualizations, applications, and features to the platform.
Splunk
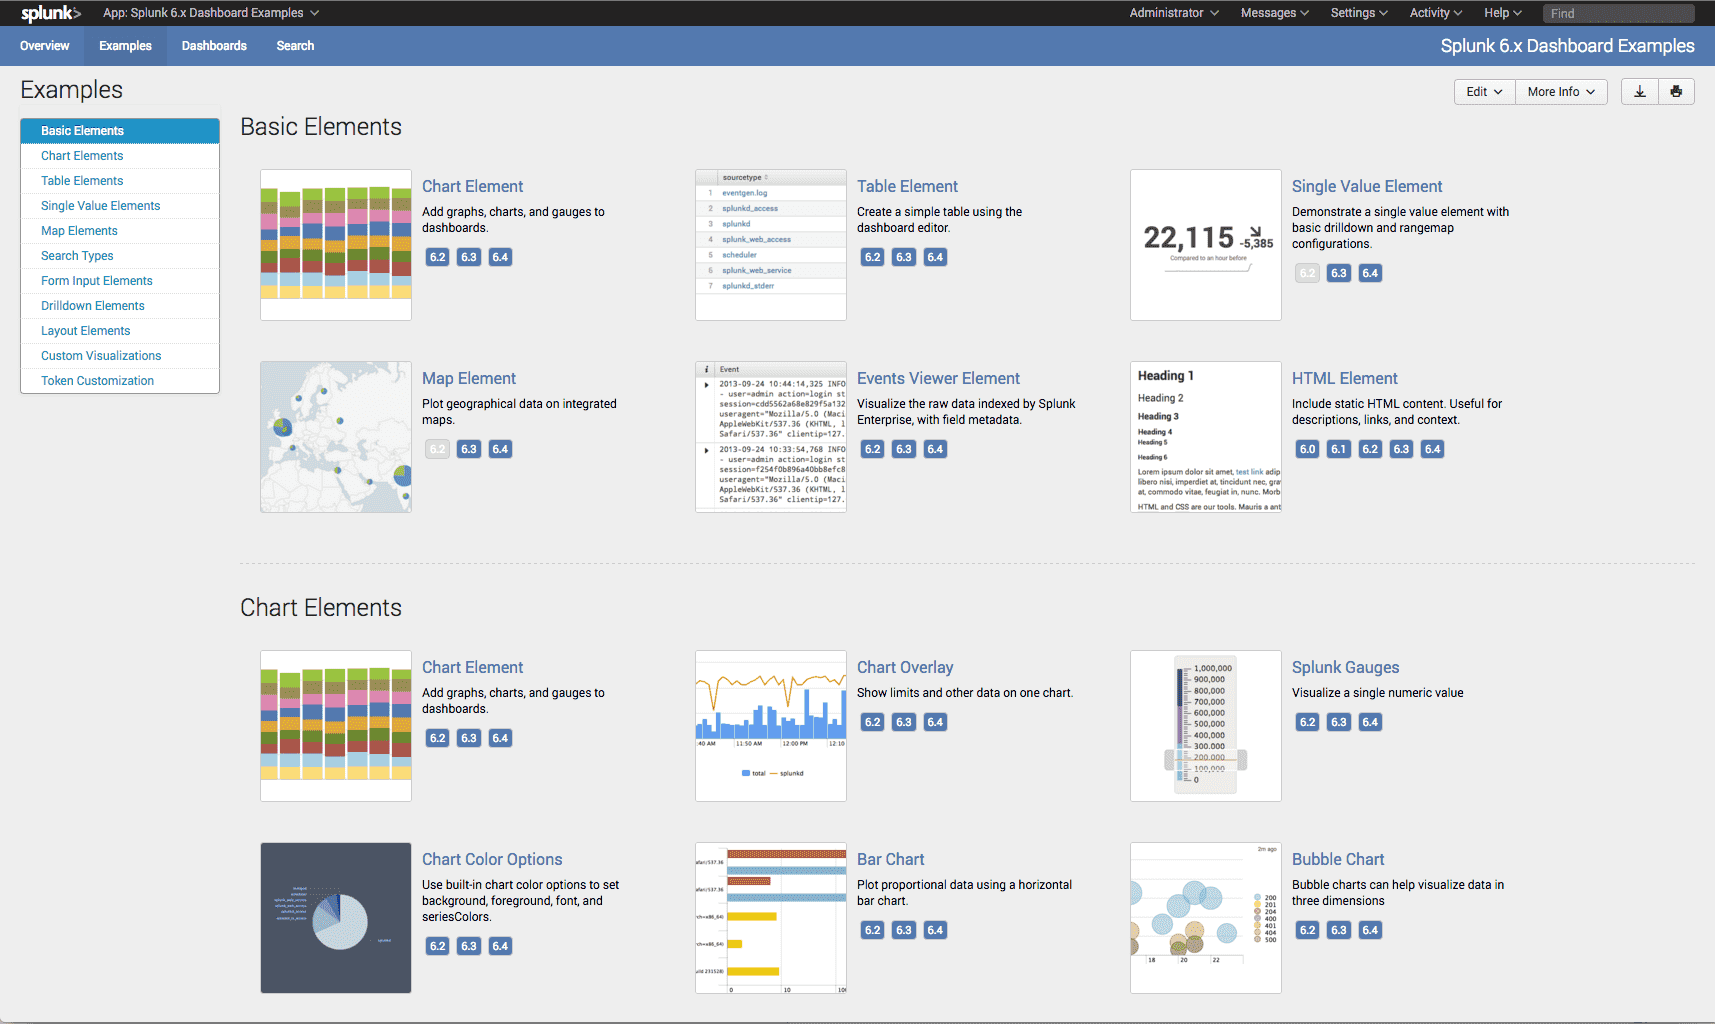
Splunk is a comprehensive software platform designed to search, analyze, and visualize machine-generated data from various sources. It's particularly known for its powerful search capabilities and its ability to handle large volumes of diverse data types.
Key aspects of Splunk include:
- Universal Indexing: Splunk can ingest and index virtually any type of data, regardless of format or source. This makes it extremely versatile for organizations dealing with diverse data types.
- Splunk Processing Language (SPL): SPL is a powerful search processing language that allows users to search and analyze data in sophisticated ways. While it has a steeper learning curve than Kibana's query language, it offers more advanced capabilities for complex data analysis.
- Real-time Monitoring and Alerting: Splunk excels at real-time monitoring of data streams. It can trigger alerts based on complex conditions, making it valuable for IT operations and security use cases.
- App Ecosystem: Splunk has a large ecosystem of apps and add-ons that extend its functionality. These can add specific capabilities for different industries or use cases, such as security information and event management (SIEM) or IT service intelligence.
- Machine Learning and AI: Splunk offers advanced machine learning and artificial intelligence capabilities through its Machine Learning Toolkit and other premium features. These can be used for predictive analytics, anomaly detection, and other advanced use cases.
Key Features of Kibana
Let's explore some of Kibana's key features in more detail:
- Elasticsearch Integration: Kibana's tight integration with Elasticsearch is one of its strongest features. This integration allows for near real-time analysis of data stored in Elasticsearch, making it particularly powerful for log analysis and monitoring use cases. For example, a DevOps team could use Kibana to visualize application logs in real-time, quickly identifying and troubleshooting issues as they arise.
- Visualization Options: Kibana offers a rich set of visualization types that can be combined into powerful dashboards. For instance, a business analyst could create a dashboard that includes a geospatial map showing customer locations, a line chart tracking sales over time, and a pie chart breaking down sales by product category. These visualizations can be easily customized and updated in real-time as new data comes in.
- Timelion: This is a time series data visualizer that allows users to combine totally independent data sources within a single visualization. For example, you could create a chart that compares this year's sales data with last year's, while also overlaying weather data to see if there's a correlation.
- Machine Learning Features: With X-Pack, Kibana offers unsupervised machine learning for anomaly detection. This can be invaluable for identifying unusual patterns in your data. For instance, it could automatically detect and alert on unusual spikes in error rates or unusual patterns in user behavior that might indicate a security threat.
- Lens: Introduced in newer versions of Kibana, Lens is a user-friendly interface for creating visualizations. It uses AI to suggest appropriate visualizations based on the data you're working with, making it easier for non-technical users to create meaningful visualizations.
Key Features of Splunk
Now, let's dive deeper into some of Splunk's standout features:
- Universal Indexing: Splunk's ability to ingest and index almost any type of data is a major strength. Whether you're dealing with structured data from databases, semi-structured data like JSON logs, or completely unstructured data like free-form text, Splunk can handle it. This makes it particularly valuable for organizations with diverse data sources.
- Splunk Processing Language (SPL): SPL is incredibly powerful for complex data analysis. For example, a security analyst could use SPL to write a query that correlates user login events with network traffic data and system configuration changes, potentially identifying sophisticated security threats that would be difficult to detect otherwise.
- Real-time Monitoring and Alerting: Splunk's real-time capabilities make it excellent for operational intelligence. For instance, an e-commerce company could set up Splunk to monitor transaction rates, server response times, and error rates in real-time. If any of these metrics exceed certain thresholds, Splunk can automatically alert the appropriate team, allowing for rapid response to potential issues.
- App Ecosystem: Splunk's app ecosystem greatly extends its functionality. For example, the Splunk App for AWS provides pre-built dashboards and reports for monitoring AWS environments, while the Splunk Security Essentials app provides tools and workflows for common security use cases.
- Machine Learning and AI: Splunk's machine learning capabilities can be used for a wide range of advanced use cases. For example, it could be used to predict equipment failures in a manufacturing environment based on sensor data, or to detect fraudulent transactions in a financial services context by identifying unusual patterns of behavior.
Key Differences: Kibana vs Splunk
While both Kibana and Splunk are powerful tools for data analysis and visualization, they have some key differences that may make one more suitable than the other depending on your specific needs:
- Ecosystem and Integration:
- Kibana is part of the Elastic Stack and is tightly integrated with Elasticsearch. This makes it an excellent choice if you're already using Elasticsearch or if you're primarily dealing with log data.
- Splunk, on the other hand, is a standalone platform that can ingest data from a wide variety of sources. It may be a better choice if you need to analyze data from many different systems and formats.
- Query Language and Complexity:
- Kibana uses Lucene query syntax, which is generally considered easier to learn and use, especially for simple queries.
- Splunk uses its own Splunk Processing Language (SPL), which has a steeper learning curve but offers more power and flexibility for complex queries.
- Use Cases:
- Kibana excels at log analytics and visualizations, particularly when working with Elasticsearch data. It's often used for application monitoring, log analysis, and basic security analytics.
- Splunk is more versatile and is often used for broader operational intelligence, including advanced security analytics, IT operations management, and business analytics across diverse data sources.
- Pricing Model:
- Kibana is open-source and free to use, with paid features available through X-Pack. This can make it more cost-effective for smaller organizations or those with simpler needs.
- Splunk operates on a commercial model with tiered pricing based on data ingestion volume. While it can be more expensive, it may offer more comprehensive features and support for enterprise use cases.
- Scalability and Performance:
- Both Kibana and Splunk are highly scalable, but they approach scalability differently.
- Kibana's scalability is tied to Elasticsearch, which can be horizontally scaled by adding more nodes to the cluster.
- Splunk offers various deployment options, including clustered deployments for high availability and performance, and can handle extremely large data volumes in enterprise settings.
How to Choose?
Choosing between Kibana and Splunk depends on various factors specific to your organization's needs. Here are some key considerations:
- Budget Constraints:
- If cost is a major concern, Kibana's open-source nature may be more appealing.
- However, if you need advanced features and have the budget for it, Splunk's comprehensive platform might provide more value.
- Existing Infrastructure:
- If you're already using Elasticsearch or other parts of the Elastic Stack, Kibana would integrate seamlessly.
- If you have diverse data sources and need a tool that can easily ingest and analyze data from all of them, Splunk might be a better fit.
- Use Cases:
- For primarily log analysis and visualization, especially if your data is already in Elasticsearch, Kibana is an excellent choice.
- For more diverse use cases, including advanced security analytics, IT operations management, and business intelligence across various data types, Splunk's versatility might be more valuable.
- Team Expertise:
- Consider your team's existing skills. If they're already familiar with Elasticsearch and Lucene queries, Kibana might be easier to adopt.
- If you have the resources for more extensive training or your team is comfortable with more complex query languages, Splunk's powerful SPL might be worth the investment.
- Scalability Requirements:
- Both tools are scalable, but in different ways. If your data is primarily in Elasticsearch and you're comfortable managing Elasticsearch clusters, Kibana's scalability model might be more suitable.
- If you need a solution that can scale to handle massive volumes of diverse data types, Splunk's enterprise-grade scalability might be more appropriate.
- Real-time Requirements:
- While both tools offer real-time capabilities, Splunk is often praised for its strong real-time search and alerting features. If real-time operational intelligence is a critical requirement, Splunk might have an edge.
- Customization and Extensibility:
- If you need a highly customizable platform and have the development resources to extend the tool's capabilities, both Kibana and Splunk offer extensibility options.
- Kibana's open-source nature might make it easier for some organizations to customize, while Splunk's extensive app ecosystem might provide the extensions you need without custom development.
Remember, the best choice depends on your specific circumstances. It's often helpful to run a proof of concept with both tools using your actual data and use cases before making a final decision.
Why Uptrace could be an alternative to Kibana and Splunk
While Kibana and Splunk are powerful tools, they may not be the ideal solution for every organization. This is where Uptrace comes in as a compelling alternative, offering a balance of features, ease of use, and cost-effectiveness.
Introduction to Uptrace and its benefits
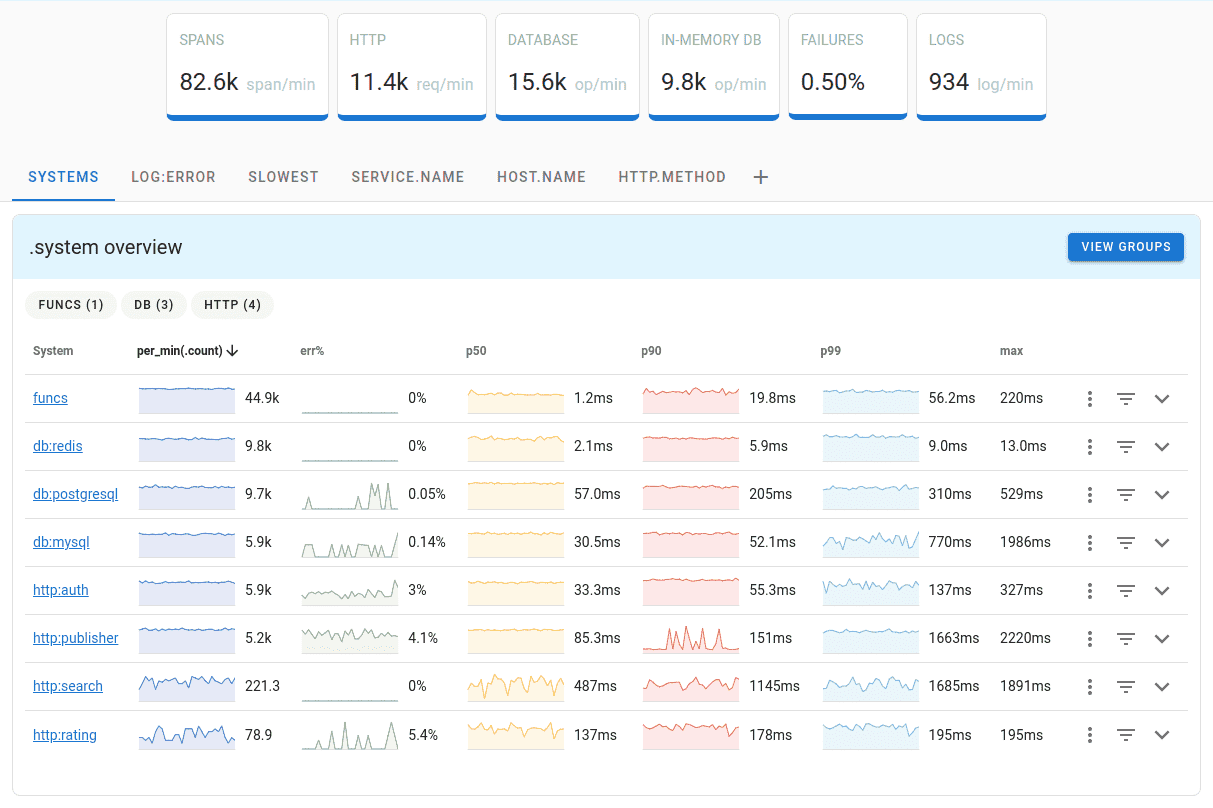
Uptrace is an open-source APM (Application Performance Monitoring) tool that combines many of the strengths of both Kibana and Splunk, while focusing on simplicity and ease of use. Here are some key benefits of Uptrace
- Open-source and Free. Like Kibana, Uptrace is open-source and free to use. This makes it an attractive option for organizations looking to minimize costs while still getting powerful analytics capabilities.
- Unified Observability. Uptrace provides a unified platform for metrics, logs, and traces. This integrated approach can simplify the monitoring and troubleshooting process, allowing you to correlate different types of data easily.
- Scalability. Designed to handle large volumes of data, Uptrace can scale with your organization's growth. It uses ClickHouse as its backend database, known for its high performance with large datasets.
- User-friendly Interface. Uptrace offers an intuitive interface that makes it easy for both technical and non-technical users to create visualizations and dashboards.
- OpenTelemetry Integration. Uptrace is built with OpenTelemetry support, making it easy to integrate with a wide range of systems and applications.
Getting started with Uptrace
One of the advantages of Uptrace is how easy it is to get started. Here are a few ways to try it out
- Cloud Demo. Visit the cloud demo to get a feel for Uptrace's interface and capabilities. No login is required, allowing you to quickly explore the tool.
- Local Docker. Installation For a more hands-on experience, you can run Uptrace locally using Docker. Instructions are available in the Uptrace Docker repository.
- Explore the Source Code. As an open-source project, you can dive into Uptrace's source code on GitHub. This can be particularly useful if you're considering customizing the tool for your specific needs.
Uptrace offers a compelling middle ground between the visualization prowess of Kibana and the powerful data analysis capabilities of Splunk. Its focus on simplicity and ease of use, combined with its open-source nature, makes it an attractive option for organizations looking for a cost-effective, yet powerful observability solution.
Conclusion
Choosing the right tool for log analysis and data visualization is a crucial decision that can significantly impact your organization's ability to derive insights from its data. Kibana, with its tight integration with Elasticsearch and powerful visualization capabilities, excels in log analytics and is a great choice for organizations already invested in the Elastic Stack. Splunk, with its versatility and powerful search capabilities, is well-suited for diverse data sources and complex operational intelligence needs.
However, don't overlook alternatives like Uptrace, which can offer a balance of features, ease of use, and cost-effectiveness. As with any major technology decision, it's important to carefully evaluate your specific needs, conduct thorough testing, and consider factors like budget, existing infrastructure, and team expertise before making a choice.
Remember, the goal is not just to choose a tool, but to empower your team to turn data into actionable insights that drive your business forward. Whether you choose Kibana, Splunk, Uptrace, or another solution, the key is to leverage these powerful tools to unlock the full potential of your data.
FAQ
- Which is more cost-effective: Kibana or Splunk? Kibana is generally more cost-effective as it's open-source with optional paid features through X-Pack. Splunk operates on a commercial model with pricing based on data ingestion volume, making it potentially more expensive for large-scale deployments.
- How do the learning curves compare between Kibana and Splunk? Kibana has a moderate learning curve with its Lucene query syntax, making it easier to learn for beginners. Splunk has a steeper learning curve due to its proprietary Splunk Processing Language (SPL), but offers more advanced capabilities once mastered.
- Can I use both tools in my organization? Yes, many organizations use both tools for different purposes. Kibana might be used for log analytics and basic visualizations, while Splunk could be employed for more complex operational intelligence and security analytics.
- Which tool is better for real-time monitoring? Both tools offer real-time capabilities, but Splunk is often preferred for real-time operational intelligence due to its powerful search and alerting features. However, Kibana with Elasticsearch can also provide effective real-time monitoring, especially for log data.
- How do they handle data scalability? Both tools are highly scalable but approach it differently. Kibana scales through Elasticsearch clusters, while Splunk offers various deployment options for enterprise-scale operations. Both can handle large data volumes, but implementation costs and complexity may differ.
- What about security features? Splunk offers more comprehensive security features out of the box and is often used for security operations centers (SOCs). Kibana can provide security features through X-Pack and the Elastic Security solution, but may require additional configuration.
- Is Uptrace a viable alternative to both? Yes, Uptrace offers a balanced alternative with unified observability for metrics, logs, and traces. It's open-source, cost-effective, and provides an intuitive interface with OpenTelemetry integration, making it suitable for organizations seeking a middle ground between Kibana and Splunk.
- Which tool is better for custom dashboards? Both tools offer robust dashboard capabilities. Kibana excels in creating visualizations for Elasticsearch data, while Splunk offers more flexibility in data sources and complex analysis. The choice depends on your specific data sources and visualization needs.
You may also be interested in: