Top Infrastructure Monitoring Tools & Software Solutions 2026
Efficient monitoring tools are crucial for maintaining the performance, security, and reliability of your infrastructure. This guide covers the best infrastructure monitoring tools and software solutions, offering insights into their features, benefits, and use cases to help you choose the right monitoring system for your IT environment in 2026.
What is Infrastructure Monitoring?
Infrastructure monitoring is the systematic practice of continuously observing, tracking, and analyzing the performance, availability, and health of IT infrastructure components including servers, networks, applications, databases, and cloud services. Unlike application performance monitoring (APM) which focuses on software-level metrics, infrastructure monitoring examines the underlying technology foundation that powers business applications.
Key components of infrastructure monitoring include:
- Server monitoring: CPU usage, memory utilization, disk performance, and system processes
- Network monitoring: Bandwidth usage, latency, packet loss, and device status
- Cloud infrastructure monitoring: Resource utilization, service availability, and cost optimization
- Database monitoring: Query performance, transaction rates, and storage utilization
- Security monitoring: Intrusion detection, vulnerability scans, and compliance tracking
Effective infrastructure monitoring enables IT teams to detect issues early, resolve problems quickly, prevent potential outages, and maintain optimal system performance. This proactive approach ensures seamless operations and positive user experiences while minimizing downtime costs.
For a comprehensive understanding of infrastructure monitoring concepts, implementation strategies, and best practices, see our detailed guide to infrastructure monitoring.
Infrastructure Monitoring Tools
| Tool | Category | Best For | Scale | Pricing | Deployment |
|---|---|---|---|---|---|
| Uptrace | Observability | Distributed systems | Any | Open Source | Cloud/On-Premise |
| Dynatrace | Full-Stack | Enterprise AI observability | Enterprise | Custom | Cloud/On-Premise |
| Middleware | Infrastructure | Real-time monitoring | SMB–Enterprise | Paid | Cloud |
| Datadog | Full-Stack | Large enterprises | Enterprise | Paid | Cloud |
| Nagios | Infrastructure | Custom monitoring | SMB–Enterprise | Free/Paid | On-Premise |
| Zabbix | Infrastructure | Scalable open source | SMB–Enterprise | Free | On-Premise |
| SolarWinds NPM | Network | Network performance | Enterprise | Paid | On-Premise |
| PRTG | All-in-One | Small-medium business | SMB | Paid | On-Premise |
| Splunk | Log Analysis | Security/Compliance | Enterprise | Paid | Cloud/On-Premise |
| Prometheus | Metrics | Cloud-native stacks | Cloud-Native | Free | On-Premise |
| New Relic | APM | Application performance | Any | Paid | Cloud |
| Grafana | Visualization | Dashboard creation | Any | Free | On-Premise |
| Site24x7 | All-in-One | SMB & MSP | SMB–Enterprise | Paid | Cloud |
IT Infrastructure Monitoring Platforms
Comprehensive IT infrastructure monitoring platforms provide unified visibility across all infrastructure components, combining server monitoring, network monitoring, application monitoring, and cloud monitoring capabilities in a single solution. These platforms are designed to eliminate monitoring silos and provide holistic infrastructure observability.
Key characteristics of IT infrastructure monitoring platforms include:
- Centralized dashboards and reporting
- Cross-component correlation and analysis
- Unified alerting and incident management
- Integration with ITSM and DevOps tools
- Scalable architecture for enterprise environments
Uptrace
Uptrace is a modern observability platform built on ClickHouse, designed for monitoring and observability of complex IT infrastructures. OpenTelemetry-native architecture means no proprietary agents — any OTel-compatible SDK feeds data directly into traces, metrics, and logs in a unified interface.
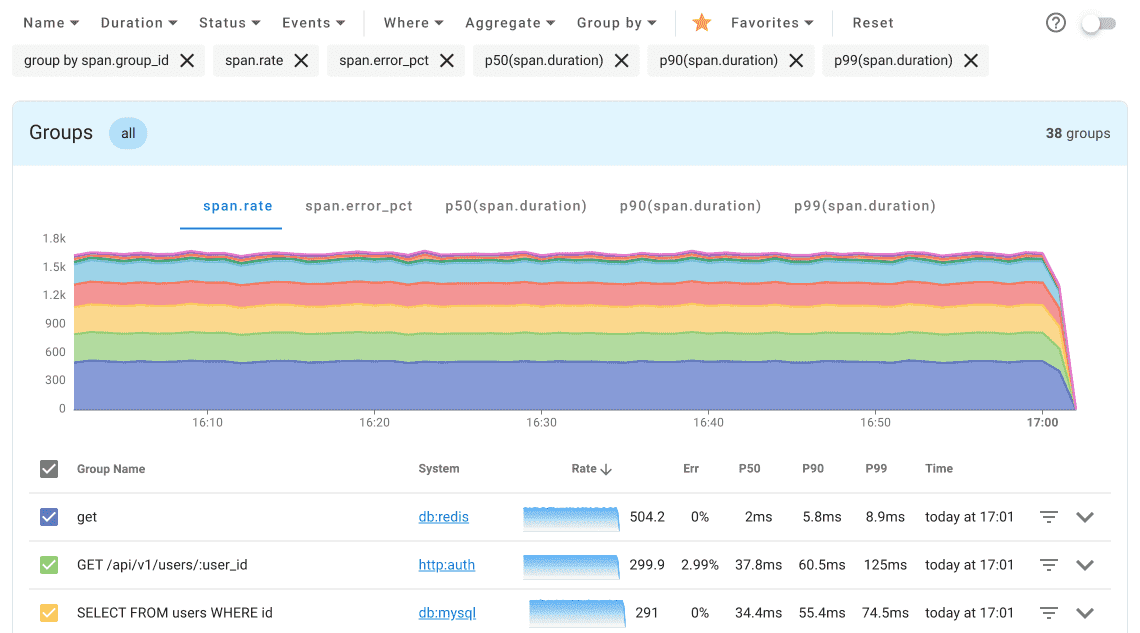
Features:
- Distributed tracing with advanced visualization and ClickHouse-backed fast queries
- Unified traces, metrics, and logs in a single platform — no separate tools required
- Real-time monitoring with customizable dashboards and alerting
- OpenTelemetry-native: no vendor SDK, works with any OTel instrumentation
Pricing: Free self-hosted (open-source, AGPL); cloud from $30/month
Best for: Engineering teams needing full-stack observability at predictable cost — no per-host or per-user fees
Discover observability platforms for unified monitoring approaches.
Dynatrace
Dynatrace is an enterprise-grade observability platform built around its Davis AI engine, which automatically discovers infrastructure components, maps dependencies, and identifies root causes without requiring manual correlation rules.
Features:
- Automatic infrastructure discovery and topology mapping via OneAgent — no manual configuration
- Davis AI: automated root cause analysis correlating infrastructure events, application behavior, and user experience in a single causal chain
- Full-stack visibility across hosts, containers, Kubernetes clusters, cloud services, and processes
- Smart alerting that groups related problems and suppresses noise, surfacing only actionable incidents
Pricing: Custom enterprise pricing; 15-day free trial available
Best for: Large enterprises running complex hybrid cloud environments where manual correlation is impractical
Server Monitoring Tools & Software
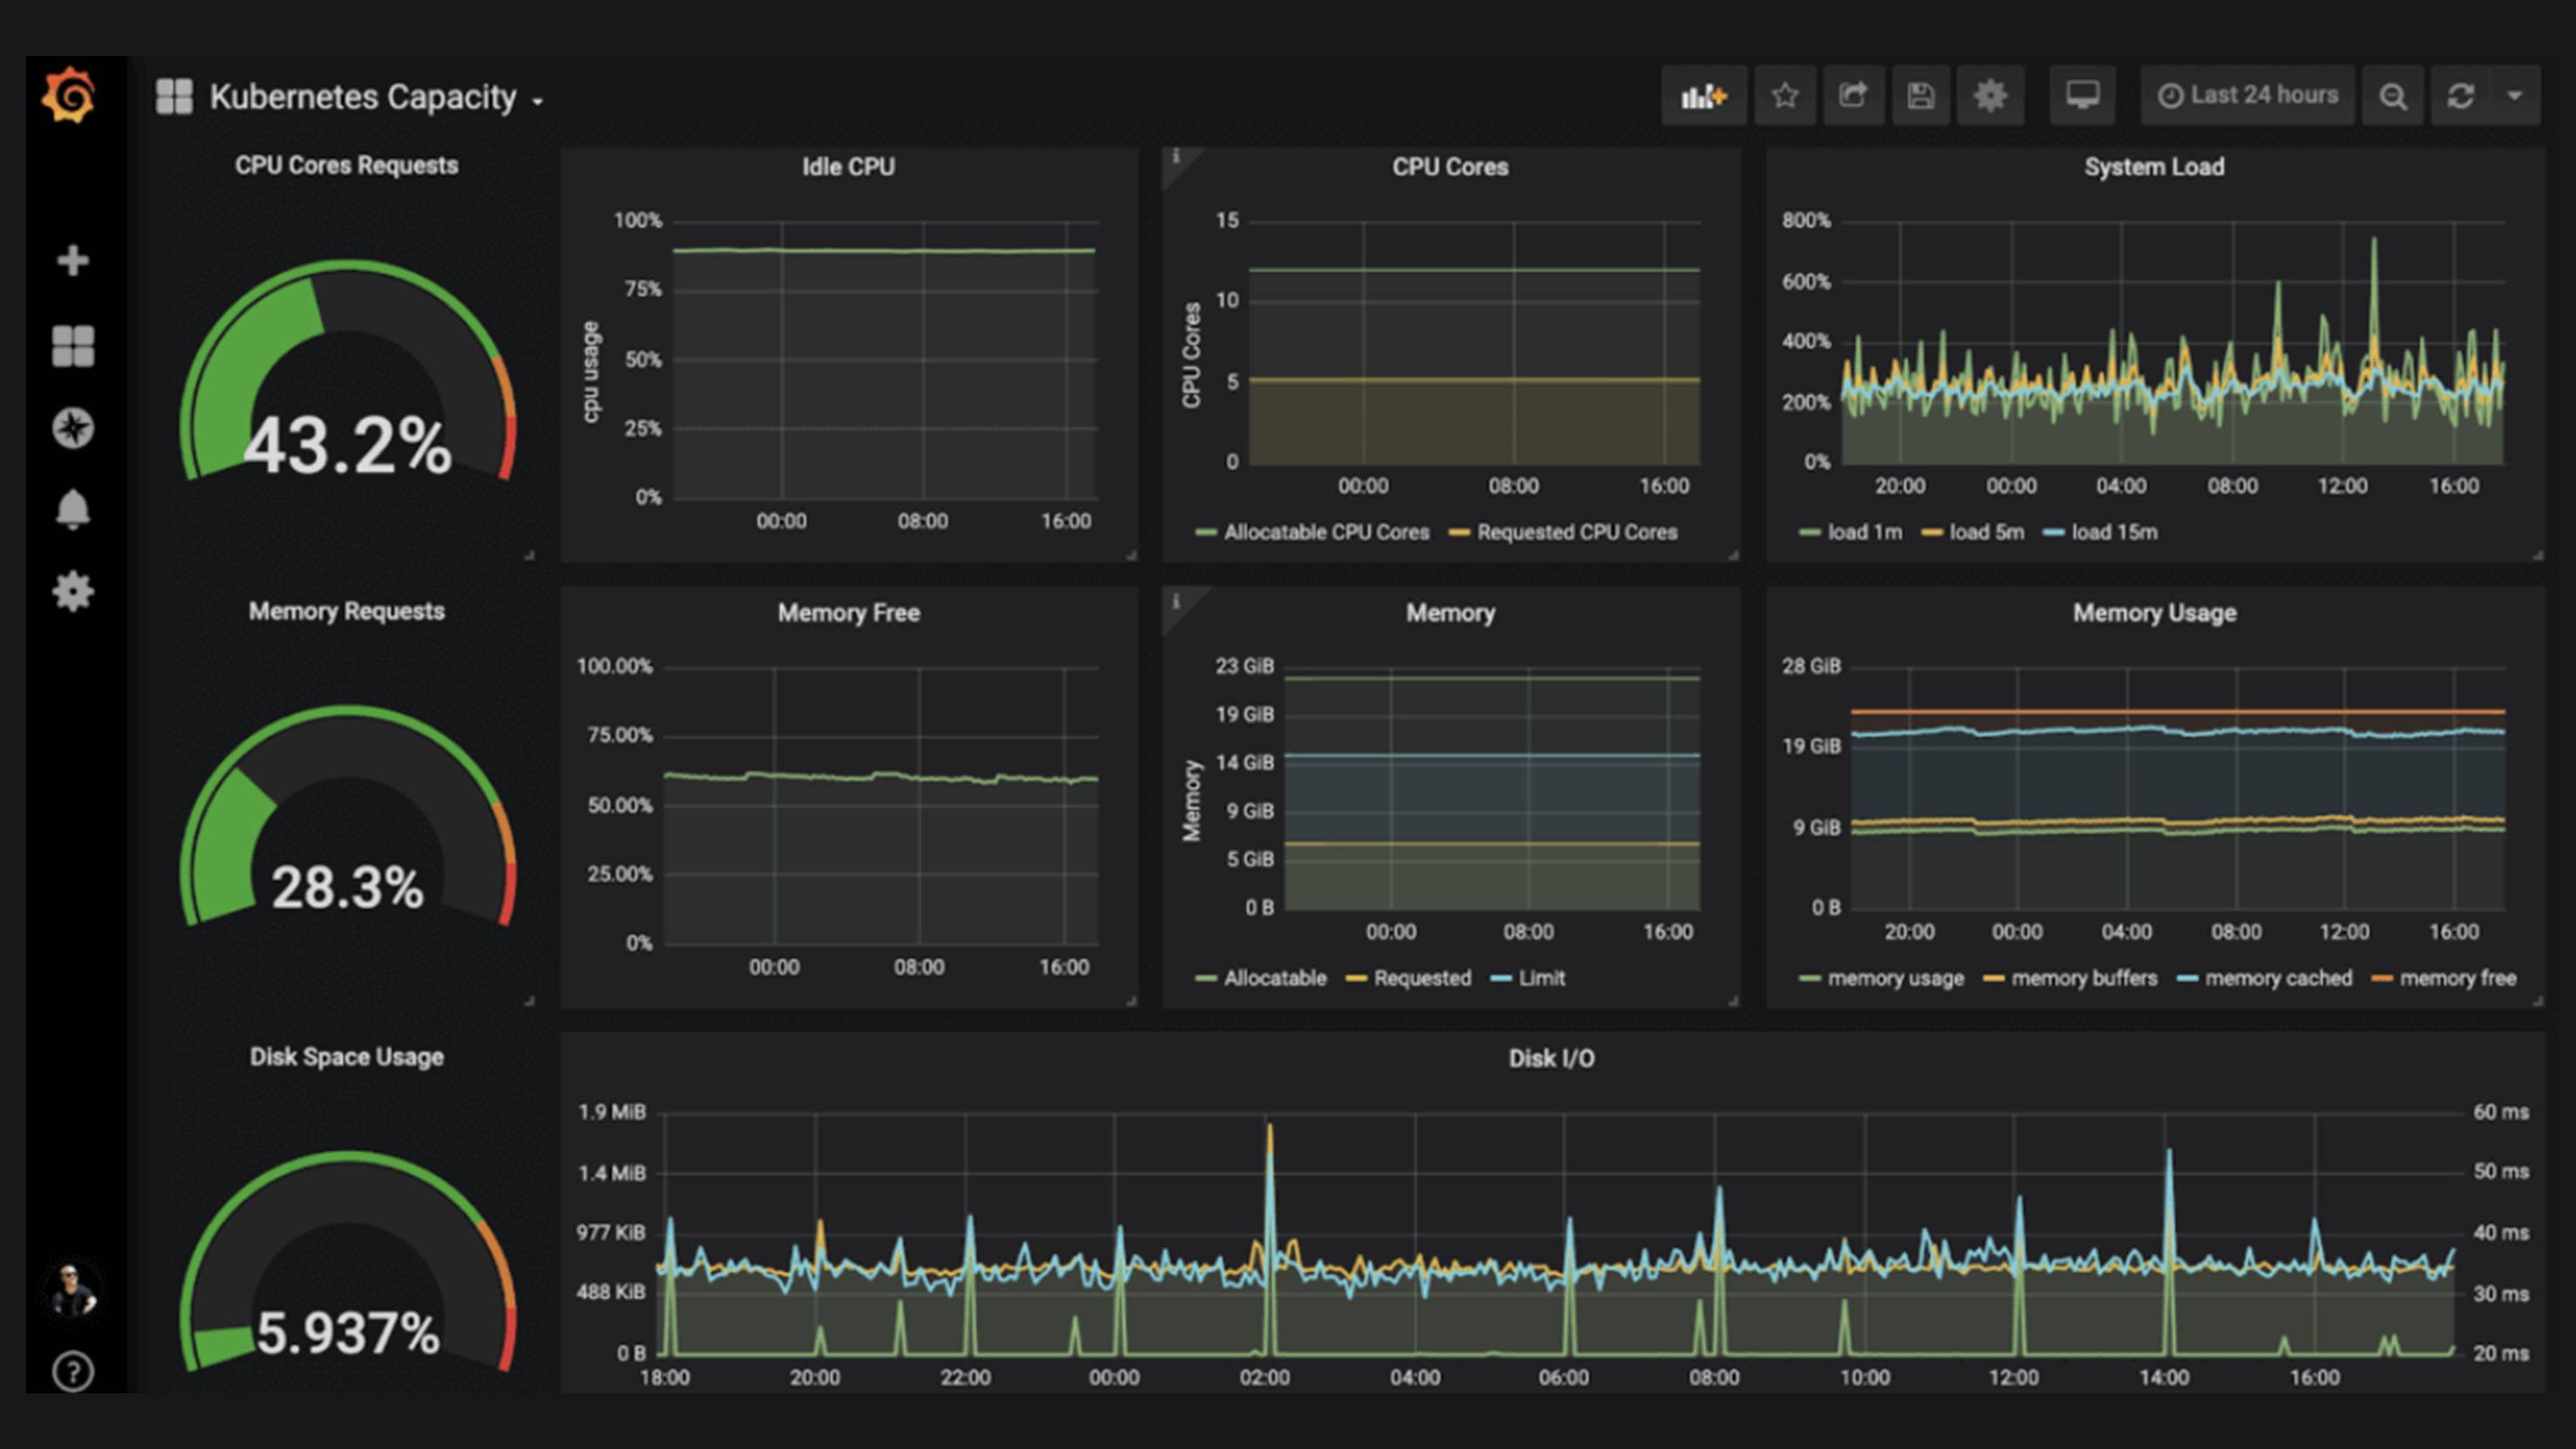
Server monitoring software focuses on tracking the health and performance of physical and virtual servers, including CPU usage, memory consumption, disk space, and system processes. These monitoring tools help prevent downtime by alerting administrators to potential hardware failures or resource exhaustion before they impact users.
Modern server monitoring solutions provide comprehensive visibility into server performance metrics, automated alerting capabilities, and detailed reporting for capacity planning and troubleshooting.
Zabbix
Zabbix is a powerful open-source monitoring tool that offers robust features for monitoring and managing IT infrastructure, particularly excelling in server monitoring scenarios.
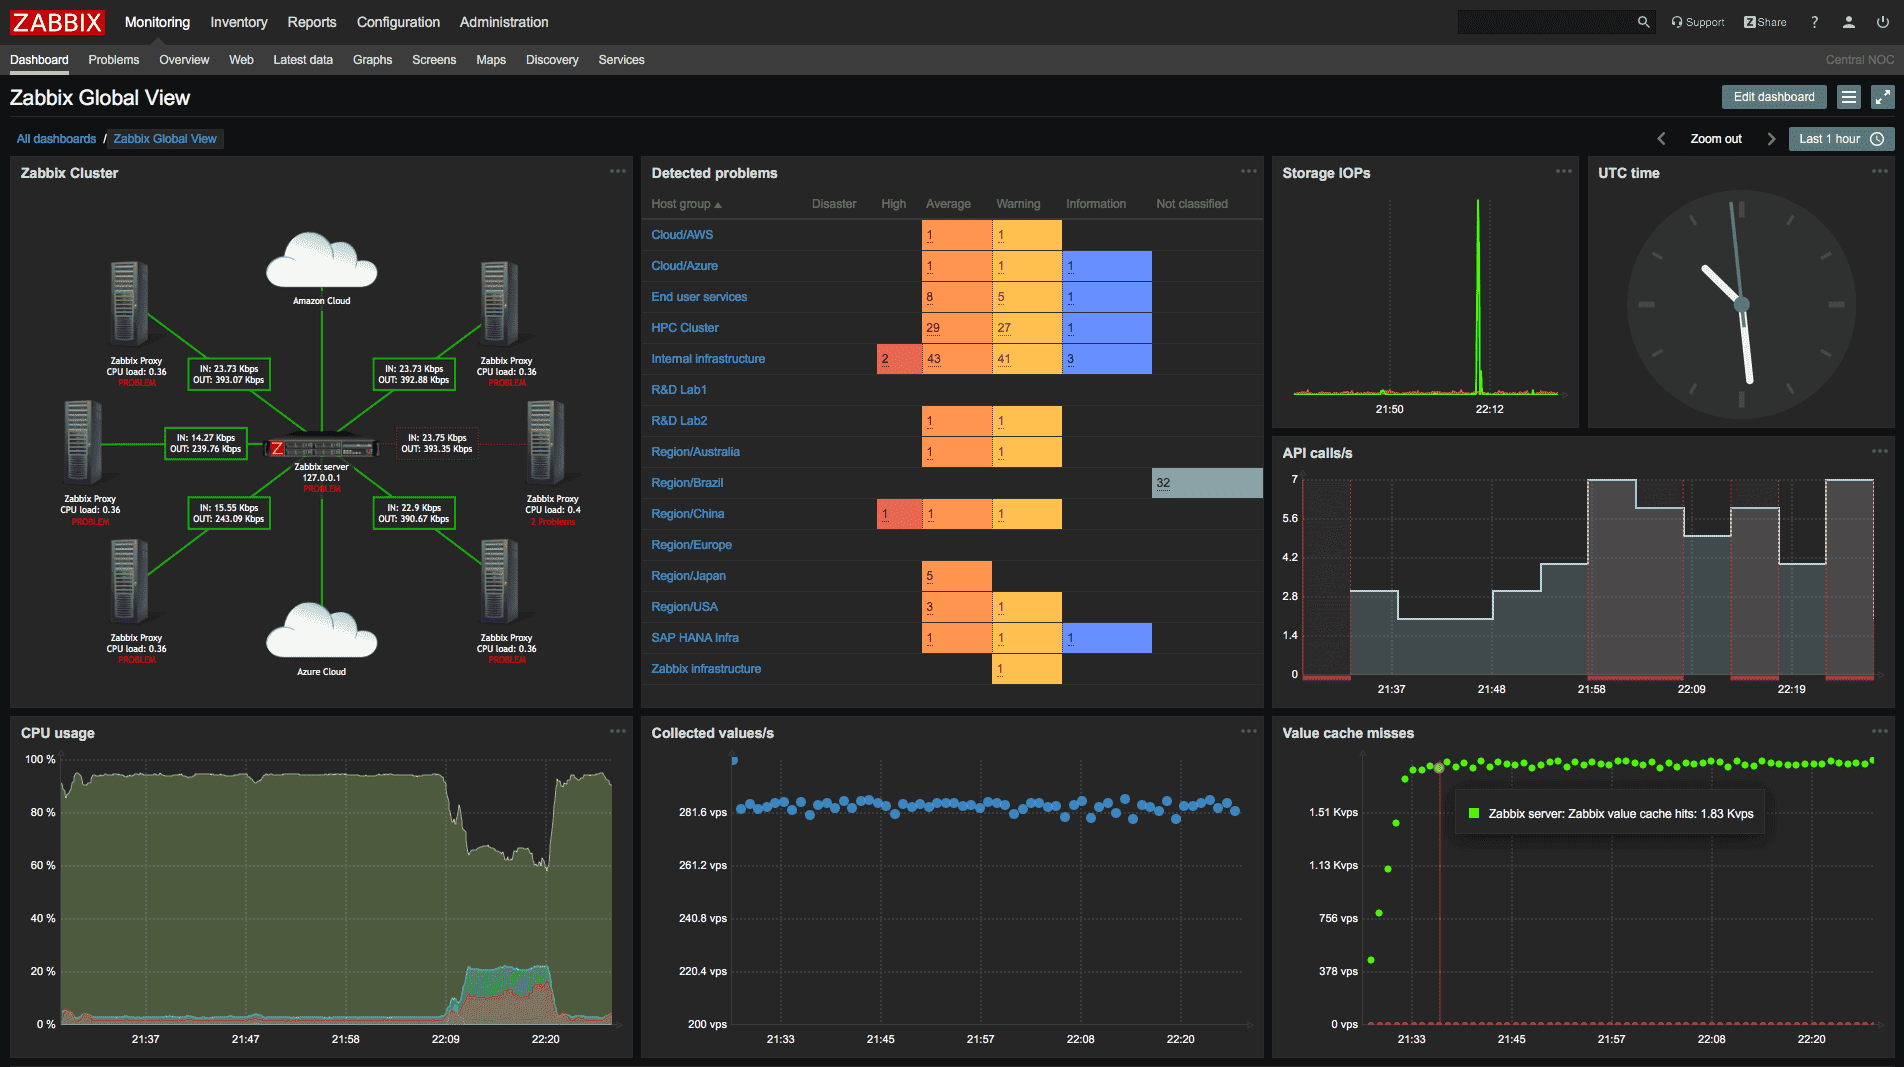
Features:
- Agent-based and agentless monitoring for servers, VMs, and network devices
- Scalability for large environments with distributed monitoring proxies
- Advanced visualization with customizable dashboards and maps
- Intelligent alerting with auto-remediation action triggers
Pricing: Free (open-source core); commercial support available
Best for: Medium to large enterprises seeking a free, scalable monitoring solution without licensing costs
PRTG Network Monitor
PRTG Network Monitor by Paessler is an all-in-one monitoring solution designed to monitor various aspects of IT infrastructure, with strong server monitoring capabilities.
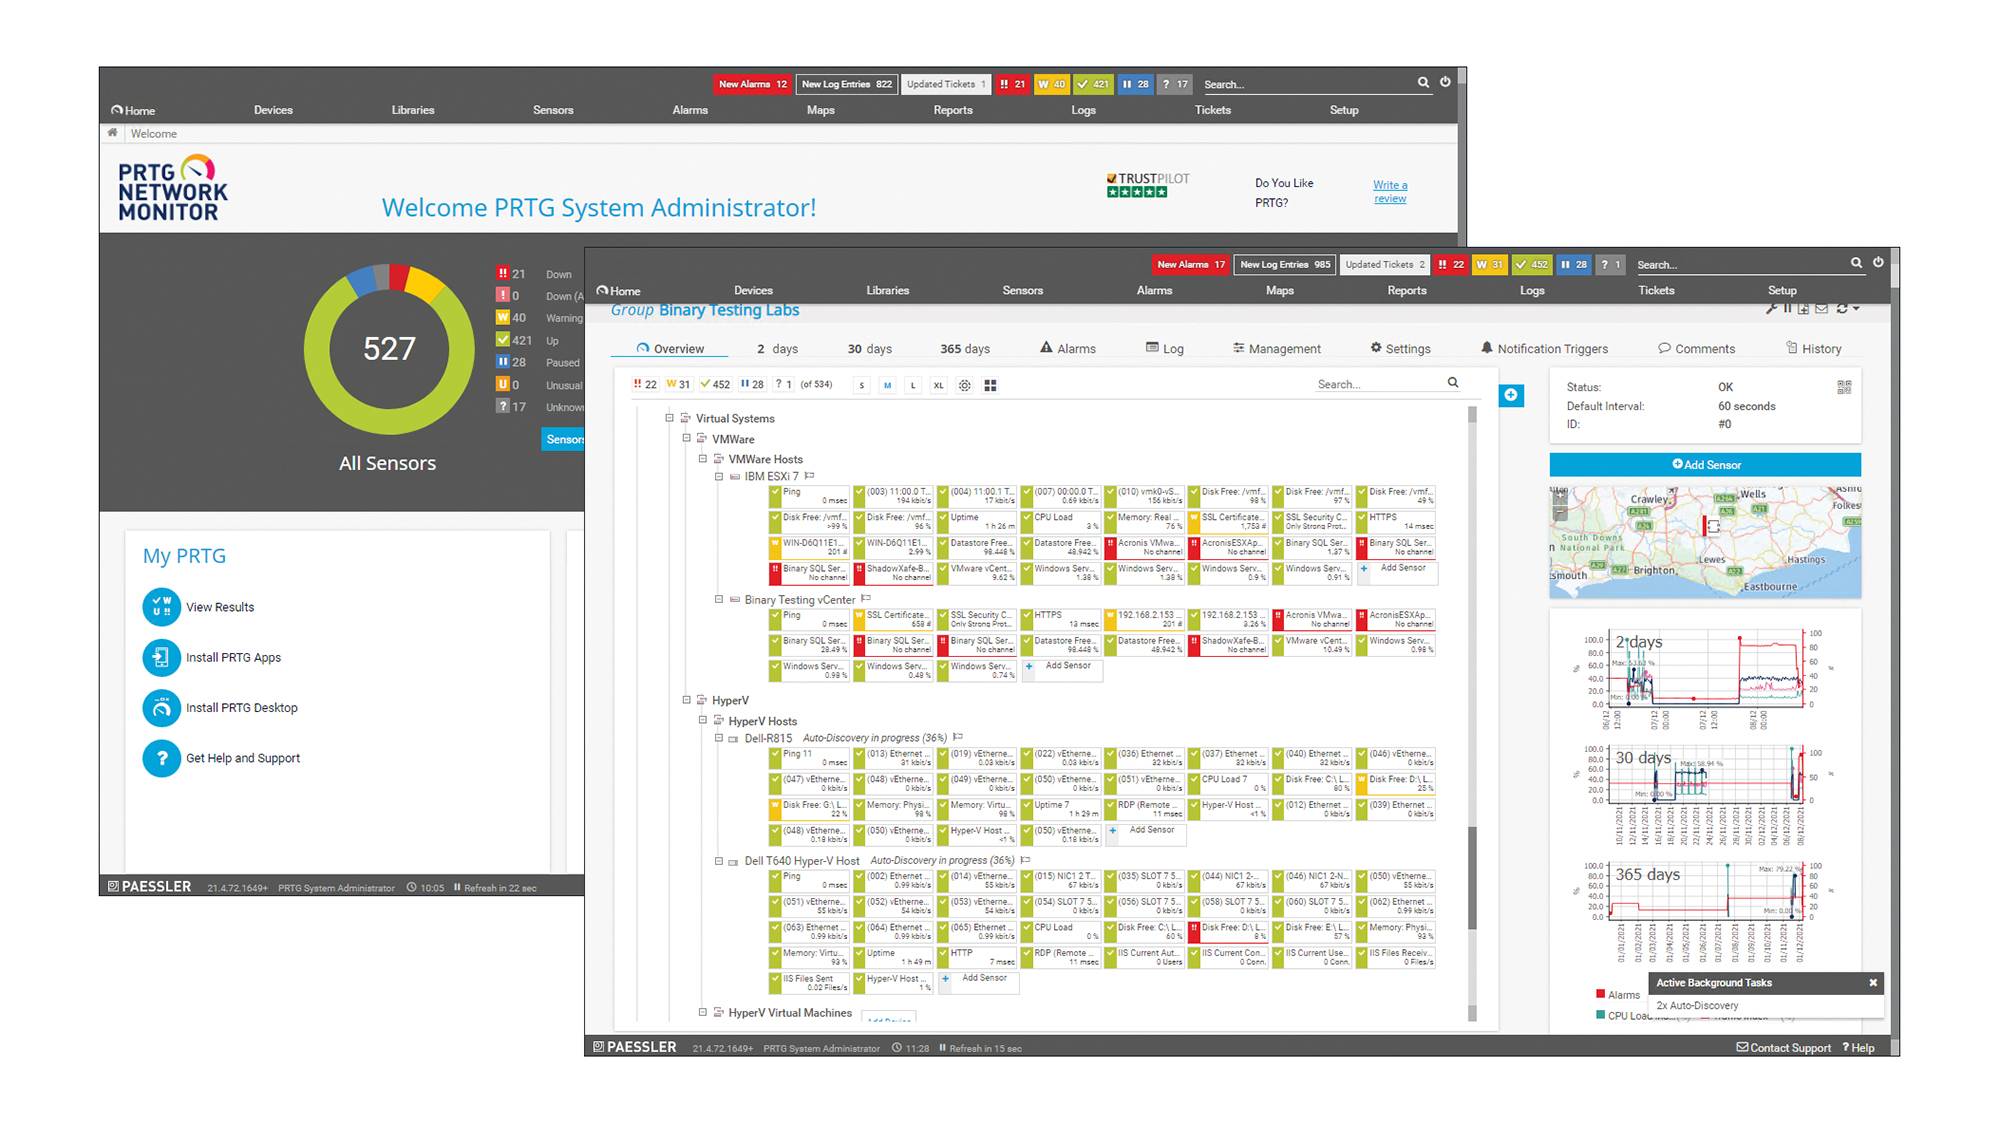
Features:
- Multi-faceted monitoring for servers, networks, and applications via 250+ sensor types
- Easy-to-use web-based interface with minimal setup and configuration
- Scalable with clustering and failover options
- Customizable alerts and notifications across email, SMS, push, and integrations
Pricing: Free up to 100 sensors; paid subscriptions from $200/month billed annually (PRTG 500)
Best for: Small-to-medium businesses wanting comprehensive, easy-to-deploy monitoring without significant configuration overhead
Cloud Monitoring Solutions
Cloud monitoring tools provide visibility into cloud-based infrastructure, tracking resource utilization, service availability, and cost optimization across multiple cloud providers. These solutions are essential for managing dynamic, scalable cloud environments and differ from traditional monitoring by offering features like auto-discovery, API integration with cloud providers, and support for containerized applications.
Cloud infrastructure monitoring addresses unique challenges such as:
- Dynamic resource scaling and allocation
- Multi-region performance monitoring
- Cloud-specific cost optimization
- Integration with cloud-native services
- Container and orchestration platform monitoring
Datadog
DataDog is a cloud-based monitoring and analytics platform designed for IT and DevOps teams. It offers comprehensive monitoring solutions for infrastructure, applications, logs, and more.
Features:
- Real-time monitoring with customizable dashboards across metrics, logs, and traces
- Seamless integration with 450+ technologies and cloud providers
- Machine learning-based anomaly detection and automated alerting
- Distributed tracing and APM with unified correlation across the full stack
Pricing: Free tier for up to 5 hosts; Pro from $15/host/month, Enterprise from $23/host/month
Best for: Large-scale enterprises running complex cloud or multi-cloud environments that need unified visibility across the entire stack
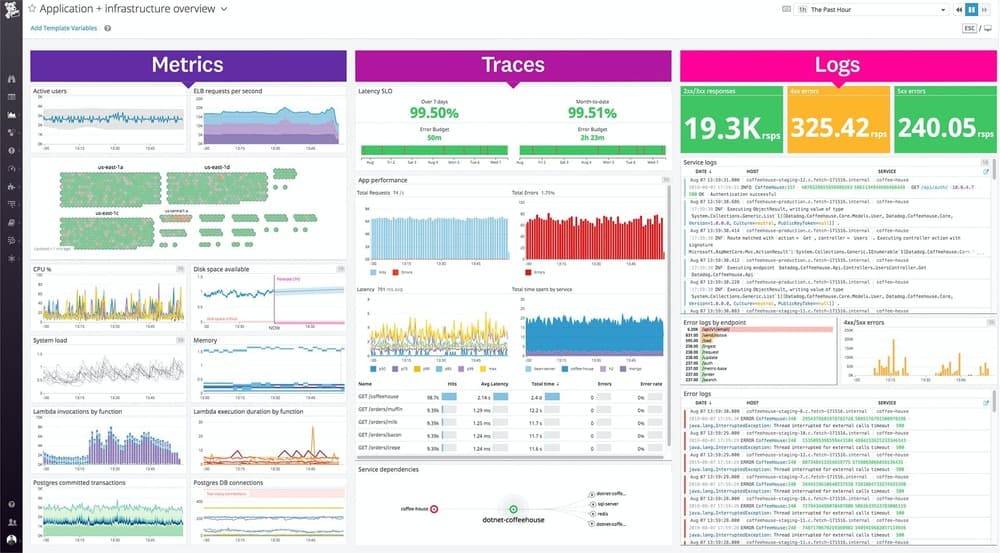
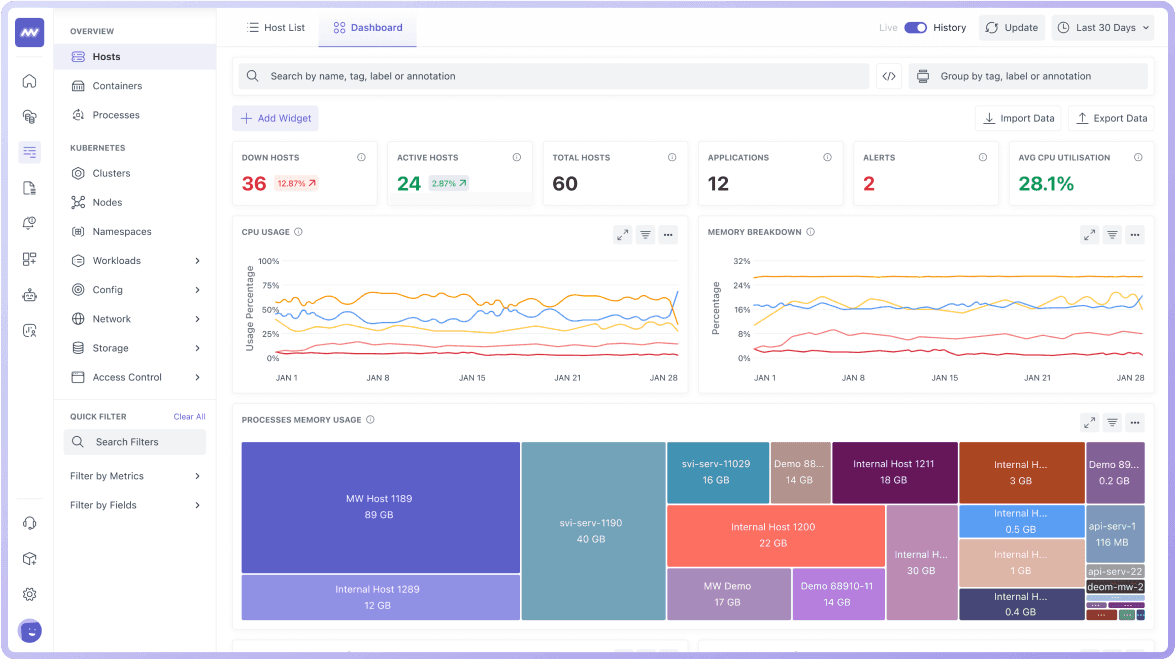
Middleware
Middleware Infrastructure Monitoring is a comprehensive solution that provides real-time visibility into your infrastructure's performance across various environments, operating systems, and orchestration tools.
Features:
- Real-time metrics including CPU utilization, memory usage, and resource status across thousands of data points
- One-click correlation of metrics, traces, and logs for efficient root cause analysis
- Customizable dashboards for VMs, on-premises servers, containers, and cloud-hosted machines
- Kubernetes cluster, node, and pod monitoring with default dashboards and drill-down capabilities
Pricing: Paid plans; contact for current pricing
Best for: Organizations with hybrid infrastructure requiring comprehensive visibility and customizable monitoring across all system types
Site24x7
Site24x7 is a cloud-based monitoring platform from Zoho Corporation that covers infrastructure, applications, networks, and real user monitoring in a single SaaS solution. Particularly popular with SMBs and MSPs for its breadth of coverage and affordable pricing.
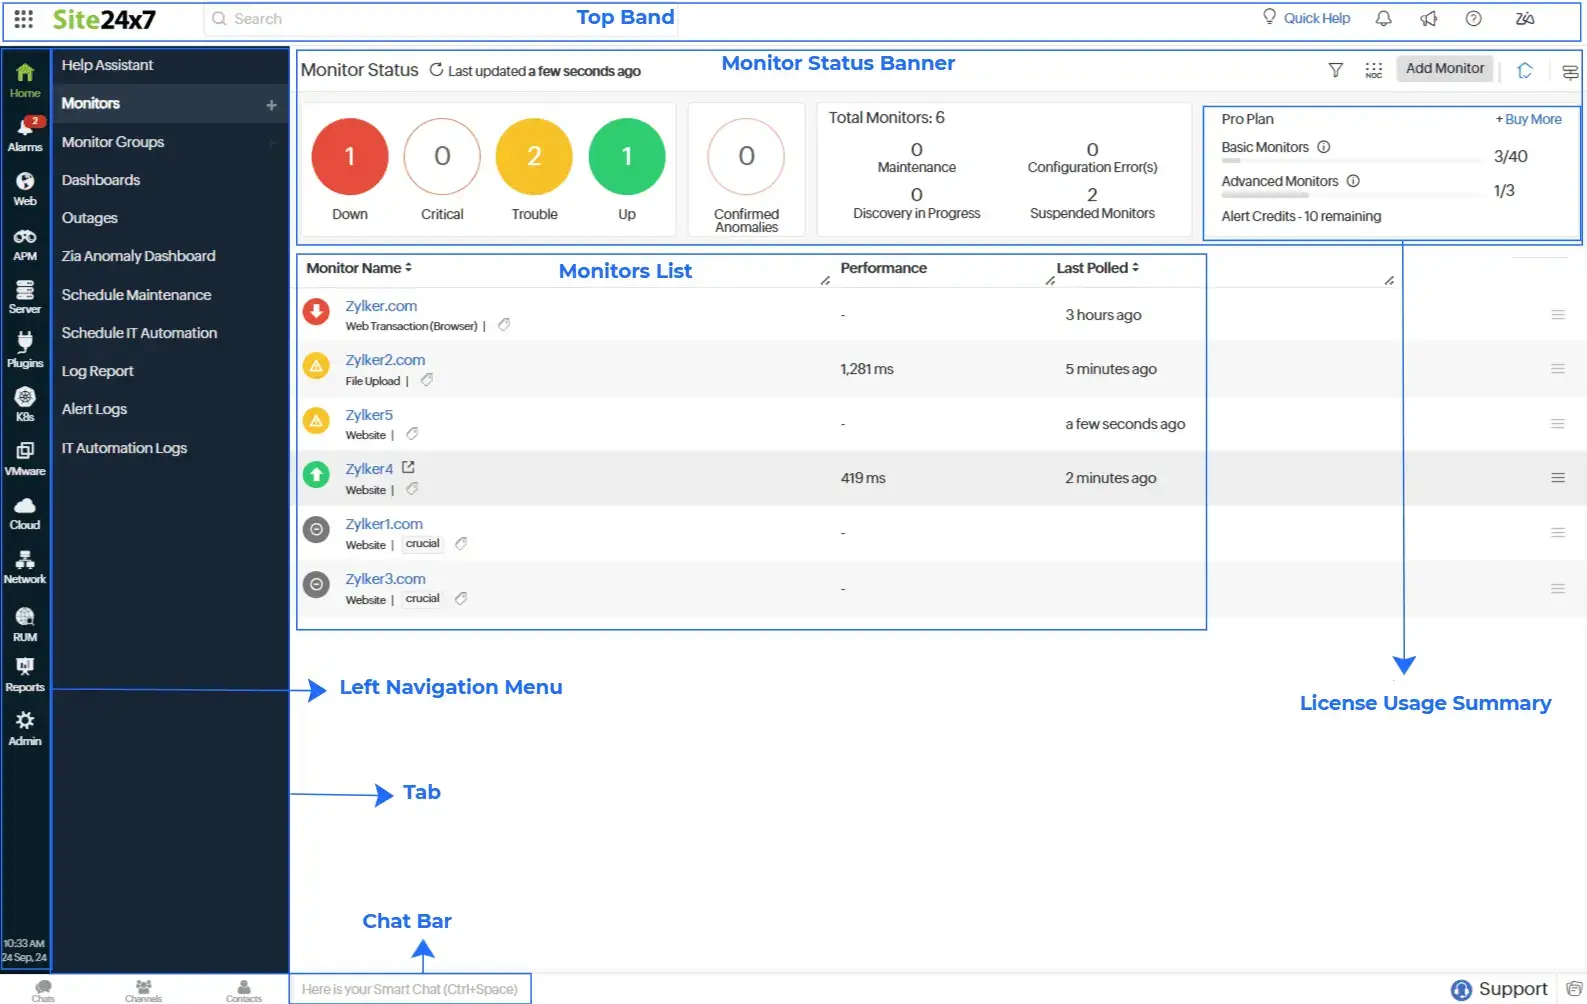
Features:
- Infrastructure monitoring for servers, VMs, and containers with agent and agentless options
- Network and application performance monitoring with synthetic transaction testing
- Real User Monitoring (RUM) for end-user experience tracking
- MSP-ready multi-client dashboards with SLA reporting and AI-powered anomaly detection
Pricing: Pricing varies by monitor type and add-ons; 30-day free trial available
Best for: Managed service providers supporting multiple client environments from a single console
Open Source Monitoring Tools
Open source monitoring solutions provide cost-effective alternatives to commercial platforms while offering high levels of customization and community support. These tools are particularly valuable for organizations with specific monitoring requirements or budget constraints.
Nagios
Nagios is one of the most popular open-source monitoring tools, known for its flexibility and extensive plugin ecosystem.
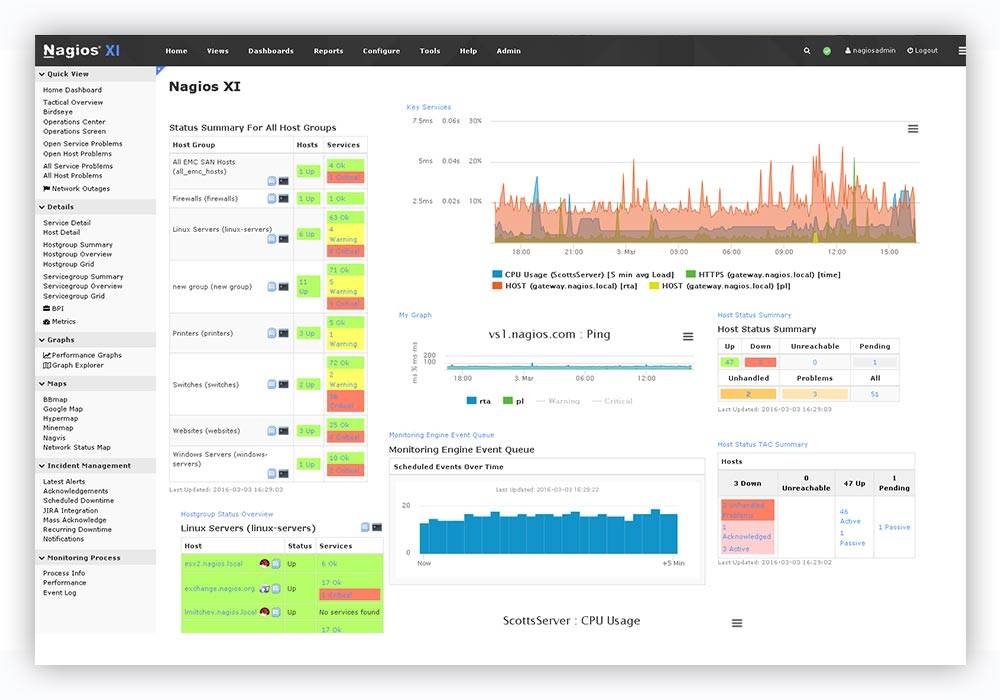
Features:
- Comprehensive monitoring of servers, networks, and applications
- Customizable alerting and reporting with flexible notification channels
- Extensive library of 50+ official and community plugins for extended functionality
- Passive and active check support for diverse monitoring scenarios
Pricing: Free (Nagios Core open-source); Nagios XI commercial edition available
Best for: Organizations looking for a highly customizable open-source monitoring solution with proven reliability in diverse environments
Prometheus
Prometheus is an open-source monitoring and alerting toolkit designed for reliability and scalability, particularly in cloud-native environments.
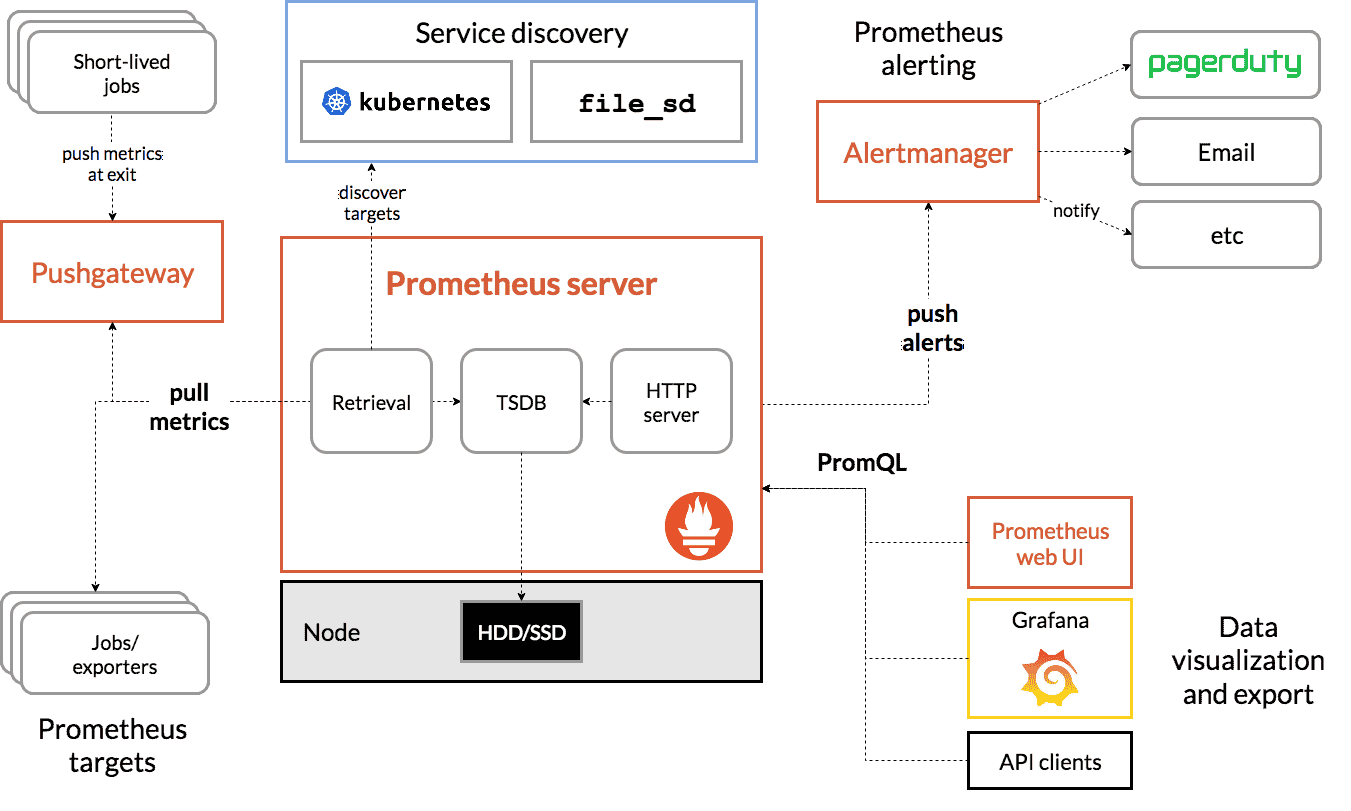
Features:
- Powerful PromQL query language for flexible time-series data analysis
- Pull-based metrics collection with service discovery for dynamic environments
- Robust alerting via Alertmanager with grouping, inhibition, and silencing
- Native integration with Grafana for visualization and dashboarding
Pricing: Free (open-source); Grafana Cloud offers managed Prometheus with a free tier
Best for: Cloud-native and Kubernetes environments where a pull-based metrics system with a powerful query language is preferred
Network Monitoring Solutions
Network monitoring solutions focus specifically on network infrastructure performance, including bandwidth utilization, device health, and connectivity issues. While comprehensive infrastructure monitoring platforms include network monitoring capabilities, specialized network monitoring tools provide deeper insights into network-specific metrics and protocols.
For organizations requiring detailed network performance analysis, traffic pattern recognition, and network security monitoring, dedicated network monitoring solutions offer specialized features that may not be available in general-purpose infrastructure monitoring tools.
SolarWinds NPM
SolarWinds NPM is a powerful and user-friendly monitoring tool tailored for network performance monitoring.
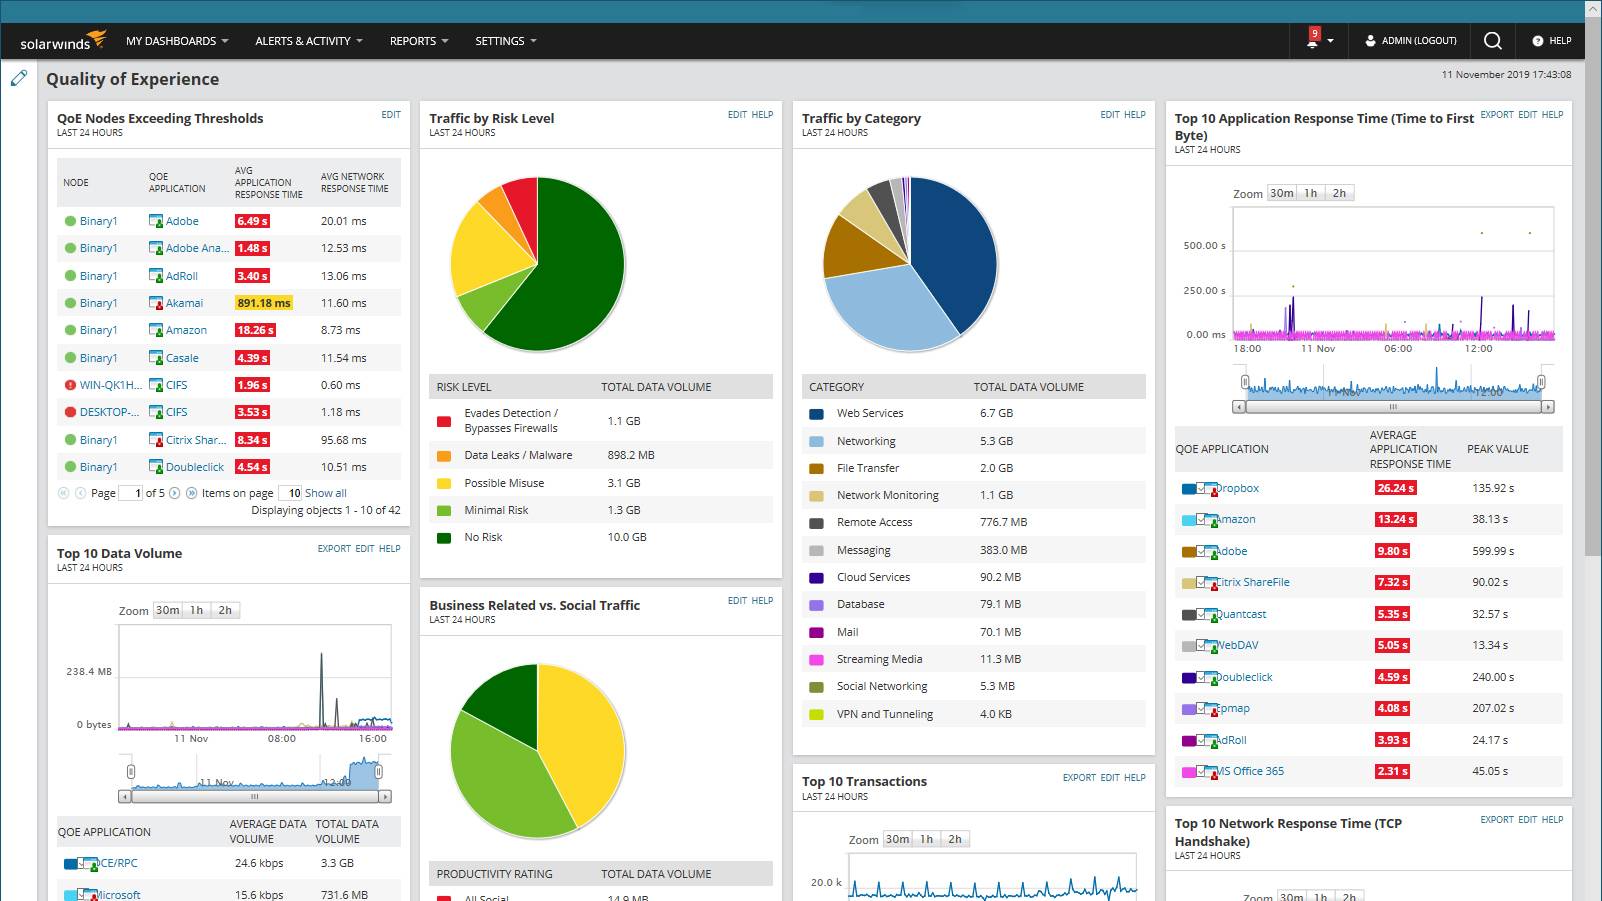
Features:
- Comprehensive network performance monitoring with flow analysis (NetFlow, sFlow, J-Flow)
- Automated network discovery and topology mapping
- Intuitive and customizable dashboards with at-a-glance performance views
- Advanced alerting with intelligent baseline-based thresholds
Pricing: Custom enterprise pricing; 30-day trial available
Best for: IT departments focused on maintaining optimal network performance across large enterprise or campus networks
For specialized network monitoring, see our detailed network monitoring tools comparison.
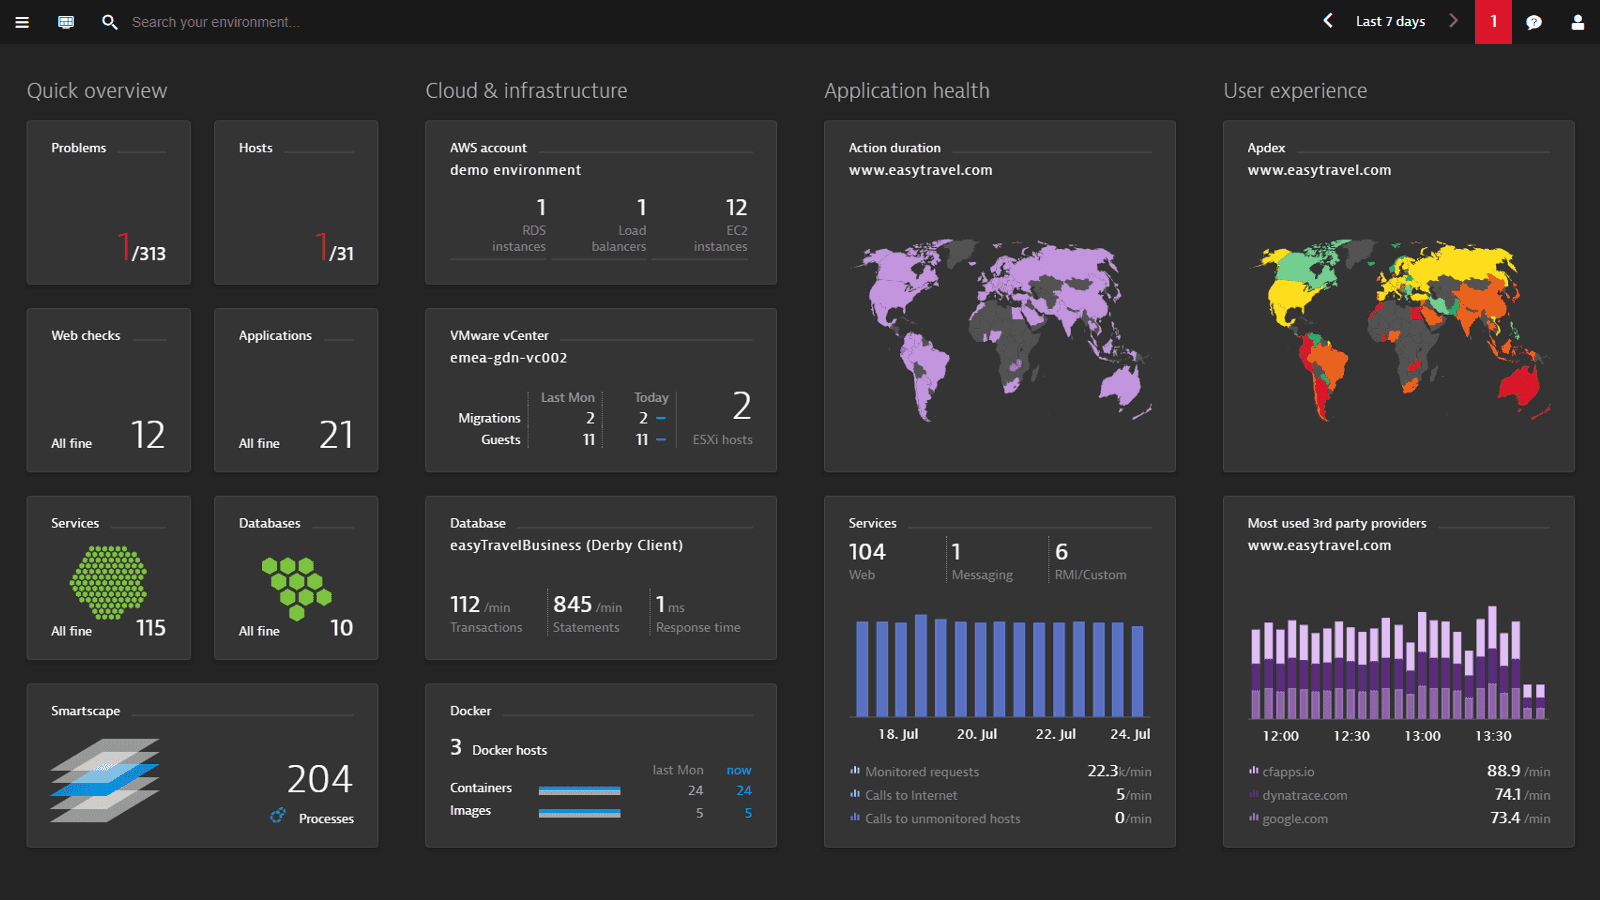
Application Performance Monitoring
While infrastructure monitoring focuses on the underlying technology stack, application performance monitoring (APM) tools specifically track software-level metrics from an end-user perspective. APM solutions monitor application response times, error rates, and user experiences to ensure applications perform optimally.
Modern observability platforms increasingly blur the line between APM and infrastructure monitoring — tools like New Relic, Datadog, and Dynatrace cover both layers in a unified interface. The tools below are primarily APM platforms but are included here because full-stack observability requires both application and infrastructure visibility in a single context.
New Relic
New Relic One offers a suite of tools for monitoring and managing the performance of your applications and infrastructure.
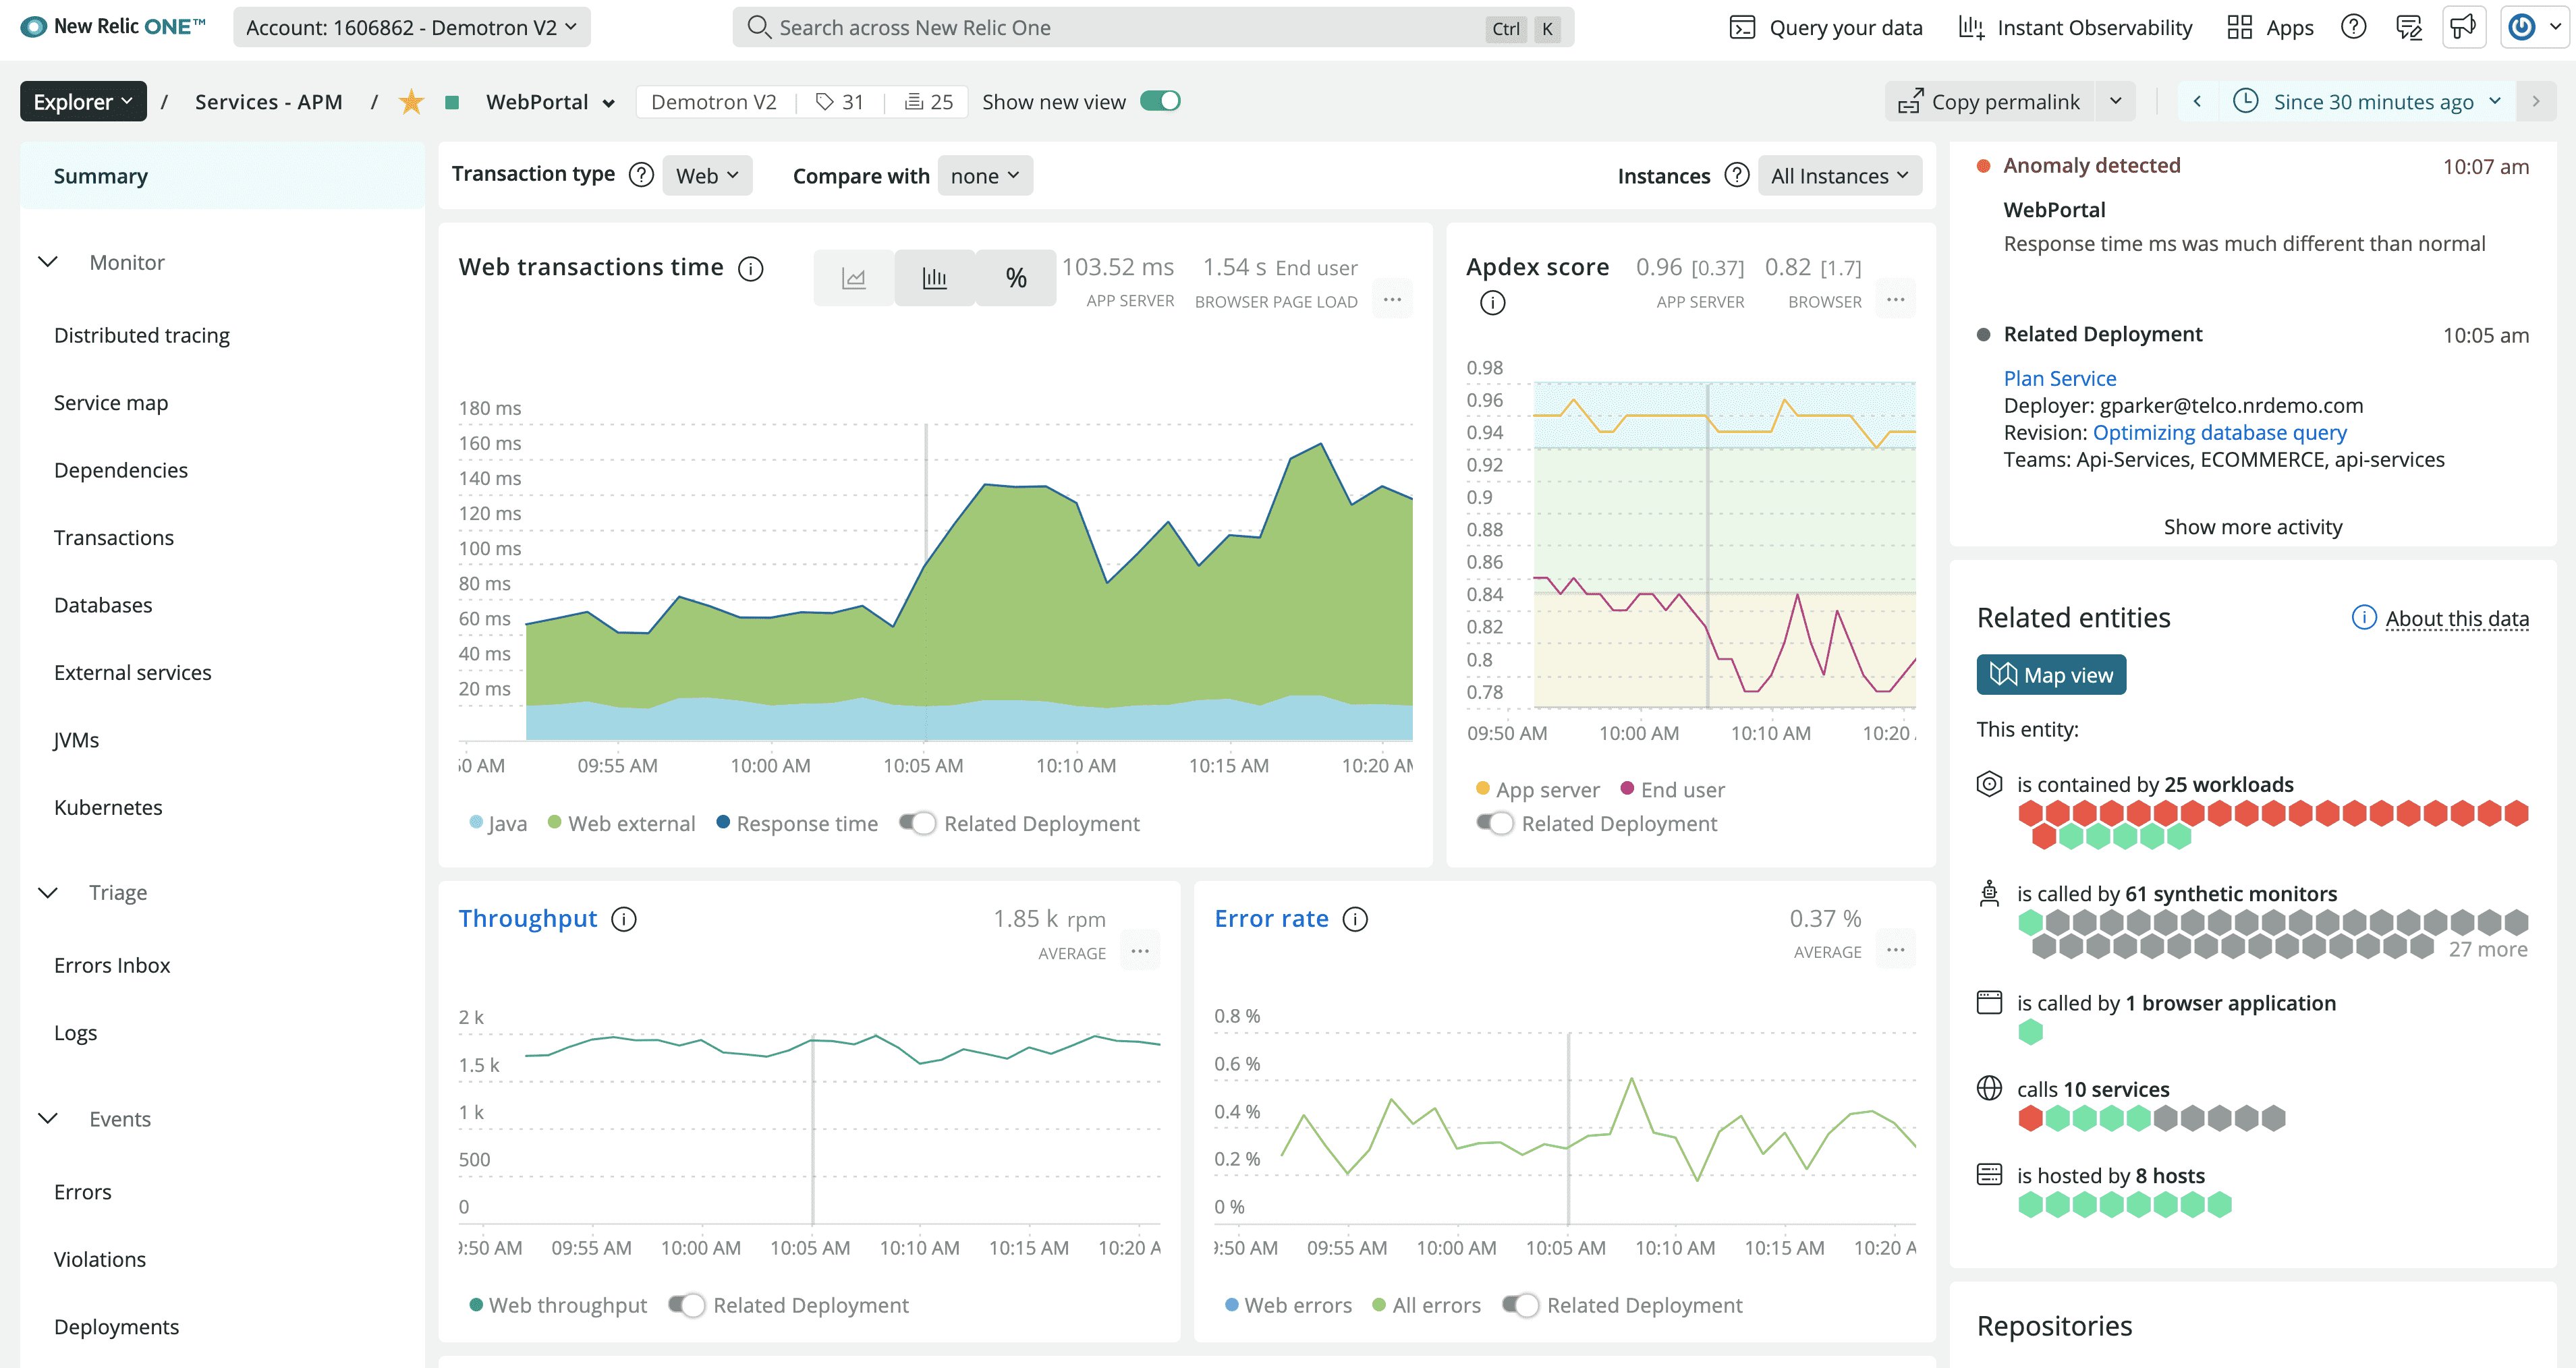
Features:
- Comprehensive APM with distributed tracing and code-level visibility
- Real-time user monitoring (RUM) and synthetic monitoring
- Detailed transaction tracing with NRQL query language
- Unified infrastructure and application monitoring in a single platform
Pricing: Free tier includes 100GB/month and one full-platform user; Standard from $10 for the first user, Pro from $349/user annually, plus usage-based ingest
Best for: Application-focused teams that also need infrastructure visibility, or organizations wanting a single vendor covering both layers
Learn more about application performance monitoring tools for deeper application insights.
Specialized Monitoring Tools
Splunk
Splunk is a powerful platform for searching, monitoring, and analyzing machine-generated data in real-time.
Features:
- Advanced log management and analysis with SPL query language
- Real-time monitoring and alerting across petabyte-scale data
- SIEM capabilities with threat intelligence integration
- Scalable distributed architecture for large data volumes
Pricing: Volume-based ingest pricing; contact sales for current rates
Best for: Organizations with security and compliance requirements needing powerful log analysis alongside infrastructure monitoring
Explore log analysis tools for comprehensive log management solutions.
Grafana
Grafana is an open-source visualization and dashboarding layer, not a standalone monitoring tool. It does not collect or store metrics itself — instead it connects to external data sources like Prometheus, Loki, Elasticsearch, ClickHouse, and others, then renders their data in highly customizable dashboards. Most teams run Grafana alongside Prometheus (metrics) and Loki (logs) as a unified visualization frontend for their existing monitoring stack.
Features:
- Advanced visualization with fully customizable dashboards and 100+ panel types
- Connects to 50+ data sources: Prometheus, Elasticsearch, InfluxDB, CloudWatch, and more
- Unified alerting across all connected data sources
- Extensive plugin ecosystem for custom panels, data sources, and apps
Pricing: Free (open-source self-hosted); Grafana Cloud free tier available, Grafana Cloud Pro from $19/month + usage
Best for: Teams that already have metrics and log data in Prometheus, Loki, or another backend and want a powerful, flexible visualization layer on top
Conclusion
Choosing the right infrastructure monitoring tools and software solutions is essential for maintaining the performance, security, and reliability of your IT infrastructure. Whether you need comprehensive monitoring platforms like Uptrace or Dynatrace, open-source solutions like Prometheus and Zabbix, or specialized tools like Grafana for visualization, the options listed above provide robust features to meet your organization's needs. By carefully evaluating the capabilities and trade-offs of each tool, you can ensure you select the right monitoring systems for your IT environment.
Incorporating these top monitoring tools into your IT infrastructure strategy will help you achieve better visibility, faster issue resolution, and improved overall performance. Whether you're managing a small network or a complex cloud environment, the right tools can make all the difference.
FAQ
- What should I monitor in my IT infrastructure? Key areas to monitor include server health (CPU, memory, disk usage), network performance (bandwidth, latency), application performance (response times, error rates), database performance (query times, transactions), security metrics, and user experience metrics.
- What's the difference between infrastructure monitoring and server monitoring? Infrastructure monitoring encompasses the entire IT environment including servers, networks, applications, databases, and cloud services, while server monitoring focuses specifically on individual server performance and health metrics like CPU usage, memory consumption, and disk space.
- How do open-source and commercial monitoring software compare? Open-source tools like Prometheus and Grafana offer flexibility and cost-effectiveness but may require more setup and maintenance. Commercial solutions like Datadog and New Relic provide more out-of-box functionality and support but come with subscription costs. Consider your technical expertise, budget, and support requirements when choosing.
- How does cloud monitoring differ from traditional infrastructure monitoring? Cloud monitoring tools are designed for dynamic, scalable environments and offer features like auto-discovery, API integration with cloud providers, cost optimization tracking, and support for containerized applications. Traditional monitoring focuses more on static, on-premises infrastructure with predictable resource allocation.
- Which monitoring tool is best for cloud environments? Tools like Datadog and New Relic excel in cloud environments with native integration for major cloud providers. Uptrace and Prometheus are also strong choices for cloud-native architectures, especially when working with containerized applications.
- What about monitoring tools for smaller organizations? Smaller organizations might start with tools like PRTG or Zabbix, which offer good functionality without overwhelming complexity. Uptrace provides a balanced solution that can scale with your growth while remaining cost-effective.
- How do these tools handle scalability? Most modern monitoring tools are designed to scale, but their approaches differ: Datadog and New Relic scale automatically in the cloud; Prometheus requires additional setup for large-scale deployments; Uptrace scales efficiently through its ClickHouse-backed architecture; Nagios and Zabbix can handle growth but may need more configuration.
- What are the cost considerations when choosing a monitoring tool? Open-source tools (Prometheus, Grafana) have no licensing costs but require infrastructure and maintenance. Commercial tools (Datadog, New Relic) typically charge based on hosts, metrics, or data volume. Uptrace offers more predictable pricing without per-host or per-user fees. Consider both direct costs and maintenance overhead in your evaluation.
- How important is visualization in monitoring tools? Visualization is crucial for understanding complex data and identifying trends. Grafana excels specifically in this area as a dedicated visualization layer, while platforms like Uptrace and Datadog provide built-in visualization capabilities alongside data collection. Consider how the tool presents data and whether it meets your team's needs for analysis and reporting.
- What about integration capabilities? Modern monitoring tools should integrate well with your existing stack: consider support for your programming languages and frameworks, look for integration with your cloud providers and services, check compatibility with your existing tools and workflows, and evaluate the availability of APIs and plugins.
- Which monitoring software is best for servers? For server monitoring, tools like Zabbix, PRTG, and Nagios excel at tracking server health metrics including CPU, memory, disk usage, and system processes. These tools provide comprehensive server monitoring capabilities with customizable alerting.
- What are monitoring systems vs monitoring tools? Monitoring systems refer to comprehensive platforms that combine multiple monitoring capabilities (infrastructure, application, network, security) in a unified solution, while monitoring tools typically focus on specific aspects like network, application, or server monitoring. Systems provide broader visibility and correlation across different infrastructure components.
You may also be interested in: