Best Open Source and Free Network Monitoring Tools for 2026
Network monitoring tools track network performance, device health, and security in real-time. Open source options like Zabbix, Nagios, and OpenNMS provide free alternatives to commercial tools like SolarWinds and PRTG. These tools monitor bandwidth, latency, and device status using SNMP, agents, or agentless methods, with alerts for network issues.
This guide compares 11 open source and commercial network monitoring tools across features, pricing, protocol support, and deployment complexity to help you choose the right solution for your network size and team.
What is Network Monitoring?
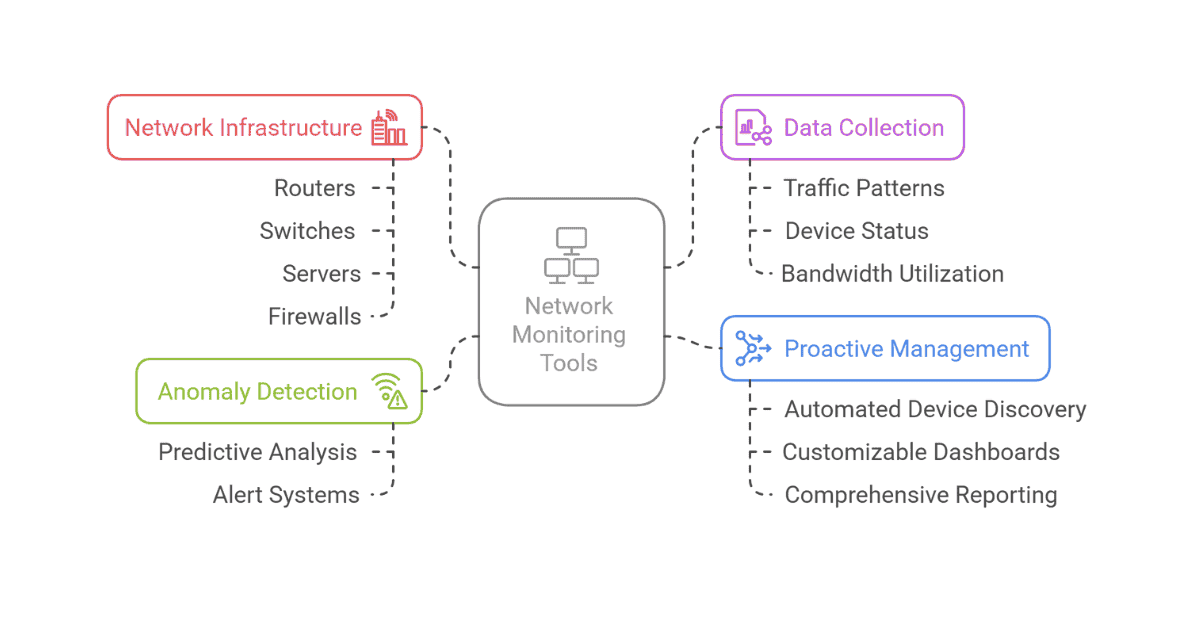
Network monitoring is the practice of continuously observing network infrastructure — routers, switches, firewalls, access points, and servers — to detect performance degradation, outages, and security threats before they impact users. Monitoring tools collect data through protocols like SNMP, ICMP (ping), NetFlow, and sFlow, then visualize it through dashboards and trigger alerts when thresholds are breached.
Effective network monitoring answers questions like: Which links are saturated? Is a switch dropping packets? How much bandwidth does a specific subnet consume? When did a device go offline, and why?
For teams that also monitor applications and services, network monitoring data pairs well with application performance monitoring and distributed tracing to provide full-stack visibility from the wire to the code.
Key Features to Look For
When evaluating network monitoring tools, focus on these capabilities:
- Protocol support — SNMP v1/v2c/v3 is essential for most network gear. NetFlow/sFlow support matters for traffic analysis. ICMP (ping) and WMI cover basic availability and Windows monitoring.
- Auto-discovery — Automatically finding and mapping devices via CDP, LLDP, or ARP reduces manual configuration as networks grow.
- Alerting and escalation — Threshold-based alerts with escalation chains, email/SMS/webhook notifications, and alert suppression during maintenance windows.
- Scalability — Distributed polling, proxy architectures, or horizontal scaling for networks with thousands of devices across multiple sites.
- Visualization — Network topology maps, real-time dashboards, and historical trend graphs for capacity planning.
- API and integrations — REST APIs for automation, webhooks for incident management tools, and integration with ticketing systems.
Quick Comparison
| Tool | License | Price | OS Support | Best For | SNMP |
|---|---|---|---|---|---|
| Zabbix | GPL v2 | Free | All | Enterprise open source | ✓ |
| Nagios Core | GPL v2 | Free | All | Customizable monitoring | ✓ |
| PRTG | Commercial | Free (100 sensors) / Paid | Windows/Linux | Easy setup, SMBs | ✓ |
| OpenNMS | GPL v3 | Free | All | Large-scale networks | ✓ |
| LibreNMS | GPL v3 | Free | Linux | Auto-discovery | ✓ |
| SolarWinds NPM | Commercial | Paid | Windows | Enterprise features | ✓ |
| Icinga | GPL v2 | Free | All | Modern Nagios alternative | ✓ |
| Netdata | GPL v3 | Free | All | Real-time monitoring | ✗ |
| WhatsUp Gold | Commercial | Paid | Windows | Network mapping | ✓ |
| Dynatrace | Commercial | Paid ($69/month) | SaaS | AI-powered monitoring | ✗ |
| ManageEngine | Commercial | Free (3 devices) / Paid | Windows/Linux | Quick deployment | ✓ |
Open Source Network Monitoring Tools
Zabbix
License: GPL v2 (Open Source)
Price: Free
OS: Linux, Windows, macOS
Best for: Enterprise-grade open source monitoring
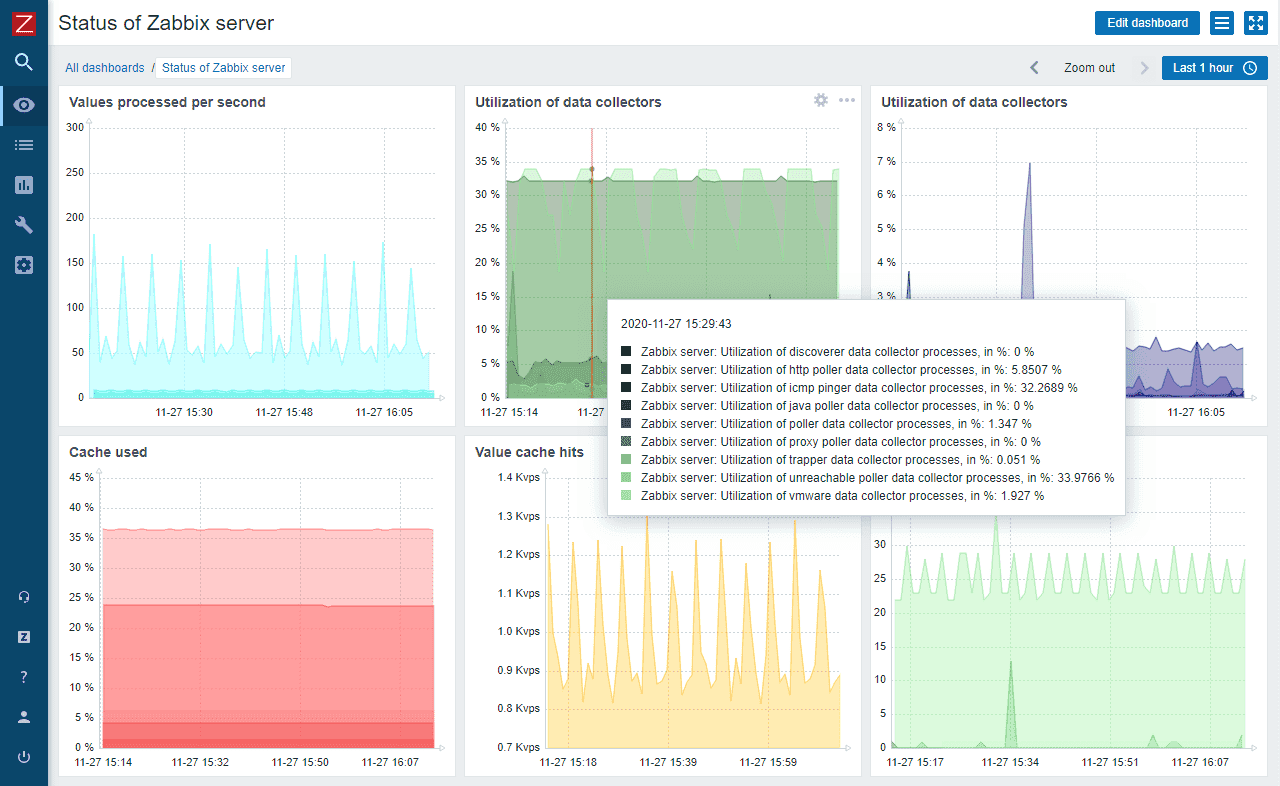
Zabbix offers enterprise features without licensing costs. The LTS releases include proxy high availability, synthetic web monitoring, and major performance improvements. Auto-discovery, distributed monitoring, and template-based configuration make it scalable for large networks.
Key Features:
- Agent-based and agentless monitoring
- SNMP v1/v2/v3 support
- Auto-discovery of network devices
- Distributed monitoring architecture
- Event correlation engine
- Customizable dashboards
Pros: Free, highly scalable, enterprise features, active development
Cons: Steep learning curve, complex setup, resource-intensive
Nagios Core
License: GPL v2 (Open Source)
Price: Free
OS: Linux, Windows, macOS
Best for: Maximum customization and flexibility
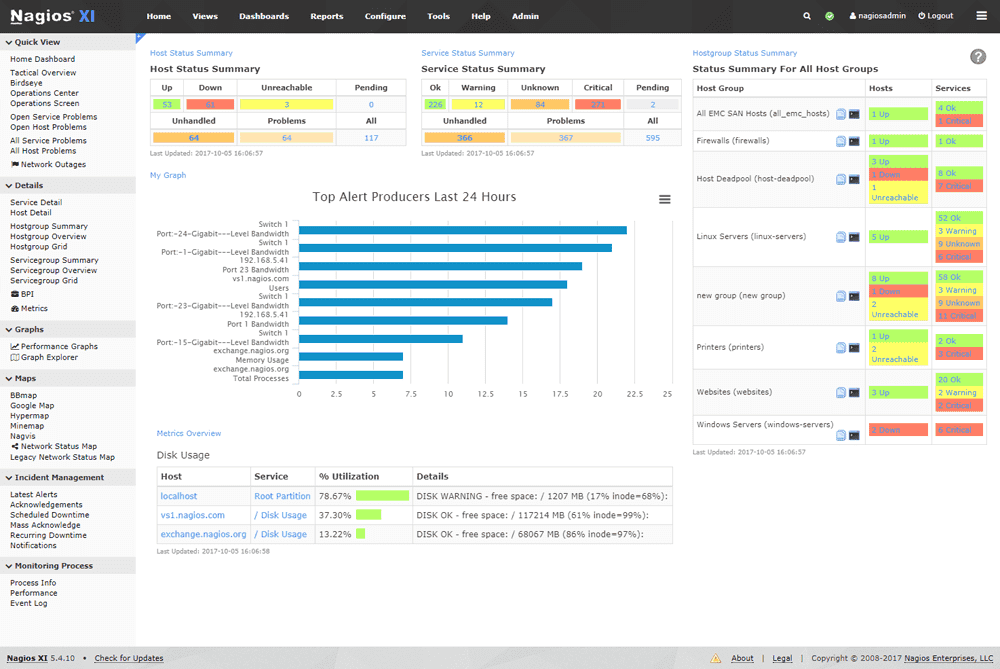
Nagios Core is the pioneer of open source monitoring. It provides a powerful framework with 5,000+ community plugins for monitoring virtually any device or metric.
Key Features:
- Extensive plugin ecosystem (5,000+)
- SNMP monitoring support
- Event handlers for automated remediation
- Text-based configuration
- Multi-tenant capabilities
- Strong community support
Pros: Completely free, unlimited customization, no device limits, mature platform
Cons: Steeper learning curve, text-file configuration, basic UI
OpenNMS
License: GPL v3 (Open Source)
Price: Free
OS: Linux, Windows
Best for: Large-scale enterprise networks
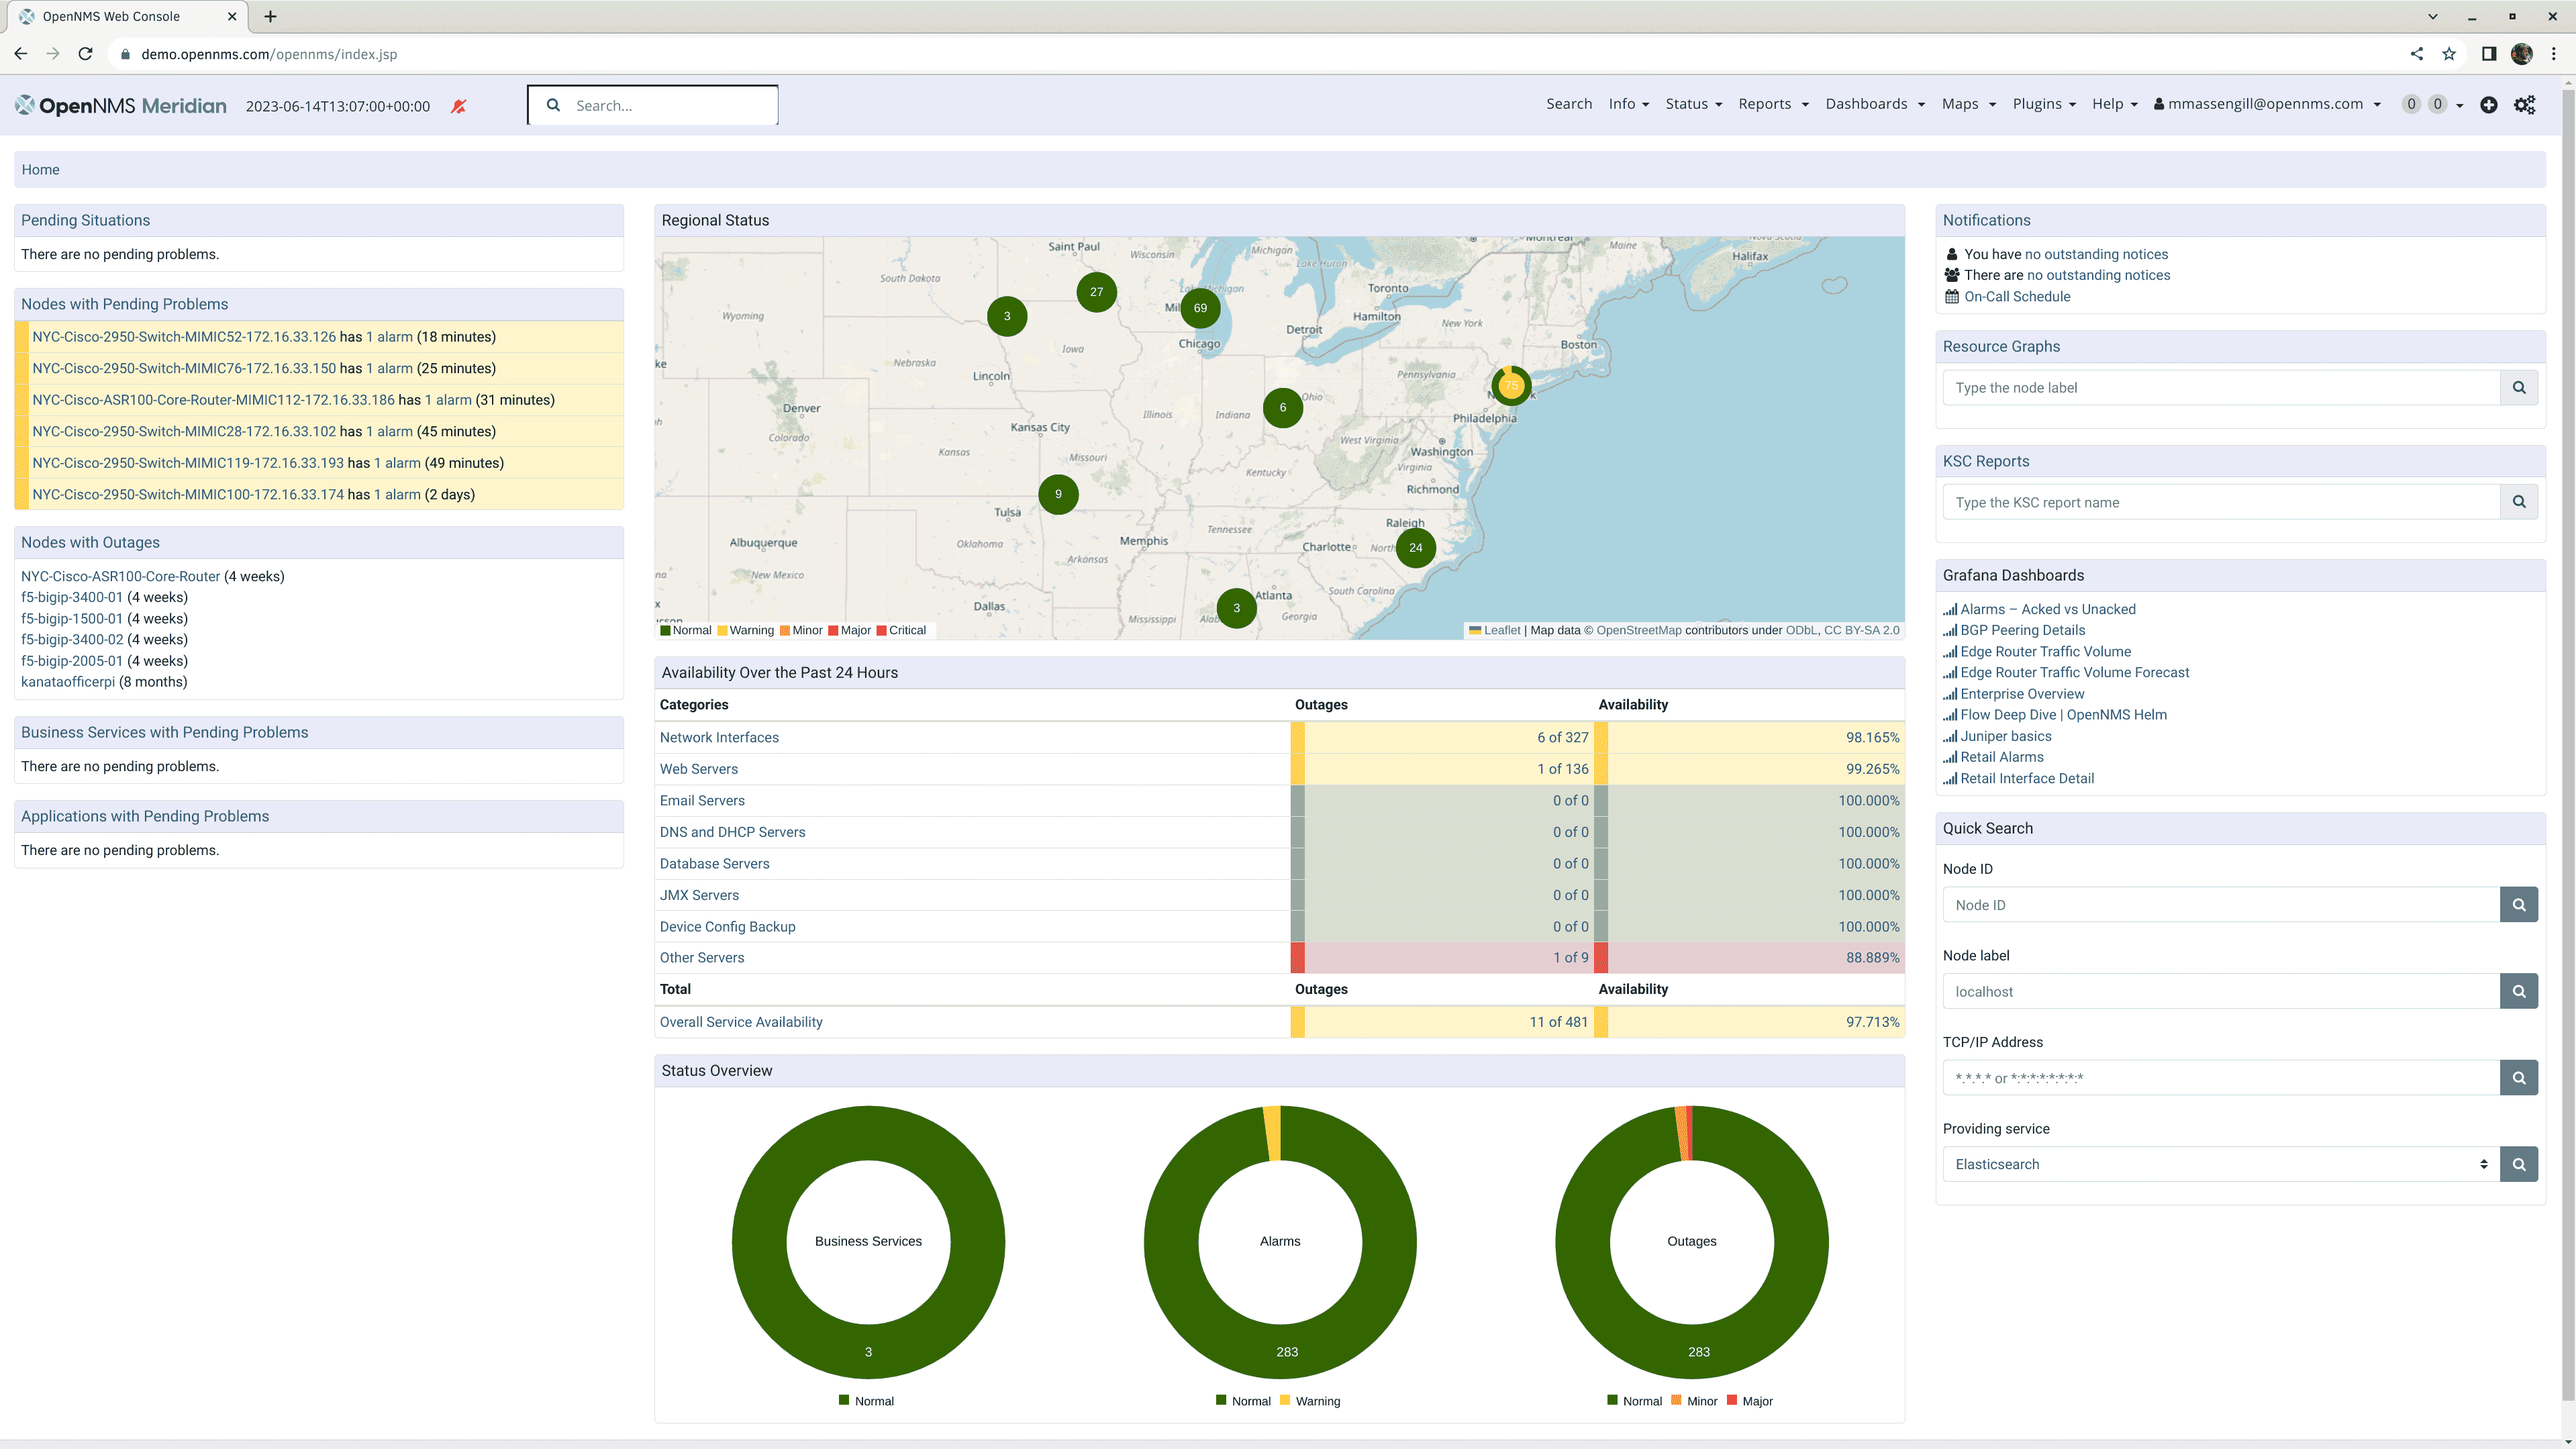
OpenNMS delivers enterprise-grade monitoring with highly scalable distributed architecture. Java-based platform with sophisticated event management and business service monitoring.
Key Features:
- Highly scalable distributed architecture
- Automated discovery and provisioning
- SNMP monitoring
- Time-series performance data
- Business service monitoring
- Threshold-based alerting
Pros: Free, exceptional scalability, enterprise capabilities, Java-based
Cons: Steep learning curve, complex configuration, requires technical expertise
Icinga
License: GPL v2 (Open Source)
Price: Free
OS: Linux, Windows
Best for: Modern Nagios alternative
Icinga is a Nagios fork with modern interface, improved database connectivity, and REST API. Latest version offers responsive web UI and flexible notification system.
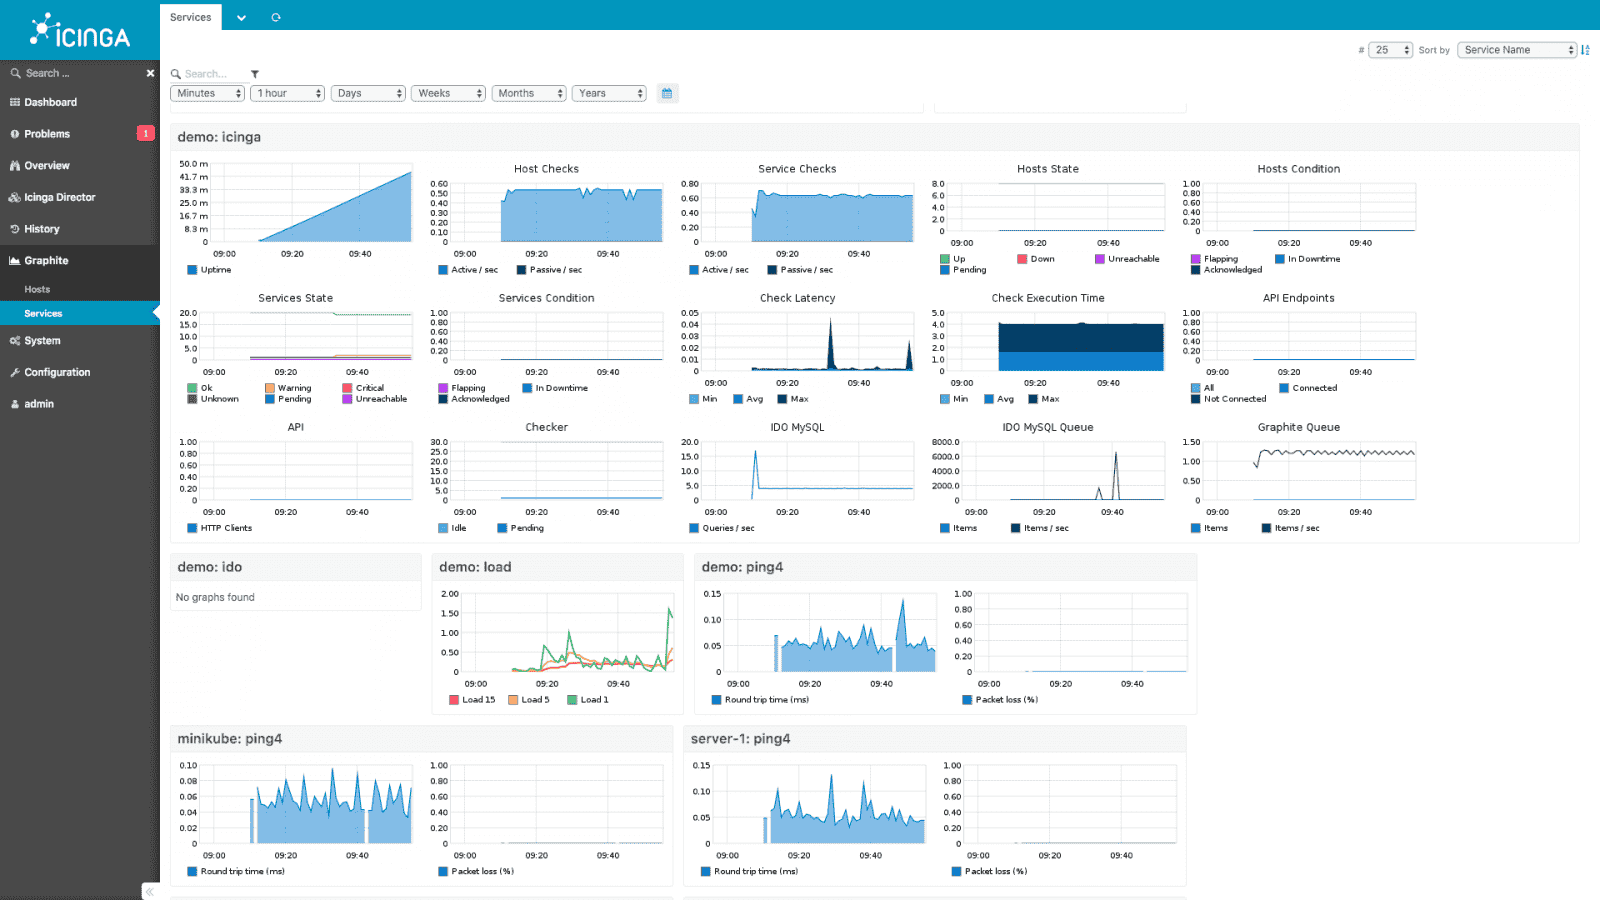
Key Features:
- Modern responsive web interface
- Distributed monitoring architecture
- REST API for integration
- SNMP support
- Business process monitoring
- Configuration via web UI or files
Pros: Free, modern UI, better database integration than Nagios, strong API
Cons: Complex setup, requires technical expertise, smaller plugin ecosystem
LibreNMS
License: GPL v3 (Open Source)
Price: Free
OS: Linux
Best for: Automatic network discovery
LibreNMS offers automatic network discovery and alerting with minimal configuration. It provides an extensive device library (10,000+ devices) with API for automation and monthly rolling releases.
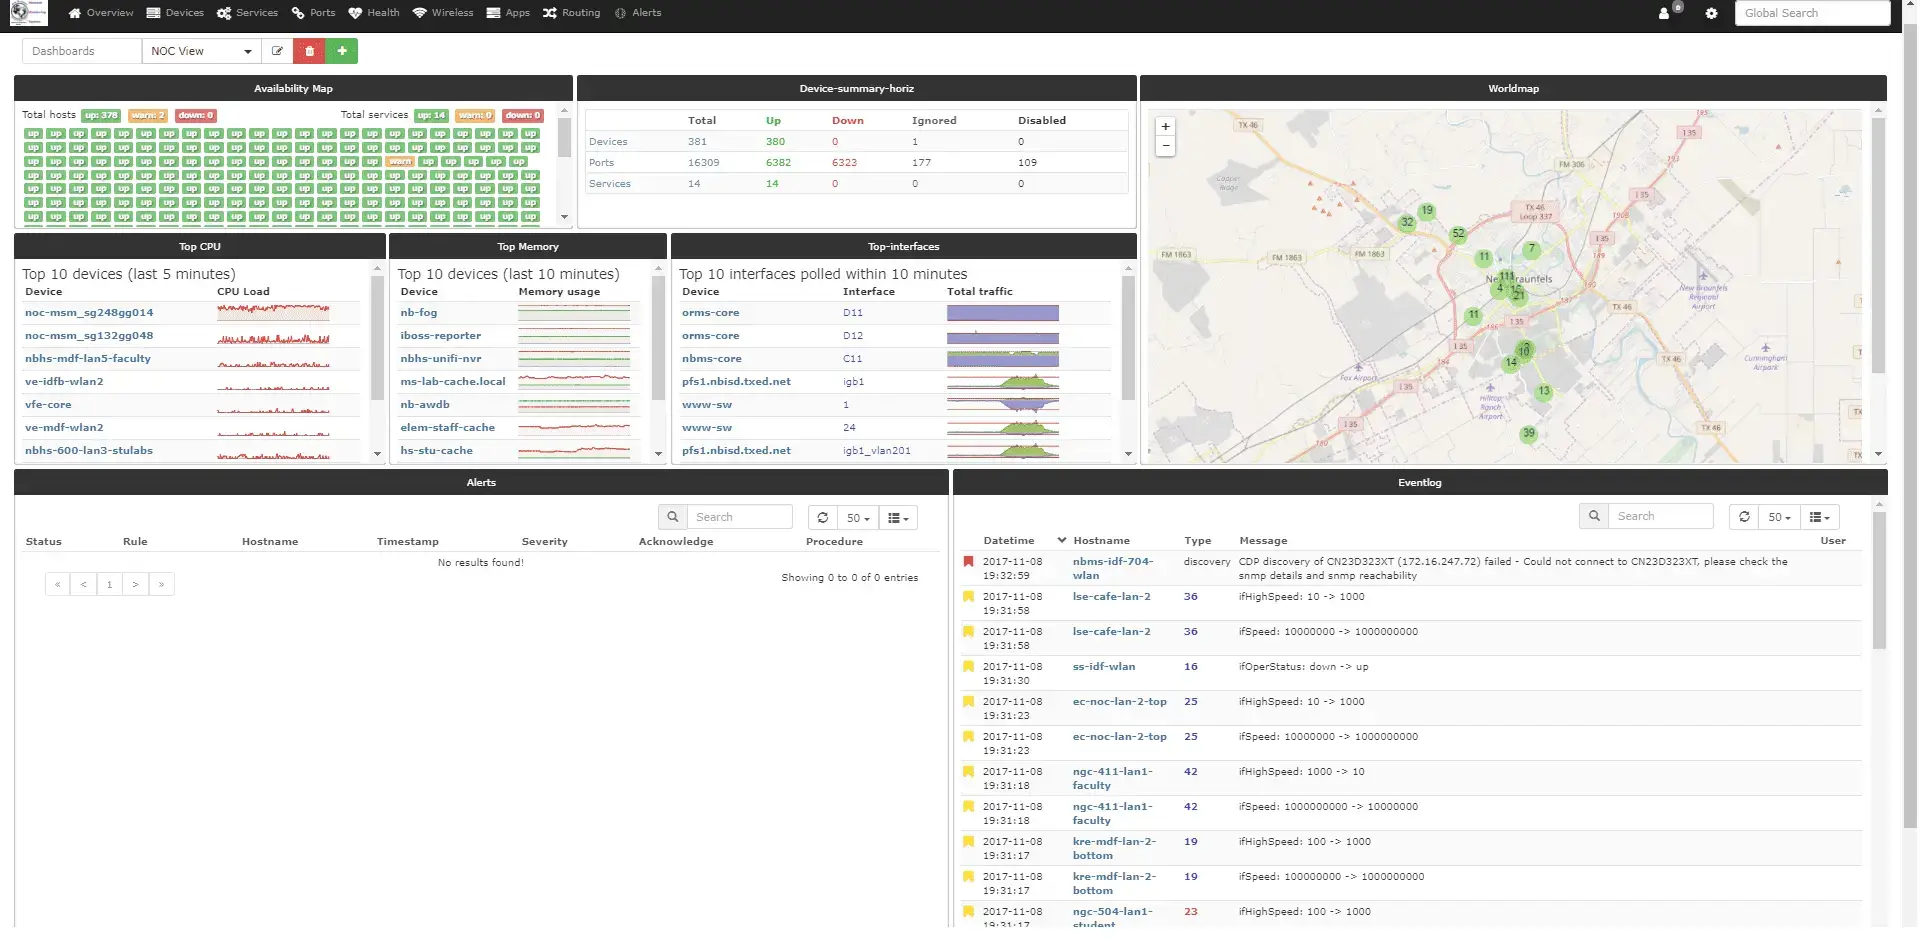
Key Features:
- Automatic device discovery (CDP, FDP, LLDP, OSPF, BGP)
- Extensive device support (10,000+ devices)
- SNMP monitoring
- API for automation
- Billing module for service providers
- Mobile-responsive interface
Pros: Easy setup, auto-discovery, active development, API-driven
Cons: Linux-only, requires web server (Apache/Nginx + PHP)
Netdata
License: GPL v3 (Open Source)
Price: Free
OS: Linux, Windows, macOS
Best for: Real-time per-second monitoring
Netdata revolutionizes monitoring with zero-configuration approach and real-time metrics collection. Lightweight agent collects thousands of metrics per second with minimal system impact.
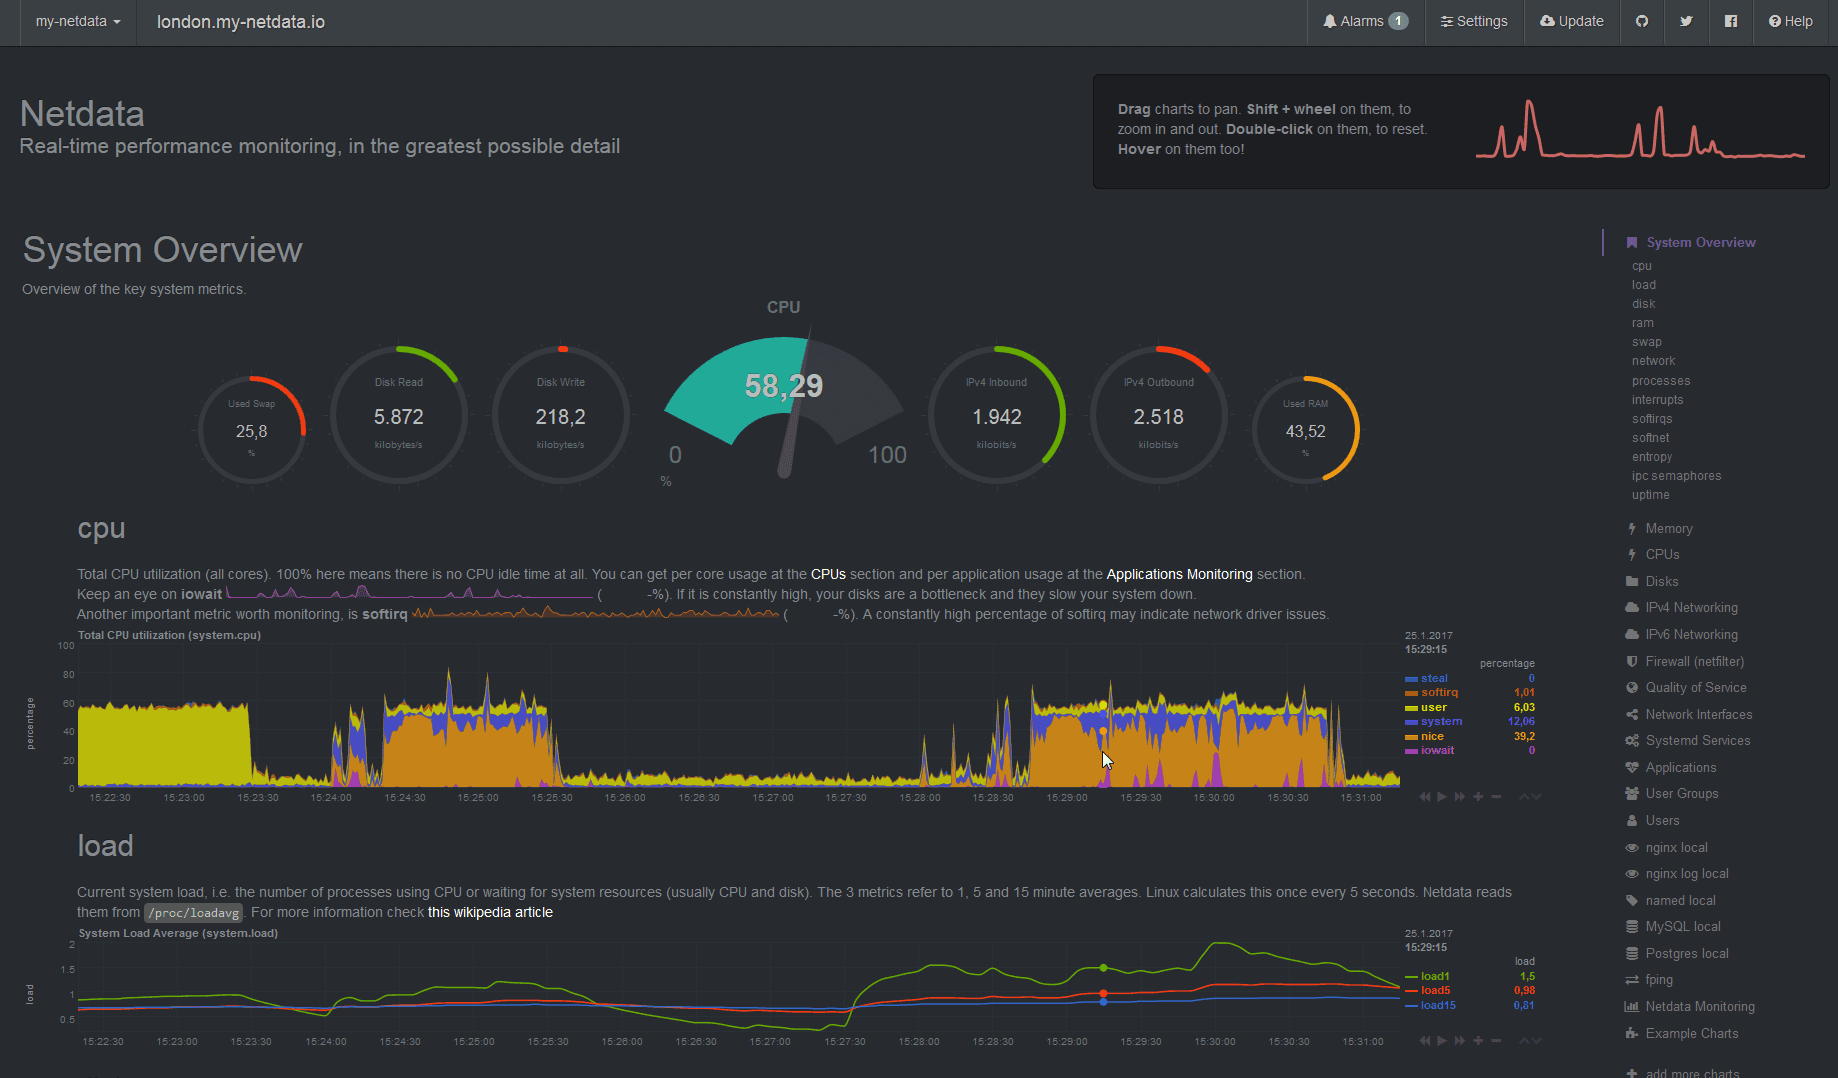
Key Features:
- Real-time per-second monitoring
- Zero-configuration deployment
- Minimal resource footprint
- Thousands of metrics automatically
- Interactive dashboards
- Embedded web server
Pros: Extremely easy deployment, lightweight, real-time visibility, auto-configures
Cons: No SNMP support, limited historical data storage, fewer device types
Commercial Network Monitoring Tools
PRTG Network Monitor
License: Commercial
Price: Free (100 sensors) / Paid
OS: Windows, Linux
Best for: Easy setup, SMBs
PRTG offers sensor-based licensing (free up to 100 sensors). Over 250 pre-configured sensors for SNMP, ping, bandwidth, and more. One sensor = one monitored metric.
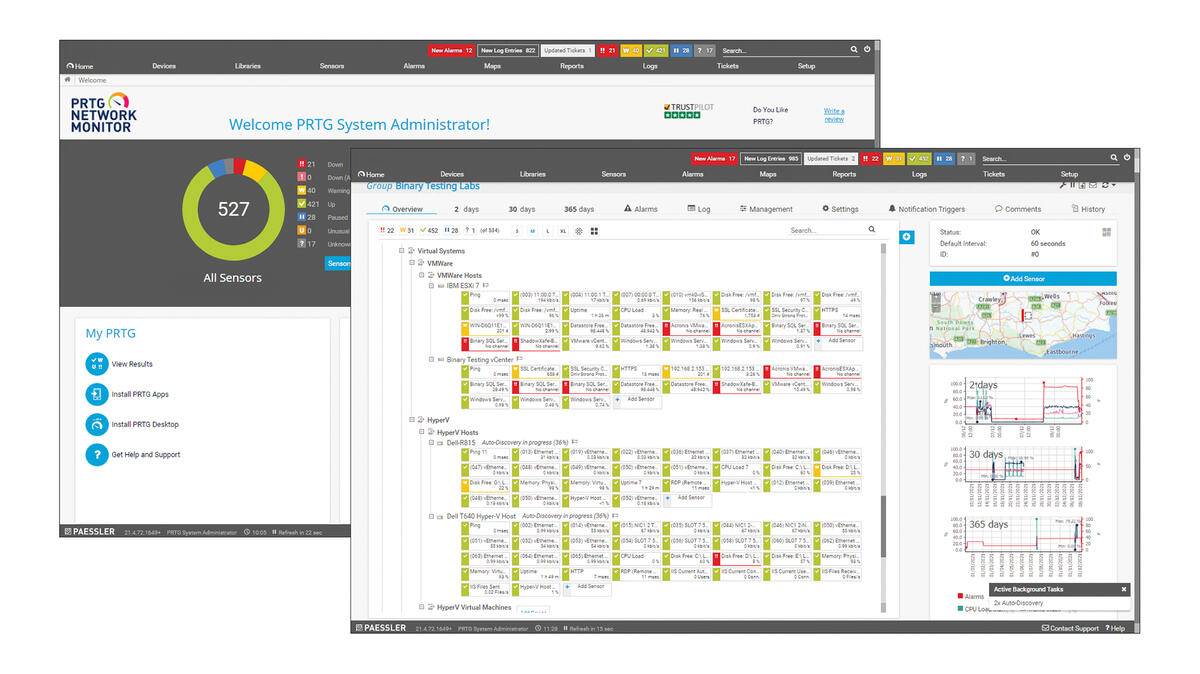
Key Features:
- 250+ pre-configured sensor types
- Auto-discovery of network devices
- SNMP v1/v2/v3 support
- Customizable dashboards
- Mobile apps (iOS/Android)
- On-premises or cloud
Pros: Transparent licensing, easy setup, comprehensive monitoring, good mobile apps
Cons: Expensive beyond 100 sensors, limited customization, basic reporting
SolarWinds Network Performance Monitor
License: Commercial
Price: Paid (starts ~$2,995)
OS: Windows
Best for: Enterprise networks, advanced features
SolarWinds NPM is an enterprise-grade solution with NetPath™ hop-by-hop analysis and PerfStack™ for troubleshooting. Comprehensive multi-vendor device support.
Key Features:
- NetPath™ hop-by-hop analysis
- Advanced network visualization
- SNMP monitoring
- Intelligent alerting
- Wireless network monitoring
- Automated discovery
Pros: Deep monitoring capabilities, intuitive interface, excellent scalability, strong device support
Cons: High price, resource-intensive, steep learning curve
ManageEngine OpManager
License: Commercial
Price: Free (3 devices) / Paid
OS: Windows, Linux
Best for: Quick deployment, limited IT staff
OpManager delivers quick-deployment monitoring with integrated configuration management. Free edition supports 3 devices.
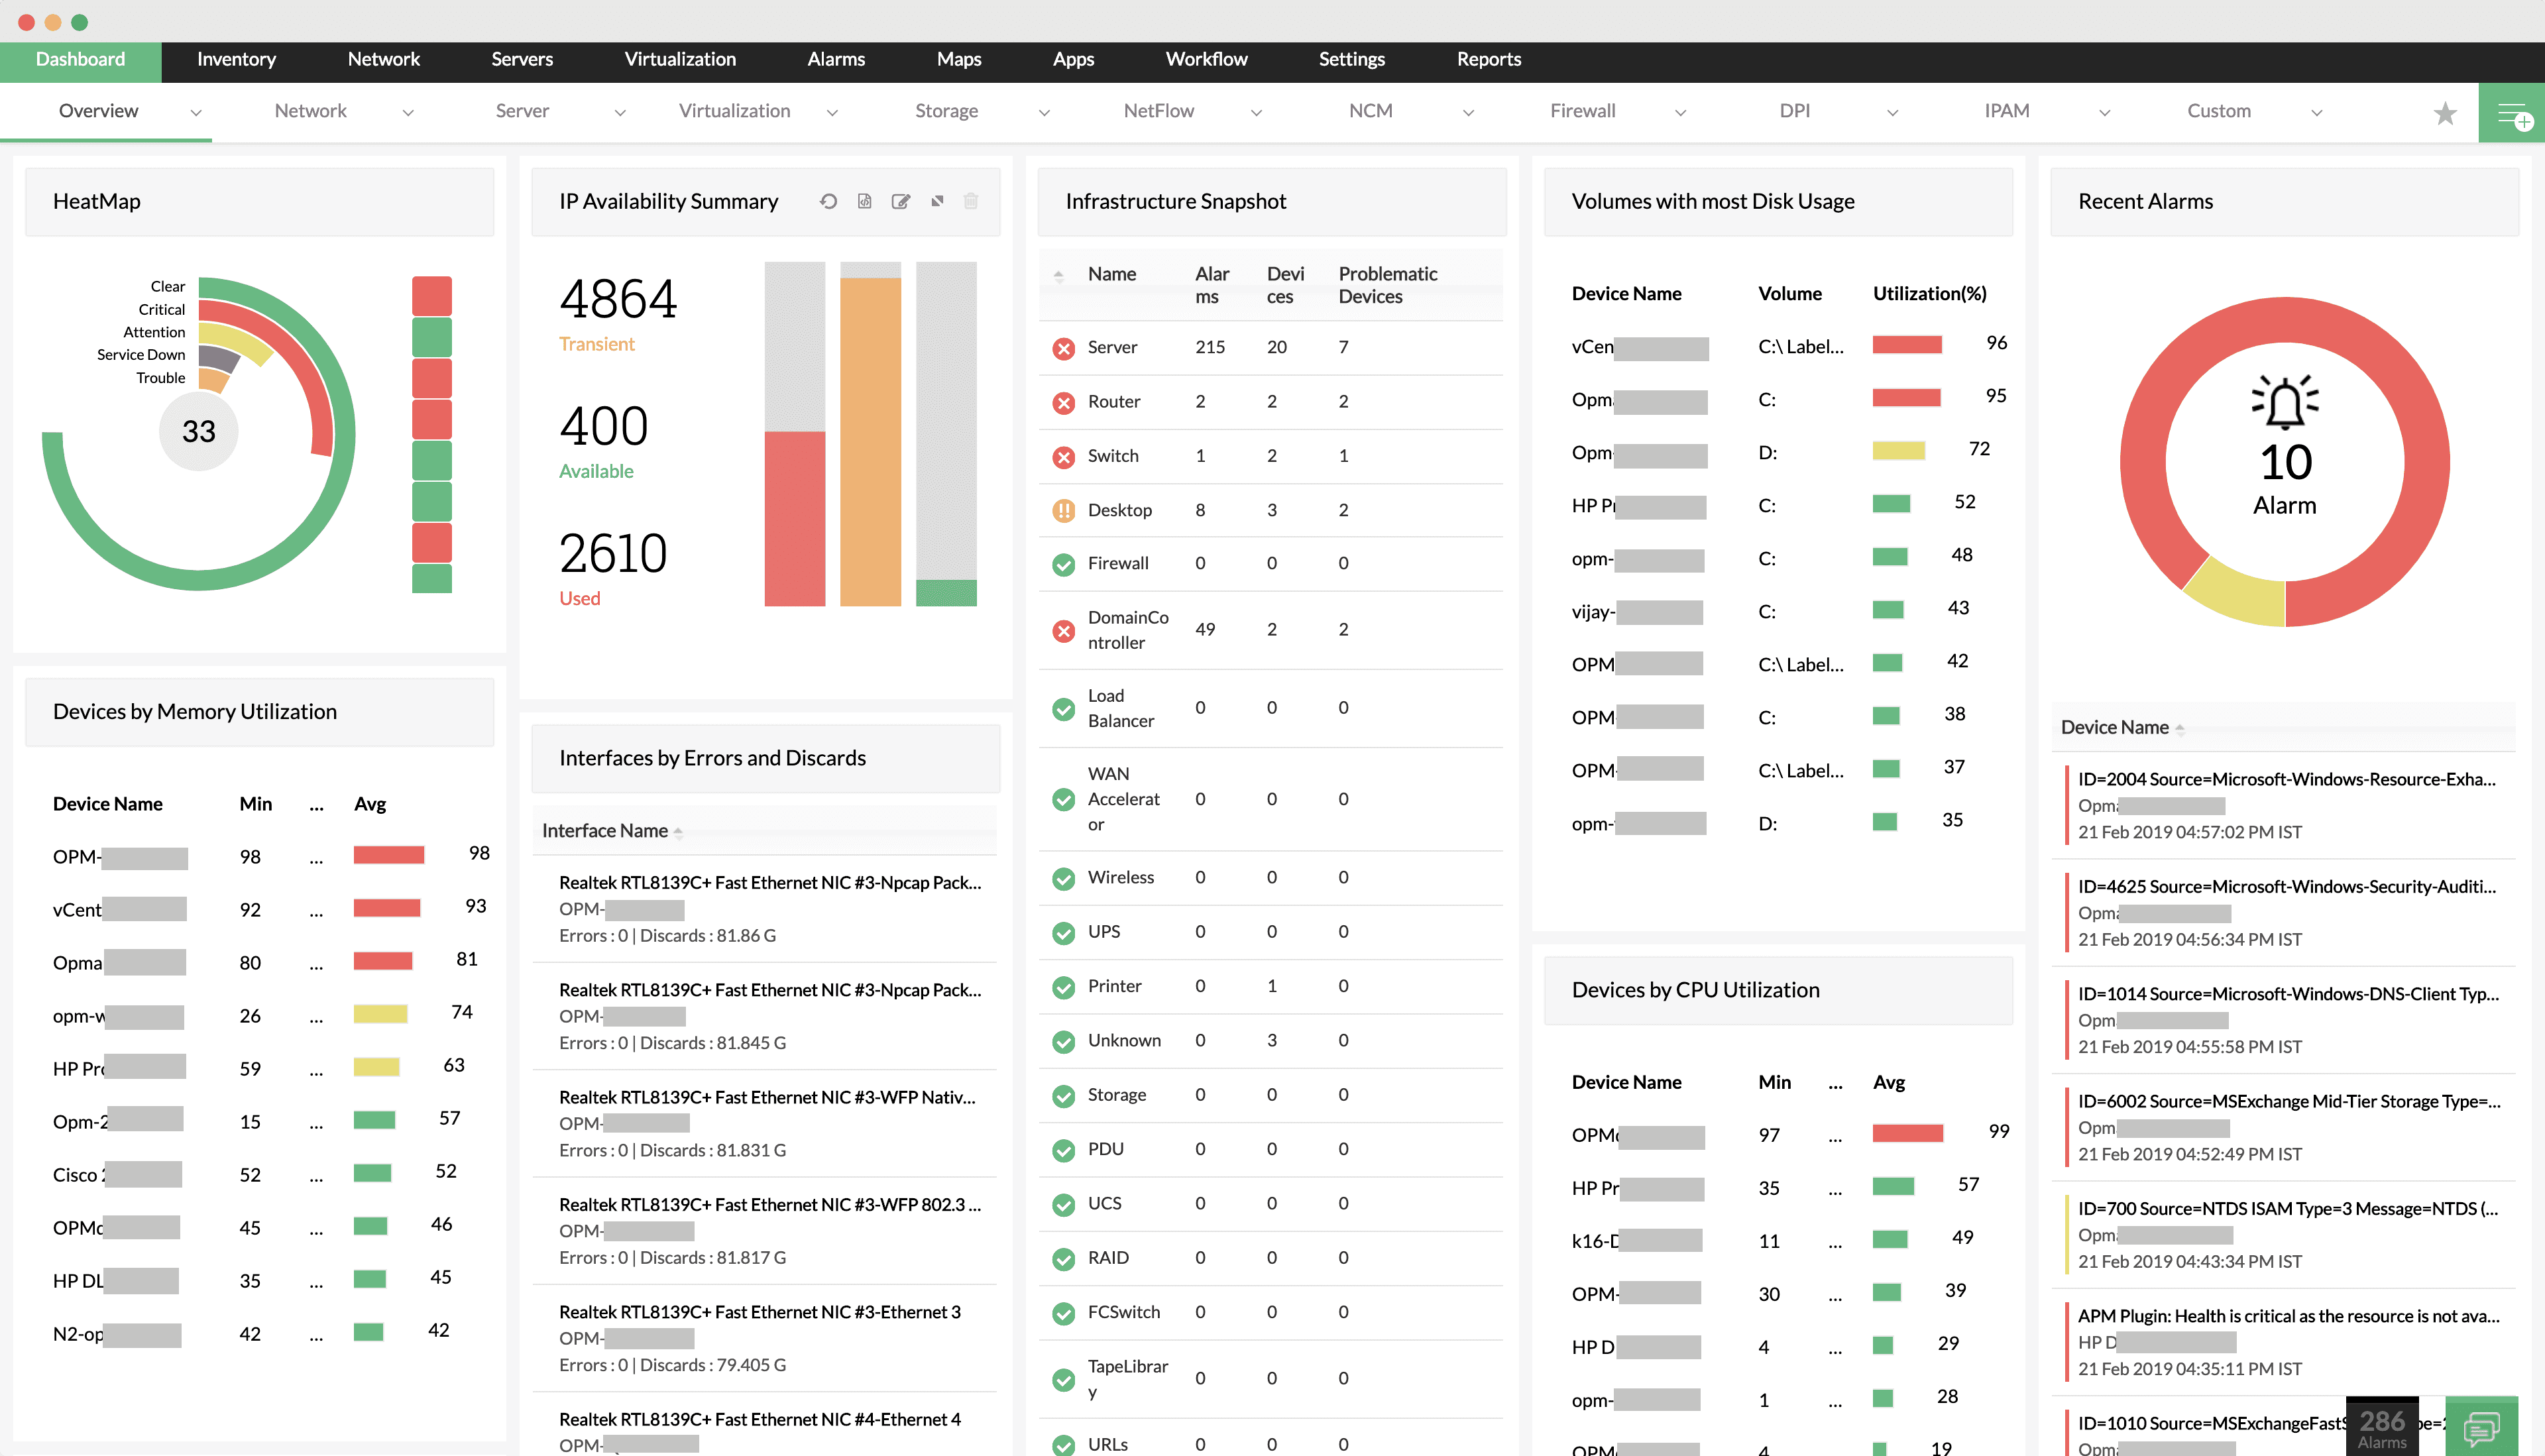
Key Features:
- Real-time monitoring and alerting
- Network configuration management
- Traffic analysis and bandwidth monitoring
- SNMP support
- Automated discovery
- IP address management
Pros: Quick deployment, intuitive interface, good value, ManageEngine integration
Cons: Limited free version (3 devices only), less customization, basic reporting
WhatsUp Gold
License: Commercial
Price: Paid / Free edition available
OS: Windows
Best for: Network visualization and mapping
WhatsUp Gold offers interactive network mapping with Layer 2/3 discovery. Strong visualization for mid-sized networks.
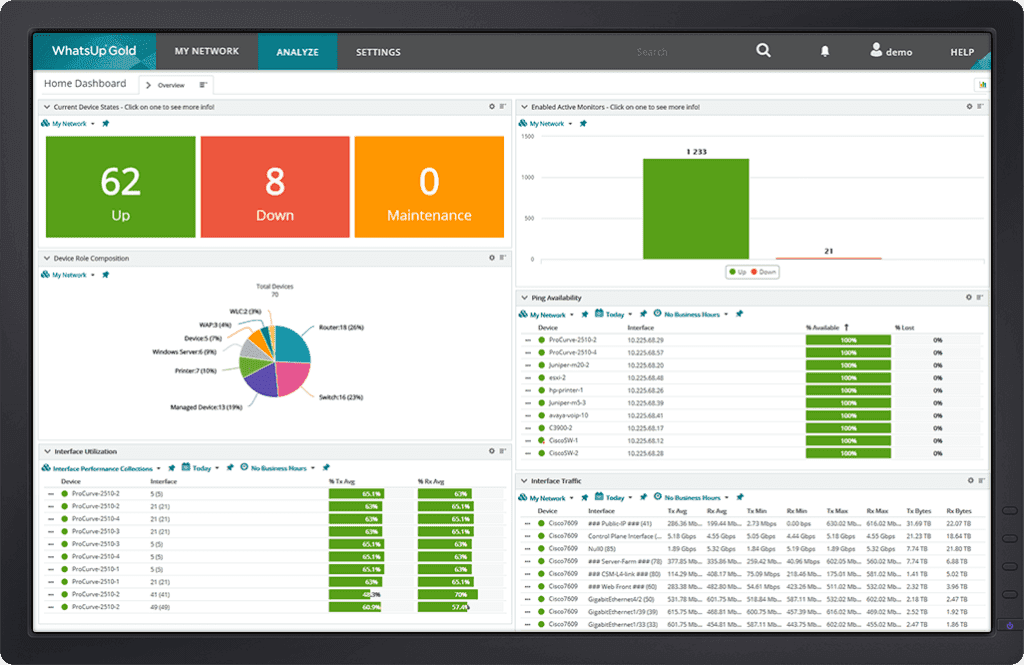
Key Features:
- Interactive network mapping
- Layer 2/3 network discovery
- SNMP monitoring
- Wireless monitoring
- Cloud resource monitoring
- Automated alerting
Pros: User-friendly interface, quick deployment, strong visualization, effective monitoring
Cons: Less scalable for large enterprises, fewer advanced features, limited customization
Dynatrace
License: Commercial
Price: Paid (starts $69/month)
OS: SaaS / On-premises
Best for: AI-powered monitoring, cloud-native
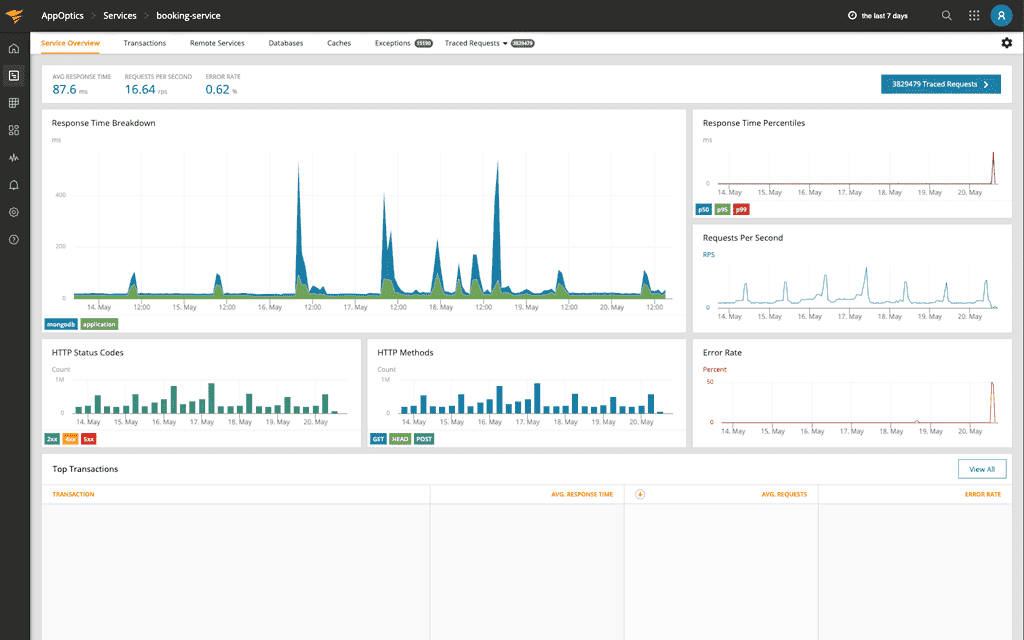
Dynatrace uses Davis® AI for automatic root cause analysis. Full-stack observability platform for modern cloud environments.
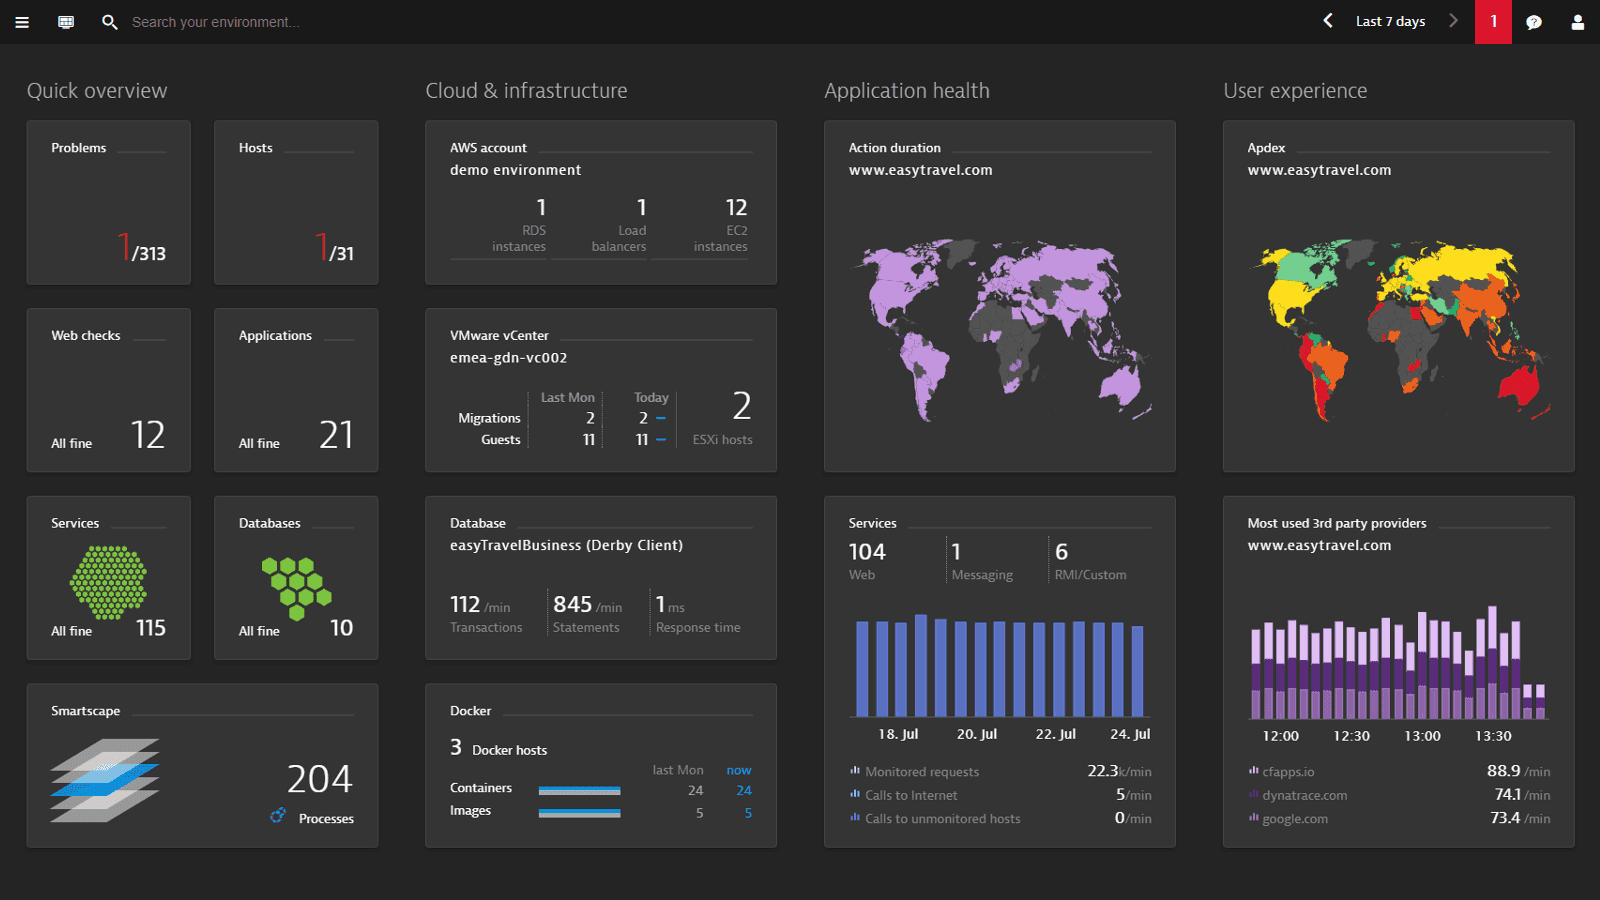
Key Features:
- AI-driven root cause analysis
- Full-stack monitoring
- Automated discovery
- Real-time topology
- Cloud-native architecture
- Advanced analytics
Pros: Powerful AI analytics, hybrid environment visibility, automated discovery, cloud-native
Cons: High price, complex, requires configuration, overwhelming breadth
Network Monitoring Tool Comparisons
Zabbix vs Nagios
Zabbix offers modern web UI and easier configuration with built-in graphing, while Nagios provides 5,000+ plugins and maximum customization. Zabbix better for teams wanting out-of-box features; Nagios for maximum flexibility and text-based configuration.
Choose Zabbix if: You want modern interface, easier setup, built-in dashboards, agent-based monitoring
Choose Nagios if: You need maximum flexibility, extensive plugins, text-based config, lightweight setup
PRTG vs SolarWinds NPM
PRTG uses sensor-based licensing (free up to 100 sensors), ideal for SMBs. SolarWinds offers deeper enterprise features (NetPath™, PerfStack™) but higher cost (~$2,995+). PRTG easier to deploy; SolarWinds better for complex enterprise networks.
Choose PRTG if: SMB budget, up to 100 sensors free, quick setup, Windows-friendly
Choose SolarWinds if: Enterprise scale, advanced features, budget available, deep monitoring needed
Open Source vs Commercial Tools
Open Source (Zabbix, Nagios, OpenNMS, LibreNMS):
- ✓ No licensing costs
- ✓ Full customization
- ✓ No device limits
- ✗ Requires technical expertise
- ✗ Self-support (community forums)
Commercial (PRTG, SolarWinds, ManageEngine):
- ✓ Professional support
- ✓ Easier deployment
- ✓ Polished interfaces
- ✗ Licensing costs
- ✗ Limited customization
Free Tools vs Paid Tools
Fully Free (no limits):
- Zabbix, Nagios Core, OpenNMS, LibreNMS, Icinga, Netdata
Freemium (limited free):
- PRTG (100 sensors free)
- ManageEngine (3 devices free)
Choose free if: Budget limited, in-house expertise available, no device limits needed
Choose paid if: Need support, faster deployment, less technical team, commercial SLA required
Conclusion
Network monitoring tools track device health, bandwidth, and performance across your infrastructure. Open source options (Zabbix, Nagios, LibreNMS) provide free enterprise features. Commercial tools (PRTG, SolarWinds, ManageEngine) offer easier setup with free tiers for small networks.
For complete system visibility, combine network monitoring with distributed tracing tools as part of your observability platform. An OpenTelemetry-native platform like Uptrace can unify application traces, metrics, and logs alongside your network monitoring data, giving you full-stack visibility from network devices to application code.
SRE teams use network monitoring data to track SLOs, set error budgets, and improve incident response. Choose based on your network size, budget, and technical expertise. Most tools offer free trials or limited free versions for evaluation before purchase.
You may also be interested in:
- Top Observability Tools
- Open Source Distributed Tracing Tools
- Infrastructure Monitoring Tools
- SRE Tools
FAQ
Is PRTG free? PRTG is free for up to 100 sensors. Beyond 100 sensors, you need a paid license starting at ~$1,750 for 500 sensors. The free version includes all features (SNMP, WMI, packet sniffing, dashboards, alerts) with no time limit, making it suitable for small to medium networks.
Is Zabbix free? Yes, Zabbix is completely free under GPL v2 license. There are no device limits, sensor limits, or feature restrictions. The LTS releases include all enterprise features (distributed monitoring, auto-discovery, event correlation, proxy HA) at no cost. Optional commercial support is available from Zabbix LLC.
What is SNMP monitoring? SNMP (Simple Network Management Protocol) is the standard protocol for monitoring network devices like routers, switches, firewalls, and servers. SNMP monitoring collects metrics (bandwidth, CPU, memory, errors) by querying device MIBs (Management Information Bases). Versions: SNMPv1/v2c (simple, no encryption) and SNMPv3 (encrypted, secure).
What are the best network monitoring tools for Windows? Best Windows tools: PRTG (Windows-native, 100 sensors free), SolarWinds NPM (enterprise Windows tool), ManageEngine OpManager (Windows/Linux, 3 devices free), WhatsUp Gold (Windows-only), and Zabbix (runs on Windows Server). PRTG is easiest for Windows admins; SolarWinds offers most enterprise features.
What are the best network monitoring tools for Linux? Best Linux tools: Zabbix (Linux-optimized, enterprise features), Nagios Core (Linux-native, plugins), LibreNMS (Linux-only, auto-discovery), OpenNMS (Linux/Java-based), Icinga (modern Linux tool), and Netdata (real-time Linux monitoring). All are open source and free. Zabbix offers richest features; LibreNMS easiest setup.
What metrics should network monitoring tools track? Critical metrics: bandwidth utilization (%), latency (ms), packet loss (%), interface status (up/down), error rates, CPU/memory usage of network devices, connection states, and response time. SNMP-based tools track these via OIDs. Advanced tools add flow data (NetFlow, sFlow), application response time, and service availability. For complete infrastructure visibility, combine network metrics with server and application monitoring.
How do I choose between agent-based and agentless monitoring? Agentless monitoring (SNMP, WMI) requires no software installation, easier for network devices (routers, switches) but limited depth. Agent-based monitoring (Zabbix agent, Nagios plugins) provides deeper metrics, custom checks, and faster data collection but requires agent installation/maintenance. Best practice: use agentless for network gear, agents for servers/applications. For application-level insights, combine network monitoring with log management to correlate network metrics with application performance and logs.