Prometheus Monitoring in 5 Minutes: Set Up Your First Alert
What Is Prometheus?
Prometheus is an open-source toolkit for systems monitoring and alerting, designed to collect and store metrics as time-series data. It was initially created at SoundCloud, and has since become essential in the cloud-native ecosystem, benefiting from a powerful query language, dependable alerting functionality, and a pull-based architecture.
Prometheus effectively monitors rapidly changing container environments, microservices, and cloud infrastructure. Its main benefits include:
- Pull-based collection: Eases network configuration and enhances security
- Strong query language (PromQL): Facilitates intricate data analysis
- Service discovery integration: Adapts automatically to evolving environments
- Multi-dimensional data model: Allows for effective segmentation and analysis of metrics
How Does Prometheus Monitoring Work?
Prometheus monitoring operates on a pull-based architecture, where the central Prometheus server periodically scrapes metrics from configured targets via HTTP. Each target exposes metrics at an endpoint (typically /metrics) in a simple text format that Prometheus understands. After collection, Prometheus stores these time-series data points in its local time-series database, allowing for efficient storage and fast retrieval. When you query metrics using PromQL (Prometheus Query Language), the server evaluates these expressions against its stored data and returns the results.
This architecture makes Prometheus particularly well-suited for dynamic cloud environments, as it discovers and adapts to changing infrastructure through service discovery mechanisms. Additionally, Prometheus includes a powerful alerting system that continuously evaluates alert rules and forwards firing alerts to Alertmanager for notification routing.
Let's get Prometheus started in just 5 minutes so we can enjoy these advantages.
Step 1: Installing Prometheus (1 minute)
First, download and extract the Prometheus binary package:
# Download Prometheus
wget https://github.com/prometheus/prometheus/releases/download/v2.53.4/prometheus-2.53.4.linux-amd64.tar.gz

# Extract the archive
tar xvfz prometheus-*.tar.gz
cd prometheus-*
Verify the installation by checking the Prometheus version:
./prometheus --version
You should see output similar to:
prometheus, version 2.53.4 (branch: HEAD, revision: e79ddd4a4fe9ad8da8394559b98b948dfc36a9de)
  build user:       root@50ed267cceda
  build date:       20250318-11:05:43
  go version:       go1.20.7
  platform:         linux/amd64
Step 2: Basic Configuration (1 minute)
Prometheus uses YAML for configuration. The default prometheus.yml file includes basic settings to monitor Prometheus itself, but we'll make a few adjustments:
global:
  scrape_interval: 15s
  evaluation_interval: 15s

scrape_configs:
  - job_name: 'prometheus'
    static_configs:
      - targets: ['localhost:9090']

  - job_name: 'node'
    static_configs:
      - targets: ['localhost:9100']
This configuration:
- Sets global scrape and evaluation intervals to 15 seconds
- Configures monitoring for Prometheus itself
- Adds a job to monitor system metrics via node_exporter (which we'll install next)
Save this to prometheus.yml in the Prometheus directory.
Step 3: Starting the Prometheus Server (30 seconds)
Launch Prometheus with:
./prometheus --config.file=prometheus.yml
Access the Prometheus web UI by opening a browser and navigating to:
http://localhost:9090
You should see the Prometheus interface, confirming successful setup:
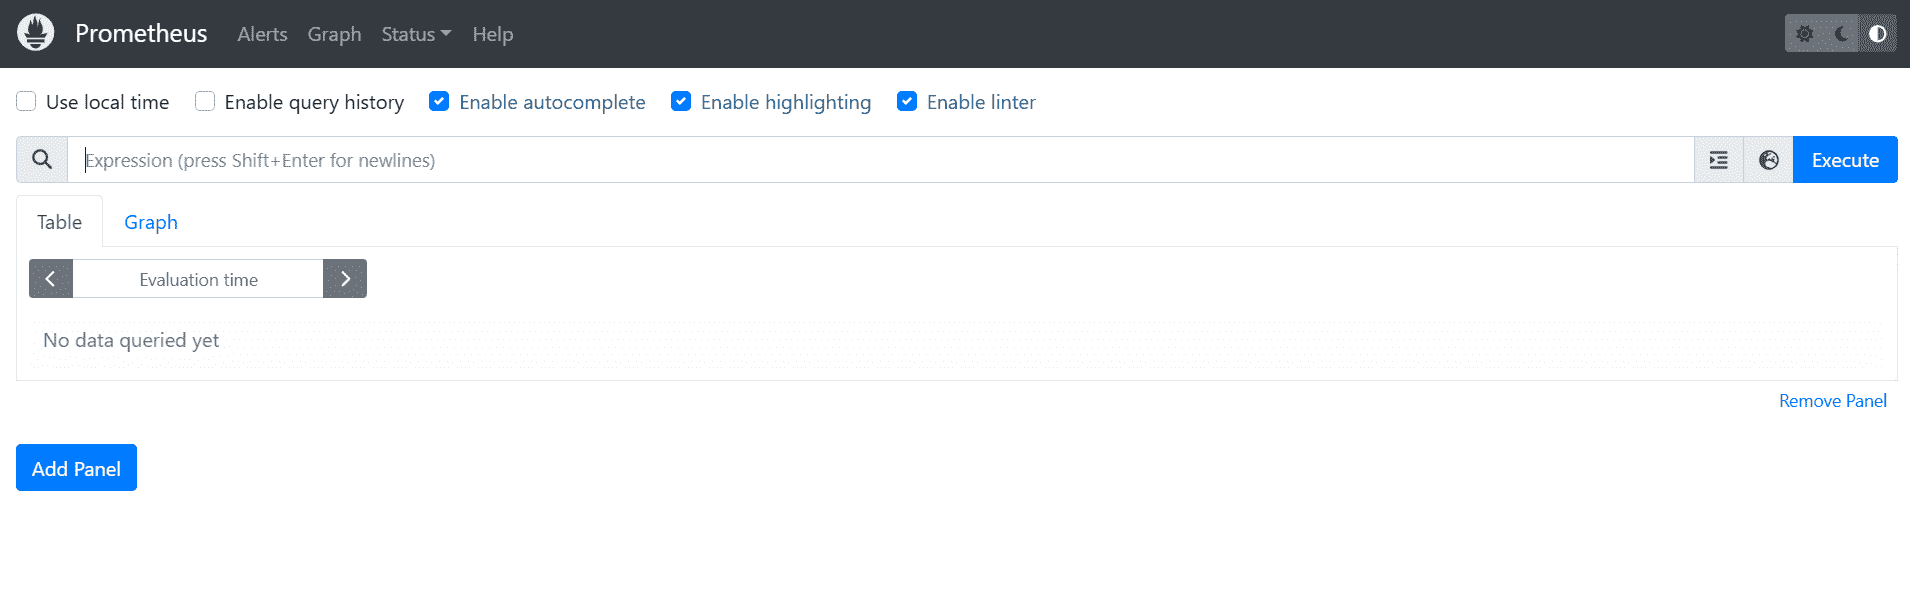
Navigate to Status > Targets to verify that Prometheus is successfully scraping itself. The "prometheus" target should show as "UP".
Step 4: Adding Your First Exporter (1 minute)
To gather system metrics, we'll install node_exporter:
# Download node_exporter
wget https://github.com/prometheus/node_exporter/releases/download/v1.9.1/node_exporter-1.9.1.linux-amd64.tar.gz

# Extract and set up
tar xvfz node_exporter-*.tar.gz
cd node_exporter-*

# Start node_exporter (in a new terminal)
./node_exporter
Verify node_exporter is running:
curl http://localhost:9100/metrics
This should output numerous system metrics. To make Prometheus collect these metrics, we already added the node job to our configuration in step 2.
Reload Prometheus configuration without restarting:
curl -X POST http://localhost:9090/-/reload
Check the Prometheus targets page again to confirm the "node" target shows as "UP".
Step 5: Creating Your First Alert (1 minute)
Create a file named alerts.yml with a simple high CPU usage alert:
groups:
  - name: example
    rules:
      - alert: HighCPULoad
        expr: 100 - (avg by(instance) (irate(node_cpu_seconds_total{mode="idle"}[5m])) * 100) > 80
        for: 5m
        labels:
          severity: warning
        annotations:
          summary: 'High CPU load (instance {{ $labels.instance }})'
          description: "CPU load is > 80%\n  VALUE = {{ $value }}\n  LABELS = {{ $labels }}"
Update prometheus.yml to include the alert rules:
global:
  scrape_interval: 15s
  evaluation_interval: 15s

rule_files:
  - 'alerts.yml'

scrape_configs:
  - job_name: 'prometheus'
    static_configs:
      - targets: ['localhost:9090']

  - job_name: 'node'
    static_configs:
      - targets: ['localhost:9100']
Reload Prometheus:
curl -X POST http://localhost:9090/-/reload
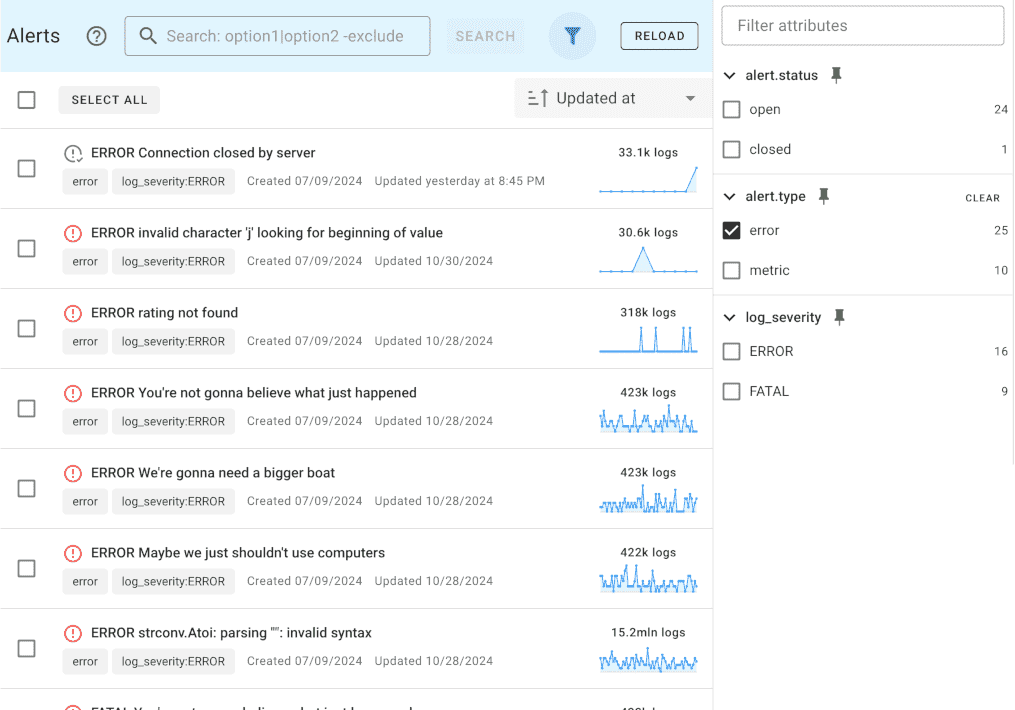
Test your alert by navigating to the Alerts page in the Prometheus UI, where you should see your newly created HighCPULoad alert.
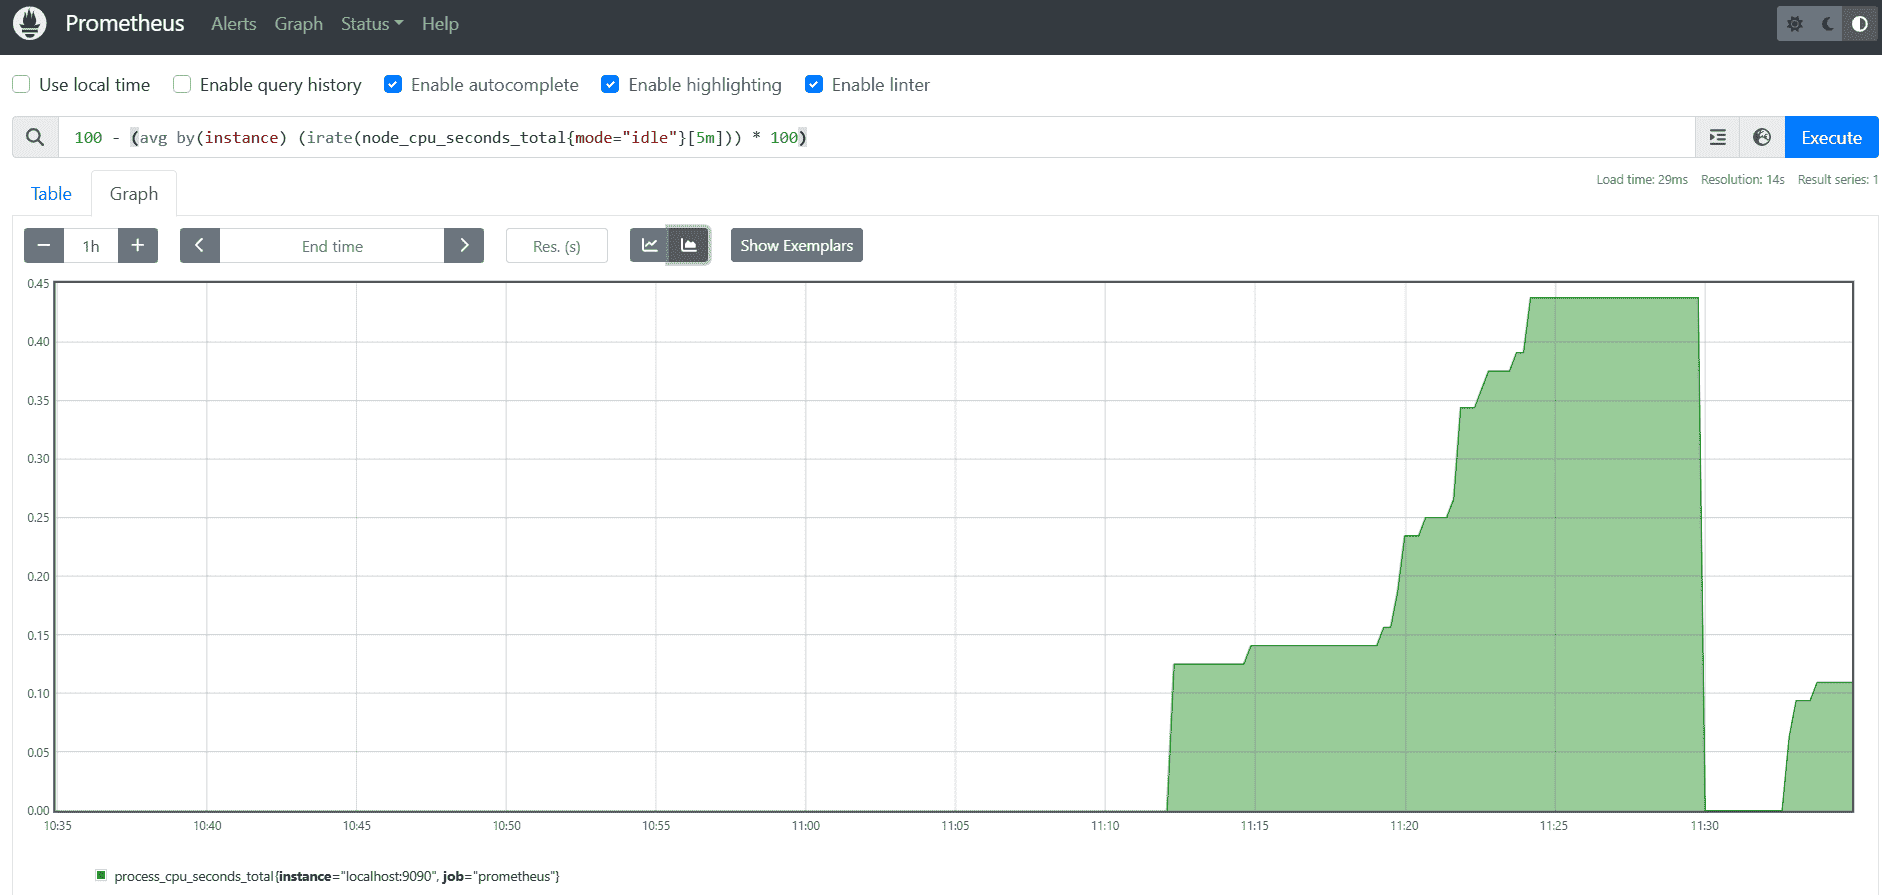
Step 6: Visualizing with Prometheus Expression Browser (30 seconds)
The Prometheus UI includes an expression browser for running queries. Navigate to the Graph tab and try these basic PromQL queries:
- View CPU usage:
100 - (avg by(instance) (irate(node_cpu_seconds_total{mode="idle"}[5m])) * 100)
- Check memory usage:
node_memory_MemTotal_bytes - node_memory_MemFree_bytes - node_memory_Buffers_bytes - node_memory_Cached_bytes
- Monitor disk usage:
node_filesystem_avail_bytes / node_filesystem_size_bytes * 100
Switch between Graph and Table views to see different representations of your metrics:
Conclusion
Congratulations! In just 5 minutes, you've set up a functional Prometheus monitoring system that:
- Collects system metrics using node_exporter
- Provides real-time visualization of those metrics
- Alerts you when CPU usage exceeds thresholds
What you've accomplished is a basic but solid foundation for monitoring. As your needs grow, Prometheus can scale with you through additional exporters, service discovery, federation, and integration with visualization tools like Grafana.
Next steps to enhance your monitoring:
- Add more exporters for specific applications (MySQL, Redis, Nginx, etc.)
- Set up Alertmanager for notification routing
- Implement Grafana for more advanced visualizations
- Explore recording rules for complex, pre-computed metrics
- Deploy Prometheus with high availability
Taking Your Monitoring to the Next Level with Uptrace
While Prometheus provides excellent metrics collection and alerting, modern observability requires more. Uptrace complements Prometheus by providing a unified platform that combines metrics, traces, and logs for complete visibility into your systems.
Uptrace enhances your Prometheus monitoring with:
- Unified observability: Combine metrics from Prometheus with distributed tracing and logs
- Enhanced context: Connect metrics to specific services, endpoints, and requests
- Advanced visualization: Create comprehensive dashboards that tell the complete story
- Simplified troubleshooting: Correlate Prometheus metrics with traces to quickly identify root causes
Getting started with Uptrace and Prometheus is straightforward. Explore these resources to learn more:
- Ingesting Prometheus metrics into Uptrace - Learn how to forward your Prometheus metrics to Uptrace for unified analysis
- Prometheus and OpenTelemetry Collector Integration - Detailed guide on integrating Prometheus with OpenTelemetry
- How to Set Up Prometheus for Docker - Comprehensive guide for monitoring Docker environments
- Top 10 Prometheus Alternatives in 2025 - Explore other monitoring options and how they compare
By combining the power of Prometheus monitoring with Uptrace's observability platform, you can move beyond basic metrics to gain comprehensive insights into your entire infrastructure and application stack.
Ready to take your monitoring to the next level? Try Uptrace today.
FAQ
- What is Prometheus and how does it differ from other monitoring tools? Prometheus is an open-source monitoring and alerting toolkit designed for reliability and scalability. Unlike traditional monitoring tools that use a push model, Prometheus uses a pull-based architecture where it scrapes metrics from instrumented targets. This approach simplifies firewall configuration, reduces network load, and enables better control over monitoring frequency and data collection.
- Is Prometheus suitable for monitoring containerized environments? Prometheus excels at monitoring dynamic container environments like Kubernetes and Docker. Its service discovery mechanisms automatically detect new containers and instances, making it ideal for ephemeral infrastructure. Prometheus was designed with cloud-native architectures in mind and integrates seamlessly with container orchestration platforms through built-in service discovery adapters.
- What is PromQL and why is it powerful? PromQL (Prometheus Query Language) is Prometheus' specialized time-series query language that allows for complex data selection, aggregation, and manipulation. Its power lies in the ability to perform mathematical operations across metrics, filter by multiple dimensions using labels, and calculate rates and trends over time windows. This flexibility enables sophisticated alerting conditions and detailed performance analysis without requiring external processing.
- How does Prometheus handle alerting? Prometheus generates alerts through a two-step process: first, alerting rules in Prometheus servers evaluate PromQL expressions to determine alert conditions. When triggered, these alerts are sent to Alertmanager, which handles grouping, inhibition (suppressing notifications when certain other alerts are active), silencing, and routing notifications to email, Slack, PagerDuty, and other systems. This separation of concerns creates a flexible and powerful alerting pipeline.
- What are Prometheus exporters and which ones should I use? Exporters are applications that convert metrics from existing systems into the Prometheus format. Essential exporters include node_exporter (system metrics), blackbox_exporter (probing endpoints), and specific exporters for databases and applications like MySQL, PostgreSQL, Redis, and NGINX. The choice of exporters depends on your infrastructure components, with the node_exporter being the most fundamental for monitoring host systems.
- How does Prometheus handle data storage and retention? Prometheus stores time-series data in a custom, efficient database optimized for time-series metrics on local disk. By default, data retention is set to 15 days, but this is configurable based on available storage and historical data needs. For long-term storage, Prometheus supports remote write APIs that can send data to systems like Thanos, Cortex, or cloud-based time-series databases, allowing for extended retention without affecting performance.
- What's the difference between Prometheus and Grafana? Prometheus and Grafana serve complementary roles: Prometheus collects and stores metrics, evaluates rules, and triggers alerts, while Grafana focuses on visualization and dashboard creation. Although Prometheus has a basic web UI for queries and graphs, Grafana provides more sophisticated visualization capabilities, multi-source dashboards, and enhanced sharing options. Most production environments use both tools together, with Prometheus as the data source and Grafana for dashboards.
- How does Prometheus scale for large environments? For large-scale deployments, Prometheus typically uses a federated architecture where multiple Prometheus servers monitor different segments of infrastructure, and a central Prometheus instance scrapes aggregated metrics from these servers. Alternatively, solutions like Thanos and Cortex provide horizontal scalability, long-term storage, and high availability. These systems distribute the storage and query workload across multiple nodes while maintaining Prometheus' data model and query capabilities.
- Can Prometheus monitor Windows servers? Yes, Prometheus can monitor Windows servers through the Windows exporter (formerly called WMI exporter). This exporter exposes Windows-specific metrics including CPU, memory, disk, network interface performance, service states, and Windows-specific measurements like .NET performance counters. While Prometheus itself typically runs on Linux, it can scrape metrics from any platform with an appropriate exporter.
- How does Prometheus monitoring compare to traditional SNMP monitoring? Prometheus offers several advantages over SNMP monitoring: it provides better support for dimensional data through labels, has a more powerful query language, integrates better with modern infrastructure, and offers built-in alerting. However, SNMP may still be necessary for network devices that don't expose HTTP endpoints. In practice, many organizations use Prometheus alongside SNMP monitoring, with SNMP exporters acting as bridges between these worlds.
- What's the difference between white-box and black-box monitoring in Prometheus? White-box monitoring collects internal metrics from instrumented applications (like request counts, latencies, queue lengths) giving visibility into system internals. Black-box monitoring tests system behavior externally through probing endpoints and measuring responses. Prometheus supports both approaches: white-box through various exporters and client libraries, and black-box through the blackbox_exporter. A comprehensive monitoring strategy combines both for complete system observability.
- How does Prometheus integrate with Uptrace? Prometheus integrates with Uptrace through OpenTelemetry Collector, which can scrape Prometheus metrics and forward them to Uptrace. This integration enhances Prometheus data by connecting metrics with traces and logs, providing context that helps troubleshoot issues faster. Uptrace maintains Prometheus' data model while adding the ability to correlate metrics with specific requests and services, delivering a more comprehensive observability solution that builds upon Prometheus' strengths.
- What are recording rules and when should I use them? Recording rules pre-compute frequently needed or computationally expensive PromQL expressions and save the results as new time series. They should be used when queries are complex and frequently executed (especially in dashboards), when calculations need to be referenced in multiple places, or when you need to maintain historical data for expressions that would otherwise be calculated on-the-fly. Recording rules significantly improve query performance and reduce system load.
- How secure is Prometheus by default? Out of the box, Prometheus has minimal security features and assumes it operates in a trusted network. It doesn't provide authentication or encryption for its web interface or metrics collection endpoints. For production environments, it's recommended to use reverse proxies (like Nginx) to add authentication, implement network-level security (firewalls, VPNs), and consider tools like Thanos or Cortex which offer more security features. Always restrict access to the Prometheus server to trusted networks.
- Can Prometheus replace APM (Application Performance Monitoring) tools? While Prometheus excels at collecting and alerting on metrics, it lacks some APM capabilities like distributed tracing, code-level profiling, and transaction monitoring. For complete observability, Prometheus should be combined with tracing tools (like Jaeger or Zipkin) and log aggregation systems. Unified observability platforms like Uptrace complement Prometheus by adding these capabilities while preserving its powerful metrics collection, creating a more comprehensive monitoring solution.