Top 7 Sentry Alternatives for Error Tracking in 2025: Open-Source & Self-Hosted
Error tracking remains fundamental to application reliability, yet developers are increasingly questioning Sentry's dominance in this space. Recent pricing adjustments and temporary policy changes around AI training data have prompted engineering teams to reassess their monitoring strategies. While Sentry retracted its controversial terms, the incident highlighted broader concerns about vendor dependency and data control. This analysis examines 7 proven Sentry alternatives for 2025, providing the technical insights needed to select the right error tracking solution for your infrastructure requirements.
Why Move to Alternatives
Sentry remains a capable error tracking platform, but several factors have driven teams to explore other options:
Trust and Compliance: The temporary AI training policy changes, while reversed, highlighted concerns about data governance in regulated environments where HIPAA and GDPR compliance are non-negotiable.
Cost Predictability: Event-based pricing creates budget uncertainty for high-volume applications, with costs often scaling faster than expected as traffic grows.
Feature Scope: Pure error tracking tools increasingly compete against full-stack observability platforms that bundle distributed tracing, infrastructure monitoring, and centralized logging.
Platform Independence: Engineering teams prioritize data portability and multi-vendor strategies to avoid operational dependencies on single providers.
Sentry Open Source Alternative
Uptrace
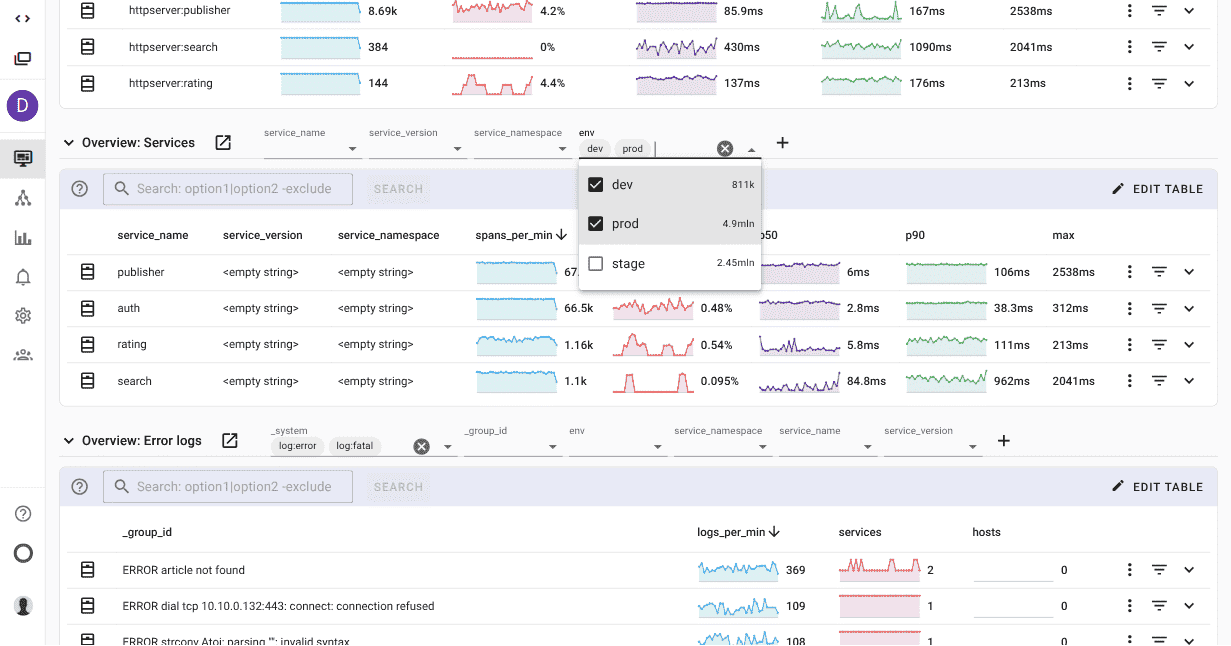
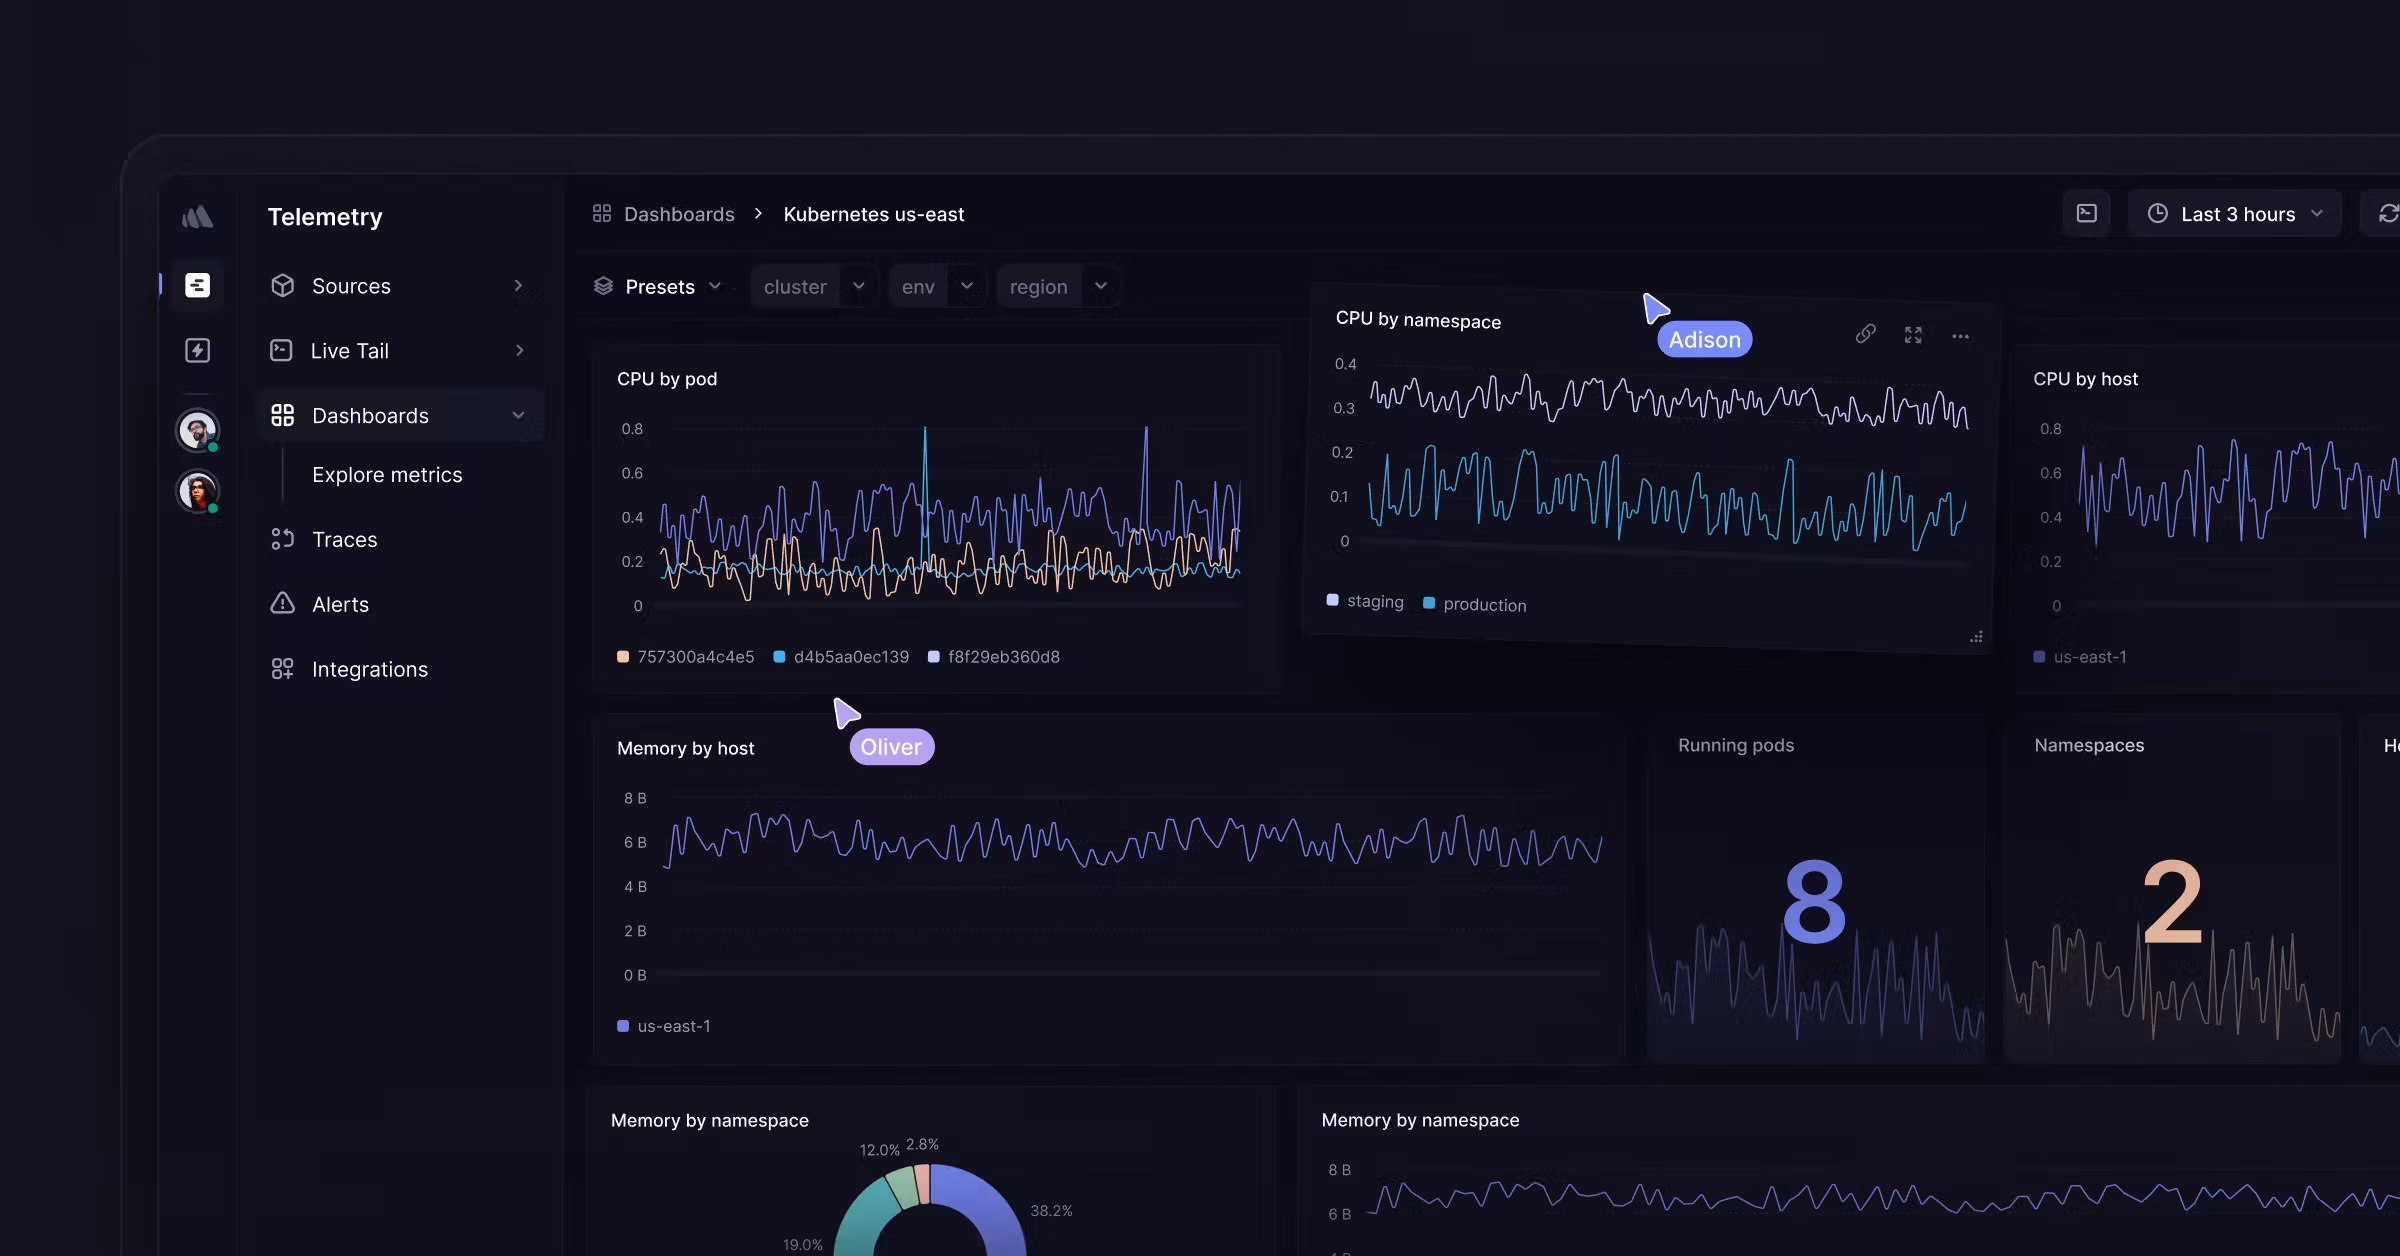
Uptrace is an All-in-one free OpenTelemetry APM and observability platform built on OpenTelemetry, designed for modern cloud-native environments. As a self-hosted Sentry alternative, it combines distributed tracing, metrics, and logs into a unified interface.
Why Uptrace?:
- OpenTelemetry Native: Seamlessly integrates with the industry-standard OTel framework, ensuring compatibility with 300+ technologies without vendor lock-in.
- Cost Efficiency: By leveraging ClickHouse for storage, Uptrace achieves 10–20x data compression, slashing storage costs by up to 80% compared to traditional solutions.
- Complete Data Ownership: Self-hosted deployment ensures full control over sensitive data with on-premises options.
Key Features:
- Distributed Tracing: Map request flows across microservices and identify bottlenecks with flame graphs
- Unified Observability: Correlate traces with Prometheus metrics and logs in a single UI
- Sentry SDK Support: Directly supports Sentry SDK, allowing easy migration while adding comprehensive observability
Relevance:
- Edge & IoT Ready: Lightweight agents for monitoring distributed edge devices
- AI-Driven Insights: Automatically detects anomalies in latency, errors, and SLA breaches
Pricing:
- Open-Source: Free forever for self-hosted deployments (AGPLv3 license)
- Enterprise Cloud: Transparent pricing without per-host or per-user charges
Pros:
- ✅ Complete data ownership and privacy
- ✅ Native OpenTelemetry support with no vendor lock-in
- ✅ 4.8/5 stars on GitHub with active community
Cons:
- ❌ Requires basic DevOps skills for deployment
- ❌ Smaller ecosystem compared to established players
Best For:
- Teams prioritizing data sovereignty and cost transparency
- Organizations embracing OpenTelemetry standards
- Companies needing comprehensive observability beyond error tracking
Self Hosted Sentry Alternative
Telebugs
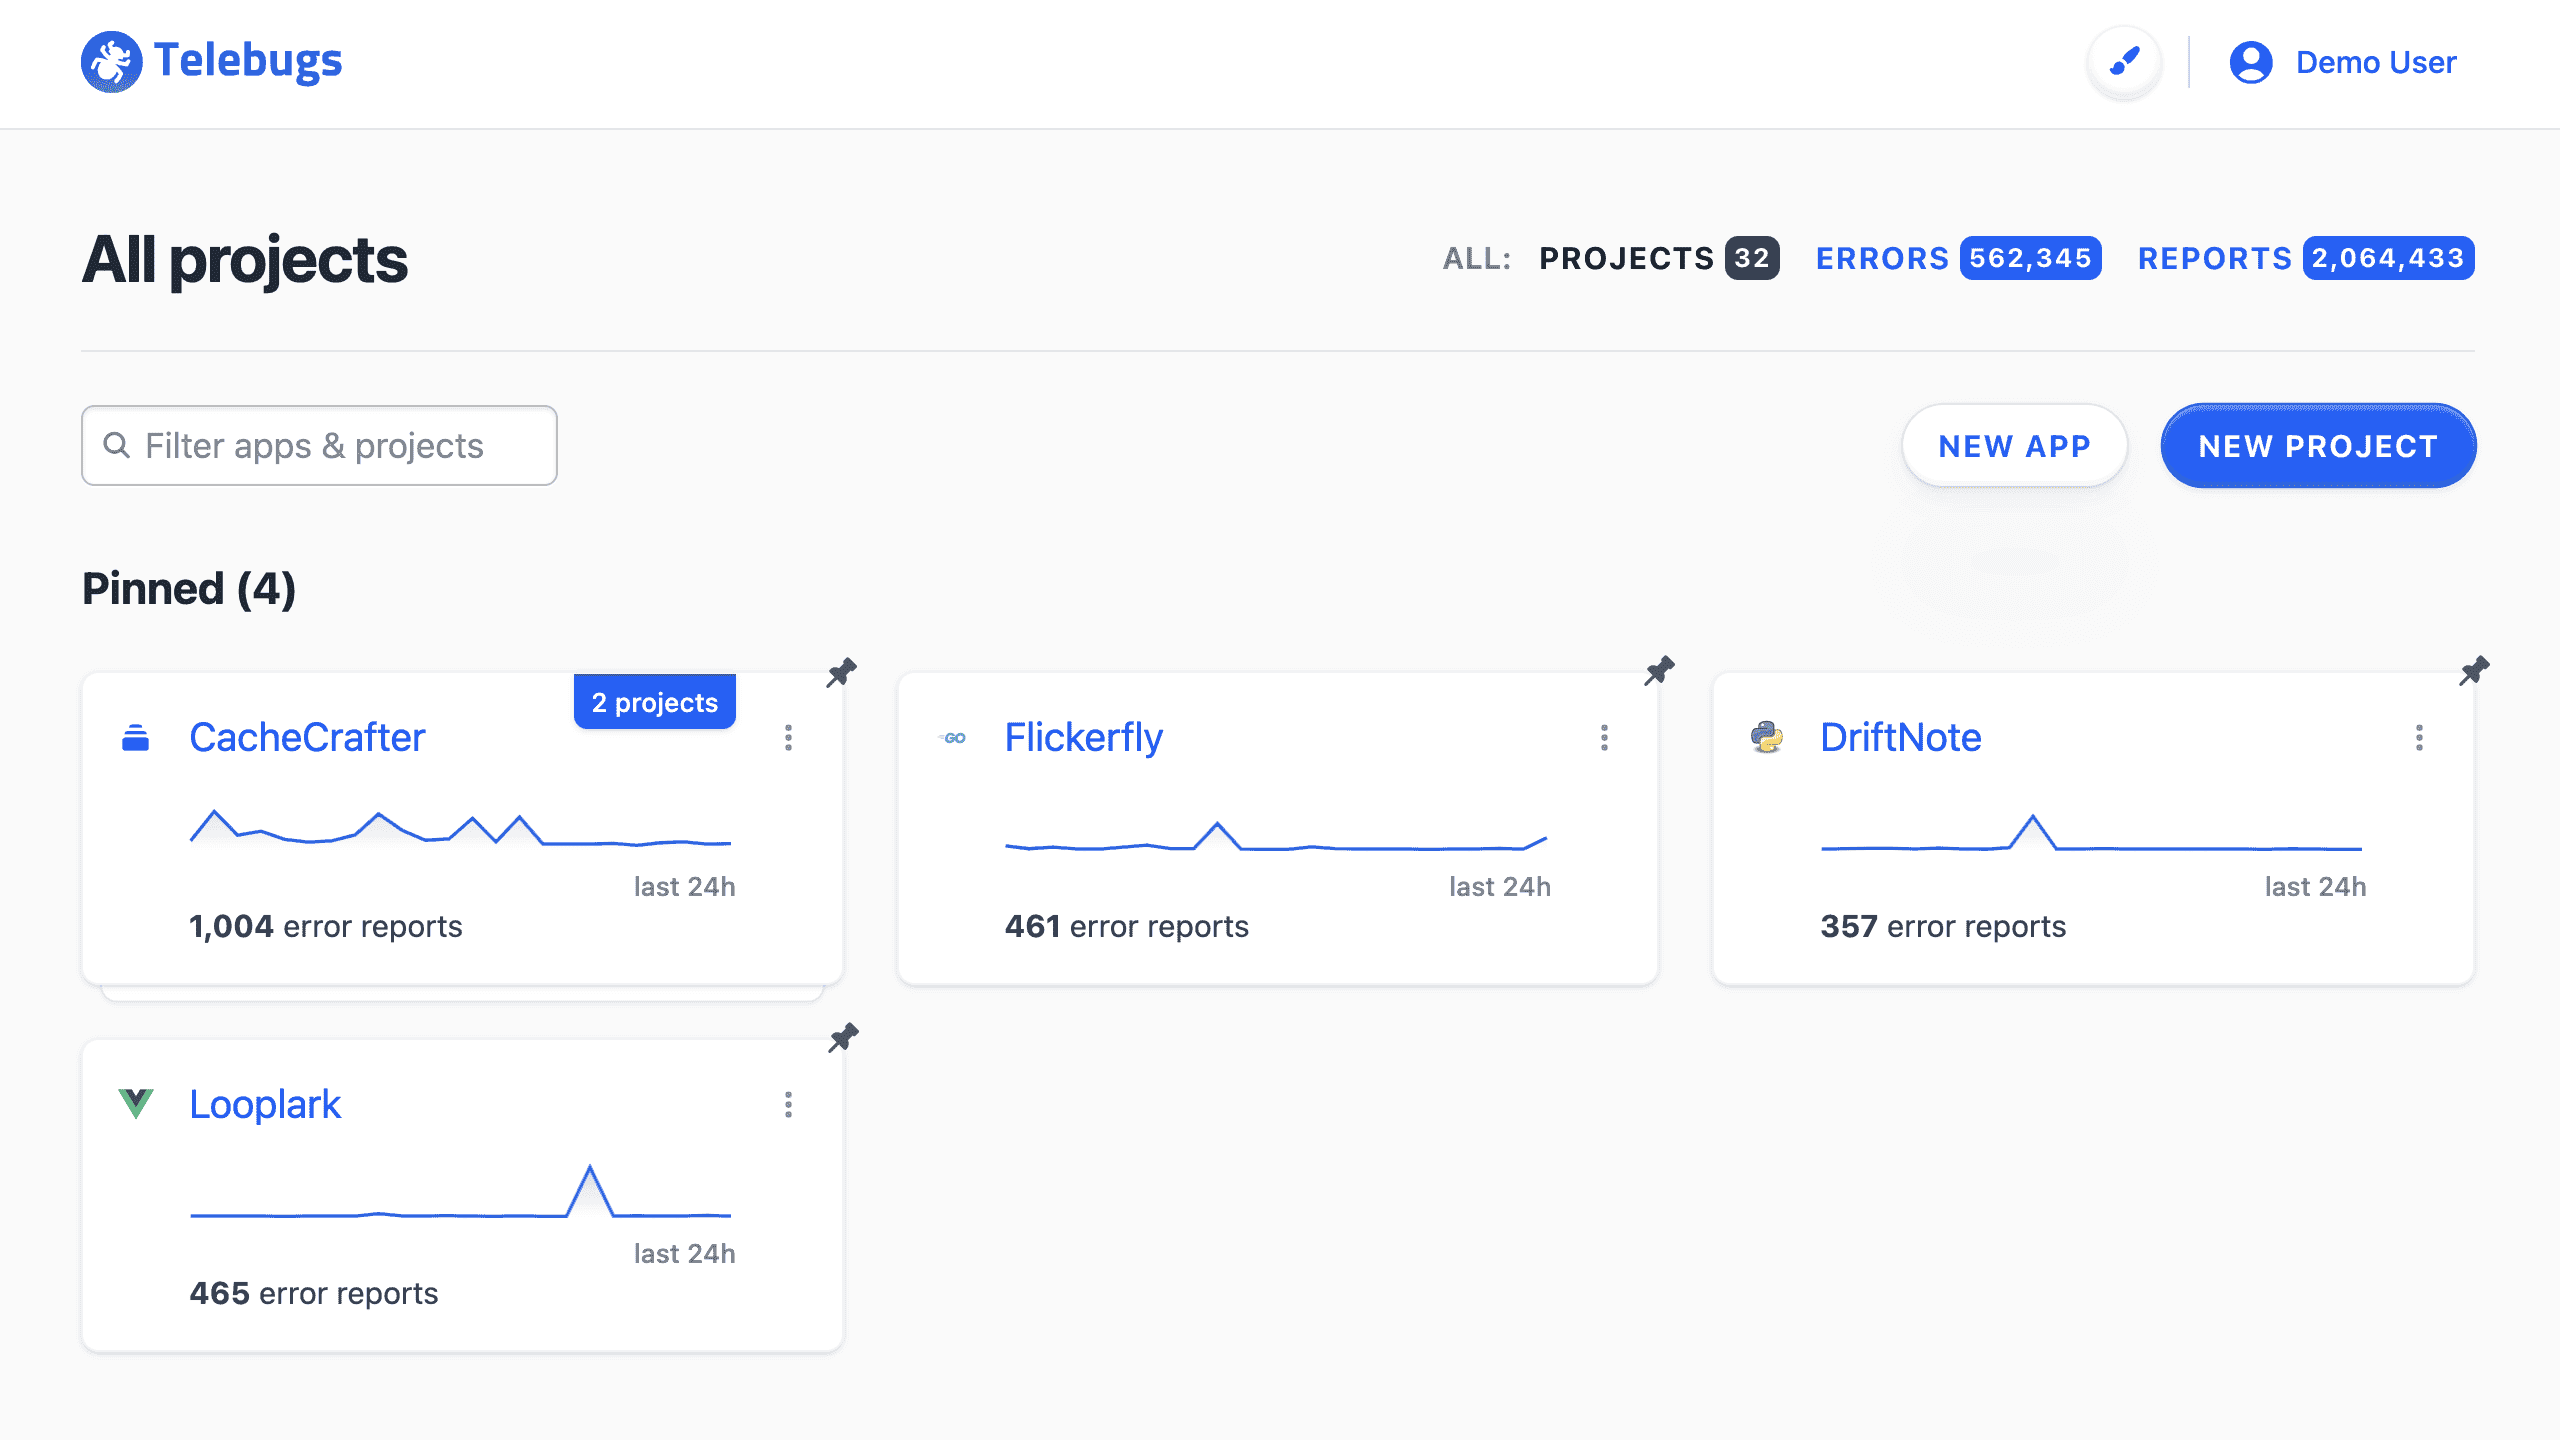
Telebugs is a self-hosted Sentry alternative designed as a straightforward, installable error tracking system. It's Sentry SDK compatible, runs in a single Docker container, and offers full data control with a one-time purchase model instead of recurring subscriptions.
Key Features:
- Single Container Deployment: Runs via one Docker image with easy setup
- Sentry SDK Compatibility: Works with existing Sentry libraries and supports React, Next.js, Ruby on Rails, Laravel, Go, and more
- Resource Efficient: Operates on minimal hardware (1GB RAM, 1 CPU core) and handles high volumes of events
- Instant Notifications: Email or push alerts, plus PWA support for mobile access
- Intelligent Error Grouping: Organizes errors with enhanced backtraces, breadcrumbs, and context for better debugging
- Automatic Updates: Updates automatically, reducing the maintenance burden
- No Limits: Unlimited events, users, or projects without quotas
Pricing:
- Self-Hosted: One-time payment of $499 per installation (one domain)
- No Recurring Fees: Own the code forever, with no subscriptions or hidden costs
Pros:
- ✅ Extremely easy installation (one command, ~5 minutes)
- ✅ Cost savings over subscription-based tools like Sentry
- ✅ Strong privacy and data control (on-premise, GDPR/CCPA friendly)
- ✅ Lightweight and bloat-free, focused solely on error tracking
- ✅ Broad compatibility and customization options
Cons:
- ❌ Requires upfront investment compared to free tiers
- ❌ Requires self-hosting and basic server management (Docker needed)
- ❌ No APM, performance monitoring, or advanced observability features
Best For:
- Development teams avoiding subscription fatigue
- Privacy-focused organizations in regulated industries (e.g., healthcare, finance)
- Bootstrapped companies or agencies seeking long-term cost efficiency
- Users wanting a simple, owned alternative to SaaS error trackers
GlitchTip
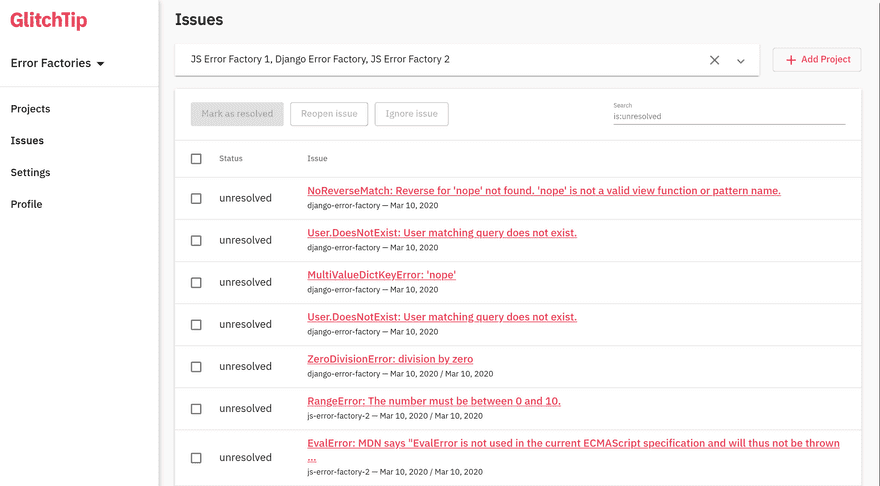
GlitchTip is an open-source error tracking platform that's Sentry API compatible, making it a true drop-in replacement. It's designed to be simpler to run and maintain than self-hosted Sentry while using the same client SDKs.
Key Features:
- Sentry SDK Compatibility: Use existing Sentry SDKs without code changes
- Simplified Architecture: Only requires 4 components (backend, worker, Redis, PostgreSQL) vs Sentry's dozen+ services
- Error Tracking: Real-time error detection, grouping, and alerting
- Performance Monitoring: Basic performance insights and uptime monitoring
Pricing:
- Open-Source: Free self-hosted version
- Cloud Hosting: Starting at $15/month for 100K errors
Pros:
- ✅ Direct Sentry replacement with same SDKs
- ✅ Much simpler deployment than self-hosted Sentry
- ✅ Lightweight and privacy-focused
- ✅ Cost-effective for high-volume applications
Cons:
- ❌ Limited advanced features compared to full Sentry
- ❌ Smaller community and ecosystem
- ❌ Basic UI compared to commercial solutions
Best For:
- Teams migrating from Sentry seeking simpler self-hosting
- Organizations prioritizing data privacy and control
- Cost-conscious teams with high error volumes
Sentry Free Alternative
Rollbar
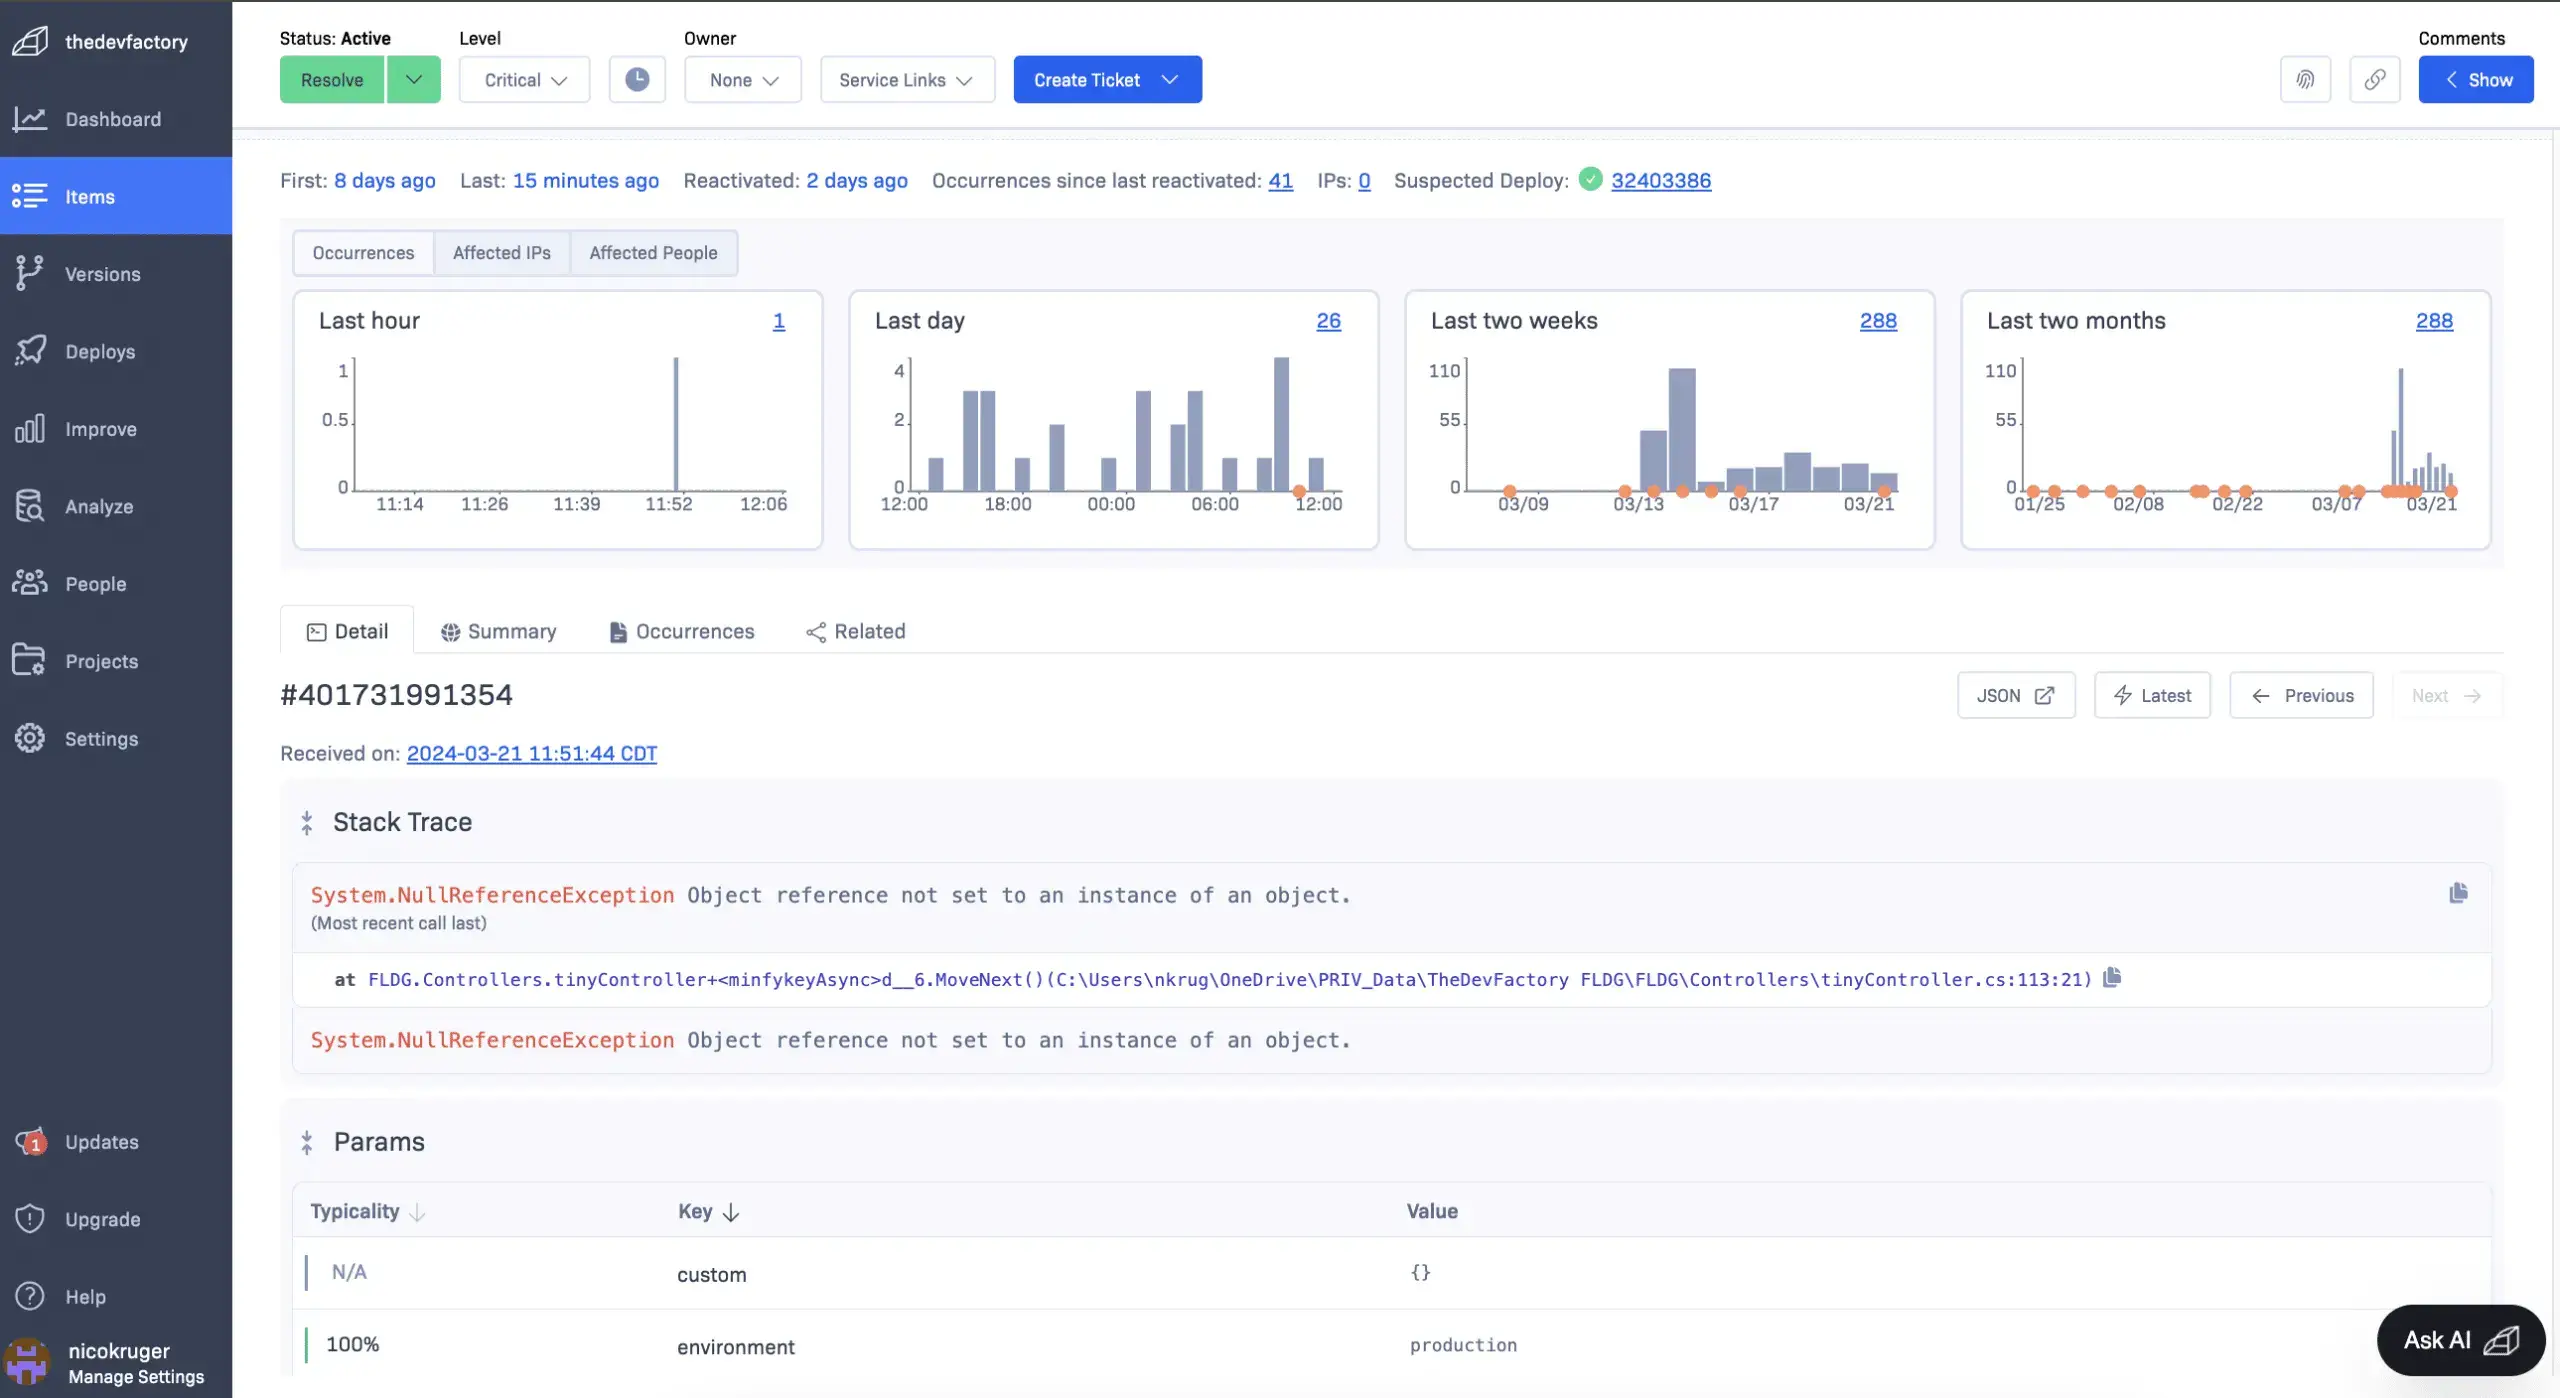
Rollbar helps teams find and fix errors fast through real-time error tracking, issue management, and AI-assisted workflows. It focuses specifically on making error resolution as efficient as possible.
Key Features:
- Real-time Error Detection: Automatic grouping and issue tracking with intelligent deduplication
- Customizable Alerting: Notifications delivered where your team works (Slack, email, webhooks)
- Detailed Error Context: Stack traces, code snippets, and environment data for faster debugging
- Custom Workflows: Rules engine to trigger API or webhook-based actions
Pricing:
- Free Plan: 5,000 events/month with basic features
- Paid Plans: Starting around $12/month for increased limits
Pros:
- ✅ Focused, streamlined error tracking experience
- ✅ Excellent integration ecosystem (GitHub, Jira, Slack)
- ✅ Responsive customer support
Cons:
- ❌ No performance monitoring or distributed tracing
- ❌ Limited observability compared to full-stack solutions
- ❌ No session replay capabilities
Best For:
- Teams wanting simple, dedicated error tracking
- Organizations seeking Sentry-like functionality at lower cost
- Development teams focused primarily on bug resolution
Better Stack
Better Stack (formerly Logtail) is a modern observability platform emphasizing intuitive error tracking and real-time log management, designed to simplify debugging.
Key Features:
- Real-time Log Aggregation: Collect and analyze logs with powerful search capabilities
- Incident Management: Built-in escalation policies and collaborative troubleshooting
- Custom Alerting: Flexible notification system with multiple channels
- Uptime Monitoring: Website and service availability tracking
Pricing:
- Free Plan: Generous limits for small projects
- Paid Plans: Starting at $25/month (Hobby plan) with volume-based pricing
Pros:
- ✅ Intuitive interface designed for developer experience
- ✅ Strong log management capabilities
- ✅ Built-in incident management workflow
- ✅ 60-day money-back guarantee
Cons:
- ❌ Limited APM features compared to comprehensive platforms
- ❌ Primarily log-focused with basic error tracking
- ❌ Not HIPAA compliant currently
Best For:
- Teams prioritizing log analysis and incident response
- Startups needing combined monitoring and alerting
- Organizations wanting simple, effective debugging tools
Commercial Alternatives
LogRocket
LogRocket combines error tracking with session replay, providing unique visibility into user-facing issues through comprehensive frontend monitoring.
Key Features:
- Session Replay: Watch exactly how users interact with your application
- Frontend Performance Monitoring: Track Core Web Vitals, JavaScript errors, and network requests
- Error Correlation: Connect errors with specific user actions for better context
- Product Analytics: Understand user behavior patterns and conversion funnels
Pricing:
- Free Plan: 1,000 sessions/month
- Team Plan: Starts at $99/month for 10,000 sessions
- Professional Plan: Custom pricing for advanced features
Pros:
- ✅ Unique session replay capabilities for debugging
- ✅ Strong frontend focus with detailed user context
- ✅ Excellent for understanding user experience issues
- ✅ Good integration with React and JavaScript frameworks
Cons:
- ❌ Primarily frontend-focused with limited backend monitoring
- ❌ Privacy considerations with session recording
- ❌ Higher cost per session compared to pure error tracking
Best For:
- Frontend-heavy applications and SPAs
- Teams needing to understand user experience issues
- Customer support teams debugging user-reported problems
New Relic
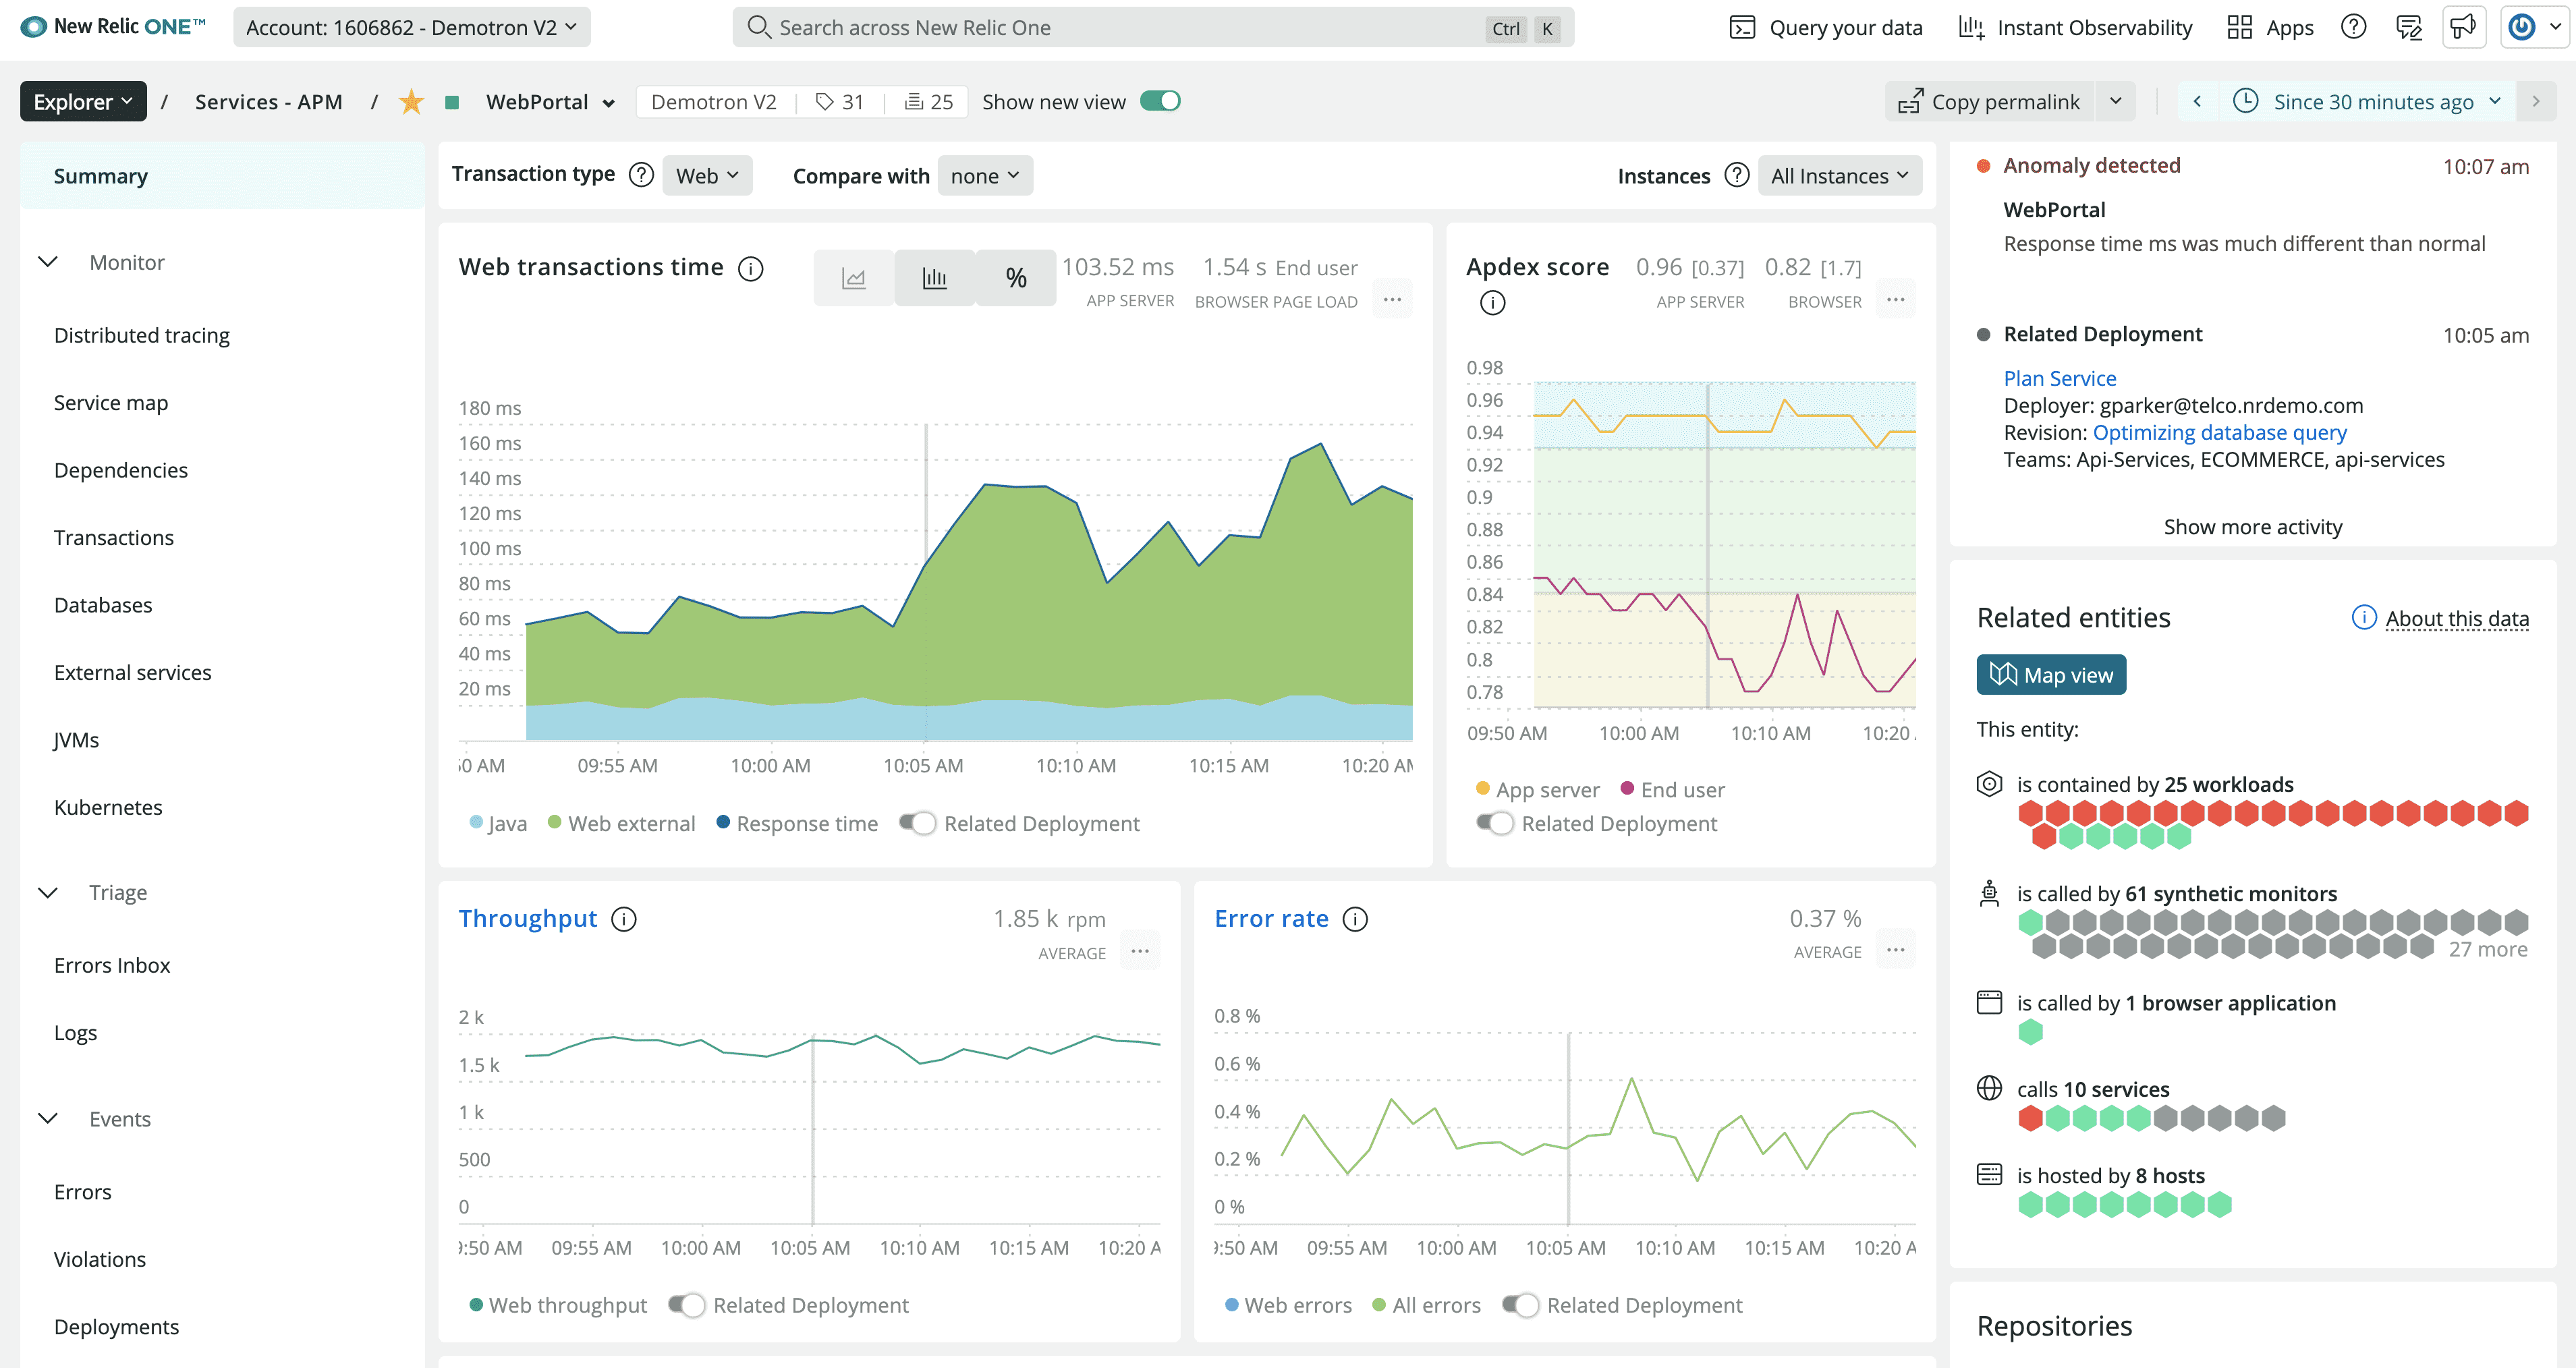
New Relic provides comprehensive observability including error tracking as part of a full-stack monitoring platform with AI-powered insights.
Key Features:
- Application Performance Monitoring: End-to-end visibility across the stack
- Error Analytics: Intelligent error grouping with impact analysis
- Infrastructure Monitoring: Server, container, and cloud resource monitoring
- AI-Powered Insights: Automated anomaly detection and root cause analysis
Pricing:
- Free Tier: 100 GB data ingestion per month
- Pro Plans: Usage-based pricing starting around $0.30 per GB above free tier
Pros:
- ✅ Comprehensive full-stack observability
- ✅ Strong AI/ML capabilities for issue detection
- ✅ Extensive integration ecosystem
- ✅ Enterprise-grade scalability
Cons:
- ❌ Complex pricing model with potential for high costs
- ❌ Can be overwhelming for teams wanting simple error tracking
- ❌ Higher learning curve compared to focused tools
Best For:
- Enterprise organizations needing comprehensive monitoring
- Teams wanting unified observability across entire technology stack
- Companies requiring advanced analytics and AI-driven insights
Sentry Similar Tools Comparison
| Feature | Uptrace | Telebugs | GlitchTip | Rollbar | Better Stack | LogRocket | New Relic |
|---|---|---|---|---|---|---|---|
| Open Source | ✅ | ❌ | ✅ | ❌ | ❌ | ❌ | ❌ |
| Self-Hosted | ✅ | ✅ | ✅ | ❌ | ❌ | ❌ | ❌ |
| Free Tier | ✅ | ❌ | ✅ | ✅ | ✅ | ✅ | ✅ |
| Error Tracking | ✅ | ✅ | ✅ | ✅ | ✅ | ✅ | ✅ |
| Session Replay | ❌ | ❌ | ❌ | ❌ | ❌ | ✅ | ✅ |
| Distributed Tracing | ✅ | ❌ | ❌ | ❌ | ❌ | ❌ | ✅ |
| Log Management | ✅ | ❌ | ❌ | ❌ | ✅ | ❌ | ✅ |
| OpenTelemetry | ✅ | ❌ | ❌ | ❌ | ✅ | ❌ | ✅ |
| Sentry SDK Compatible | ✅ | ✅ | ✅ | ❌ | ❌ | ❌ | ❌ |
Conclusion
The best Sentry alternative depends on your specific requirements:
- For Open-Source + Full Observability: Uptrace delivers enterprise-grade monitoring with complete data ownership and OpenTelemetry integration
- For Simple Error Tracking: Rollbar provides focused error management without unnecessary complexity
- For Log-Centric Monitoring: Better Stack excels at log analysis and incident management
- For Microservices Tracing: Jaeger offers industry-standard distributed tracing capabilities
- For Maximum Flexibility: Grafana Stack provides unlimited customization for technical teams
- For Frontend Focus: LogRocket combines error tracking with powerful session replay
- For Enterprise Scale: New Relic delivers comprehensive observability with AI-powered insights
Try Uptrace Today – Get started with OpenTelemetry-native observability and see why teams are choosing it as their primary Sentry alternative.
You may also be interested in: