Forever free OpenTelemetry APM
OpenTelemetry APM (Application Performance Monitoring) gives development and DevOps teams visibility into how distributed applications behave — where time is spent, what fails, and why. Unlike traditional APM tools that rely on proprietary agents, OpenTelemetry APM is built on a vendor-neutral, open standard that works with any backend.
Uptrace is an open source OpenTelemetry APM built from the ground up to fully follow OpenTelemetry specifications and best practices. It provides a unified platform for collecting, storing, and analyzing traces, metrics, and logs from modern cloud-native applications.
What is OpenTelemetry APM?
APM tools answer three core questions about your application:
- Is it working? — error rates, availability, failure detection
- Is it fast? — latency, throughput, bottleneck identification
- Why is it slow or broken? — root cause analysis across services
Traditional APM tools (Datadog, New Relic, Dynatrace) answer these questions using proprietary agents that lock your data into a specific vendor. OpenTelemetry APM answers the same questions using the OpenTelemetry open standard — your instrumentation stays the same regardless of which backend you send data to.
OpenTelemetry collects three types of telemetry that together give a complete picture:
- Traces — follow a request as it flows across services, showing exactly where time is spent
- Metrics — aggregate numbers (latency p99, error rate, CPU) that show trends over time
- Logs — detailed records of specific events, automatically correlated with traces
OpenTelemetry APM vs Traditional APM
| OpenTelemetry APM | Traditional APM | |
|---|---|---|
| Instrumentation | Open standard, works with any backend | Proprietary agents, vendor-specific |
| Vendor lock-in | None — switch backends without re-instrumentation | High — migrating means re-instrumenting everything |
| Cost model | Framework is free, pay for backend only | Per-host or per-data-volume licensing |
| Self-hosting | Supported — run your own backend | Rarely available |
| Community | CNCF project, thousands of contributors | Vendor-controlled |
| Language support | All major languages, standardized API | Varies by vendor |
Is OpenTelemetry Free?
The OpenTelemetry framework itself — SDKs, APIs, Collector — is completely free and open source under Apache 2.0. What you pay for (if anything) is the backend that stores and visualizes your data.
Uptrace is a free, open-source backend for OpenTelemetry data — self-hosted with no per-host or per-data fees.
What to Look for in an OpenTelemetry APM
If you're evaluating backends for your OpenTelemetry data:
- OTel-native vs adapted — some tools added OTel support as an afterthought; native tools are built around OTel semantics from the ground up
- Signal completeness — does it handle traces, metrics, and logs with cross-signal correlation, or only one or two?
- Semantic convention support — proper support for OTel semantic conventions means less manual attribute mapping
- Self-hosted option — important for data sovereignty, compliance, or cost control at scale
- Collector integration — production deployments always use the Collector; the backend should work seamlessly with it
How Uptrace works?
Uptrace leverages a modern, scalable architecture designed for high-performance observability data processing:
Storage Architecture
ClickHouse Database: Uptrace uses ClickHouse, a high-performance columnar database optimized for analytical workloads. This choice provides:
- Real-time Analytics: Query billions of events in milliseconds
- Efficient Compression: Advanced compression algorithms reduce storage costs by up to 90%
- Horizontal Scaling: Add nodes to handle increased data volume and query load
- Time-series Optimization: Native support for time-based partitioning and TTL policies
PostgreSQL: Stores metadata, configuration, and user data for optimal relational data management.
Data Flow Example
- Instrumentation: Your application code uses OpenTelemetry SDKs to generate traces and metrics
- Collection: Data flows through OpenTelemetry Collector for processing and routing
- Ingestion: Uptrace receives data via OTLP protocol and validates it
- Storage: Time-series data goes to ClickHouse, metadata to PostgreSQL
- Analysis: Query engine correlates traces, metrics, and logs for comprehensive insights
- Alerting: Automated alerts trigger based on predefined thresholds or anomalies
Why Choose Uptrace?
Unified Observability Platform
- Single Pane of Glass: View traces, metrics, and logs in one integrated interface
- Cross-Signal Correlation: Automatically link related traces, metrics, and log entries
- Consistent User Experience: No context switching between different tools
High Performance & Scalability
- Efficient Ingestion: Process over 10,000 spans per second on a single core
- Superior Compression: ZSTD compression reduces a 1KB span to under 40 bytes
- Automatic Scaling: Handle data growth with built-in horizontal scaling capabilities
Cost-Effective Storage
- S3 Integration: Automatically archive cold data to cost-effective S3-compatible storage
- Intelligent Tiering: Keep hot data in fast storage, move cold data to cheaper tiers
- Retention Policies: Configure automatic data cleanup based on age or storage limits
Intelligent Alerting
- Multi-Channel Notifications: Email, Slack, Telegram, PagerDuty, and webhook support
- Smart Thresholds: Machine learning-based anomaly detection
- Alert Correlation: Group related alerts to reduce noise and alert fatigue
OpenTelemetry Compatibility
Uptrace provides best-in-class OpenTelemetry support with full protocol compatibility:
- OTLP/gRPC: High-performance binary protocol for production environments
- OTLP/HTTP: HTTP-based protocol for firewall-friendly deployments
- Legacy Formats: Support for Jaeger, Zipkin, and Prometheus formats
Need help? Join our community on Telegram, Slack, or start a discussion on GitHub.
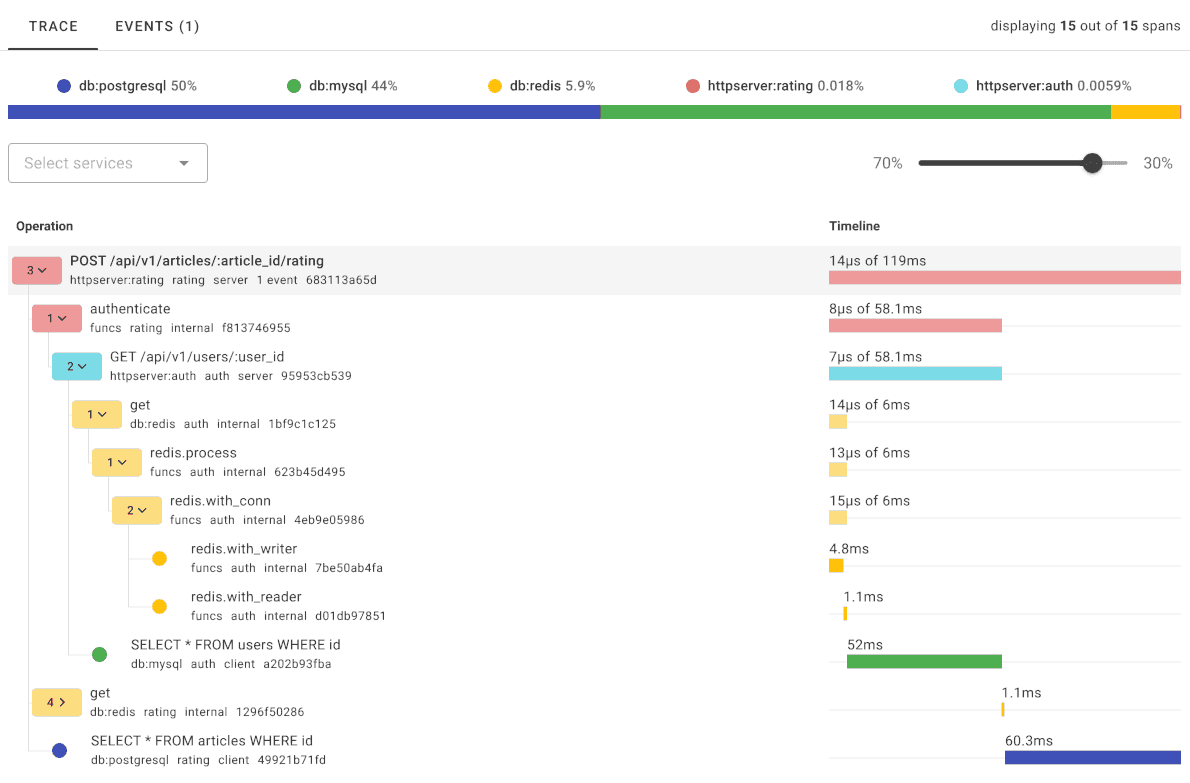
All-in-one APM
Uptrace transforms application monitoring by bringing traces, metrics, and logs together in one powerful interface. Instead of juggling multiple tools, developers can quickly spot performance bottlenecks—whether it's a sluggish database query or inefficient code—through visual request flows that show exactly where time is being spent.
What sets Uptrace apart is its proactive approach to application health. It centralizes all your log data for easy searching while smart alerts notify you the moment performance dips or anomalies appear. This means you can catch and fix issues before they frustrate your users, turning application monitoring from a reactive chore into a competitive advantage.
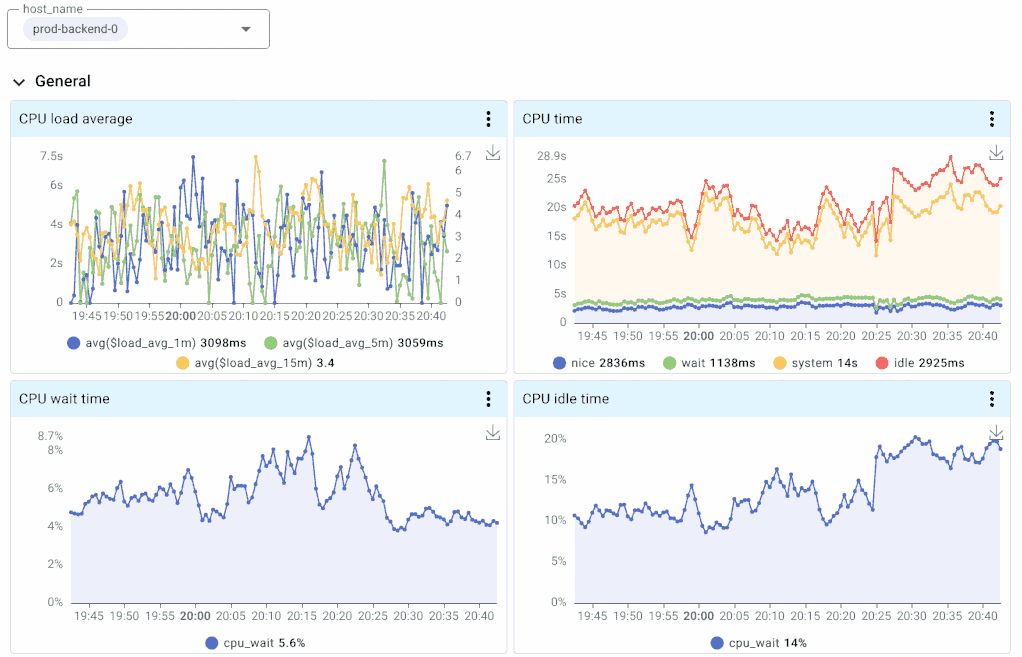
Uptrace allows to monitor your whole application stack on a compact and informative dashboard. You get a quick overview for all your services, hosts, and systems.

You can also analyze application performance with a fast and intuitive query language. You have the full power of SQL at your disposal to get deep insights from your data.
Fill the gaps left by tracing with modern metrics. Uptrace comes with pre-built dashboards for popular instrumentations and the ability to use Promql-like expressions to visualize metrics.
OpenTelemetry Demo
In less than 5 minutes, you try Uptrace with OpenTelemetry Astronomy Shop demo app, a microservice-based distributed system intended to illustrate the implementation of OpenTelemetry in a near real-world environment.
Step 1. Download the opentelemetry-demo using Git:
git clone https://github.com/uptrace/opentelemetry-demo.git
cd opentelemetry-demo
Step 2. Start the demo:
docker compose up --no-build
Step 3. Make sure Uptrace is running:
docker compose logs uptrace
Step 4. Open Uptrace UI at http://localhost:14318/overview/2
If something is not working, check OpenTelemetry Collector logs:
docker compose logs otelcol
What's next?
In just a few minutes, you can try Uptrace by visiting the cloud demo (no login required) or running it locally with Docker. The source code is available on GitHub.