13 Best DataDog Competitors in 2025: Complete Comparison Guide
Datadog has established itself as a powerful observability platform for monitoring cloud infrastructure and applications. However, its complex interface and pricing structure may not be ideal for every organization. Whether you're looking for better pricing, simpler interfaces, or more specialized features, this comprehensive guide will help you evaluate the top DataDog competitors in 2025.
Why Look at Competitors?
DataDog is a leading cloud-based monitoring and analytics platform. While powerful, it has several drawbacks that might lead businesses to explore alternatives:
DataDog Limitations
High Cost Structure: DataDog's pricing can be prohibitively expensive, especially for growing organizations. The per-host pricing model quickly adds up as your infrastructure scales, and additional features come with premium price tags.
Complex Implementation: Getting the full benefit of DataDog requires significant technical expertise. The setup process can be time-consuming and may require dedicated resources. When evaluating DevOps tools and observability tools, implementation complexity is a key consideration. Users on Reddit report challenges with scaling DataDog integrations, noting that "creating an ansible task to roll out each integration seems like a lot of toil."
Steep Learning Curve: Users report that mastering DataDog's extensive feature set takes considerable time and training. The complex interface can overwhelm teams new to observability platforms.
Feature Bloat: For organizations with simpler monitoring needs, DataDog's extensive capabilities may be unnecessarily complex, leading to paying for unused features.
Top DataDog Competitors in 2025
For decision-makers in DevOps and infrastructure teams, we focus on practical aspects that impact implementation complexity, scalability, and feature completeness to help identify the most suitable monitoring stack for different technical environments and requirements.
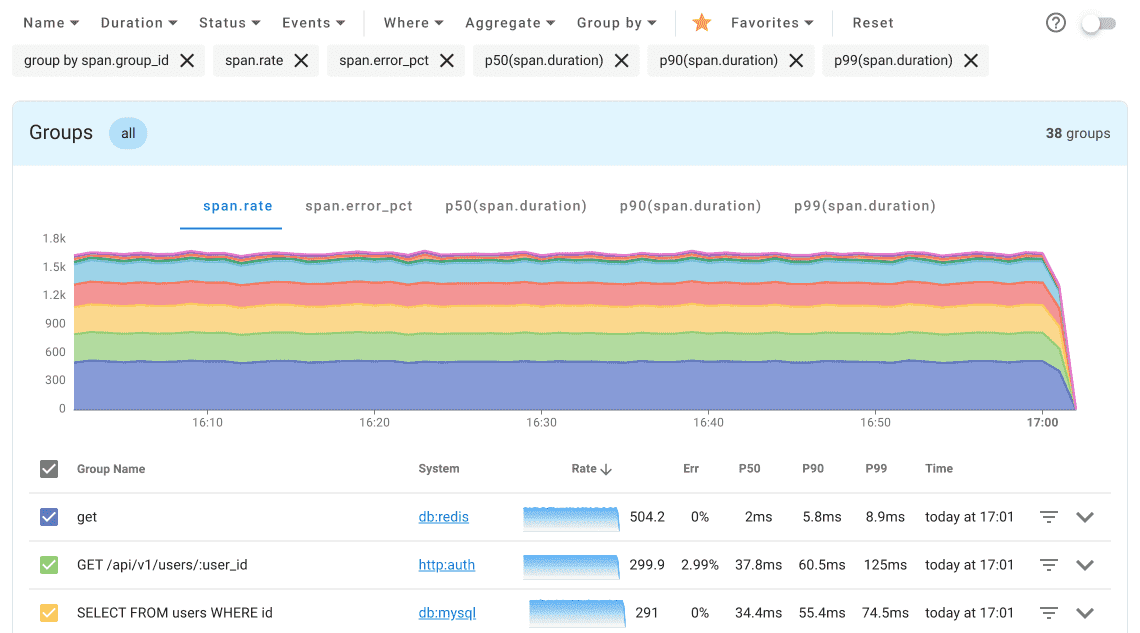
Uptrace
Uptrace is an open-source observability platform that has emerged as a strong DataDog competitor in 2025, offering comprehensive monitoring capabilities at a fraction of the cost.
Key Features
- Distributed tracing with OpenTelemetry integration
- Metrics monitoring with customizable dashboards
- Log management and correlation
- Infrastructure monitoring across diverse environments
- Anomaly detection and intelligent alerting
- End-to-end request visualization
- SQL queries for exploring trace data
Pros
- Significantly lower cost compared to DataDog (up to 10x savings)
- Open-source foundation with enterprise support options
- Clean, intuitive UI requiring minimal training
- Ability to process billions of spans on a single server
- Public playground for easy testing before implementation
- Unlimited users, services, and hosts
- Comprehensive overview dashboards and flexible query builder
Cons
- Fewer pre-built integrations compared to established competitors
- Limited dashboard visualization options
- No profiling or real user monitoring (yet)
Best For
- Cost-conscious organizations seeking enterprise-grade observability
- DevOps teams wanting simple yet powerful tracing solutions
- Companies transitioning from basic monitoring to full observability
- Startups and growing businesses with limited monitoring budgets
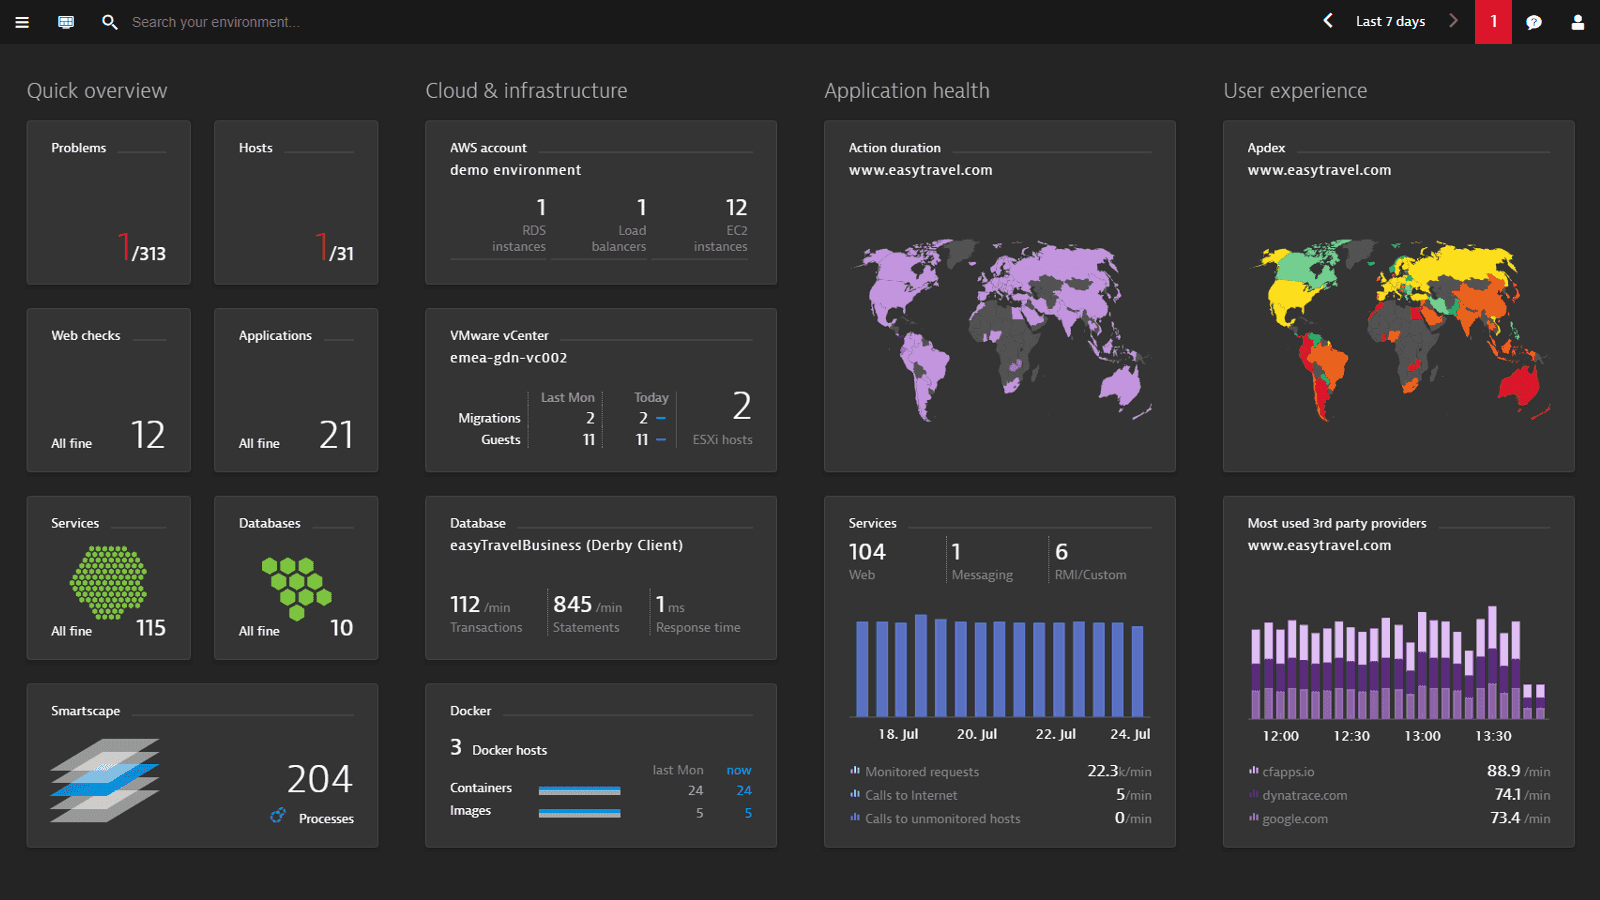
Dynatrace
Dynatrace leverages AI-powered analysis to provide automatic and intelligent observability across applications, infrastructure, and user experience.
Key Features
- AI-driven root cause analysis (Davis AI)
- Full-stack monitoring with code-level insights
- Real-time service dependency mapping
- Automated discovery and instrumentation
- Digital experience monitoring
- AIOps capabilities
- Application security monitoring
Pros
- Superior AI-powered anomaly detection and problem isolation
- Comprehensive end-to-end transaction visibility
- Automated deployment and configuration
- Rich contextual data for troubleshooting
- Advanced user experience analytics
- Strong security monitoring capabilities
Cons
- Premium pricing that may exceed DataDog for certain configurations
- Complex implementation requiring specialized knowledge
- Can be resource-intensive on monitored hosts
Best For
- Large enterprises with complex multi-cloud environments
- Organizations prioritizing AI-driven operations
- Teams requiring automatic dependency mapping
- Businesses focused on superior user experience monitoring
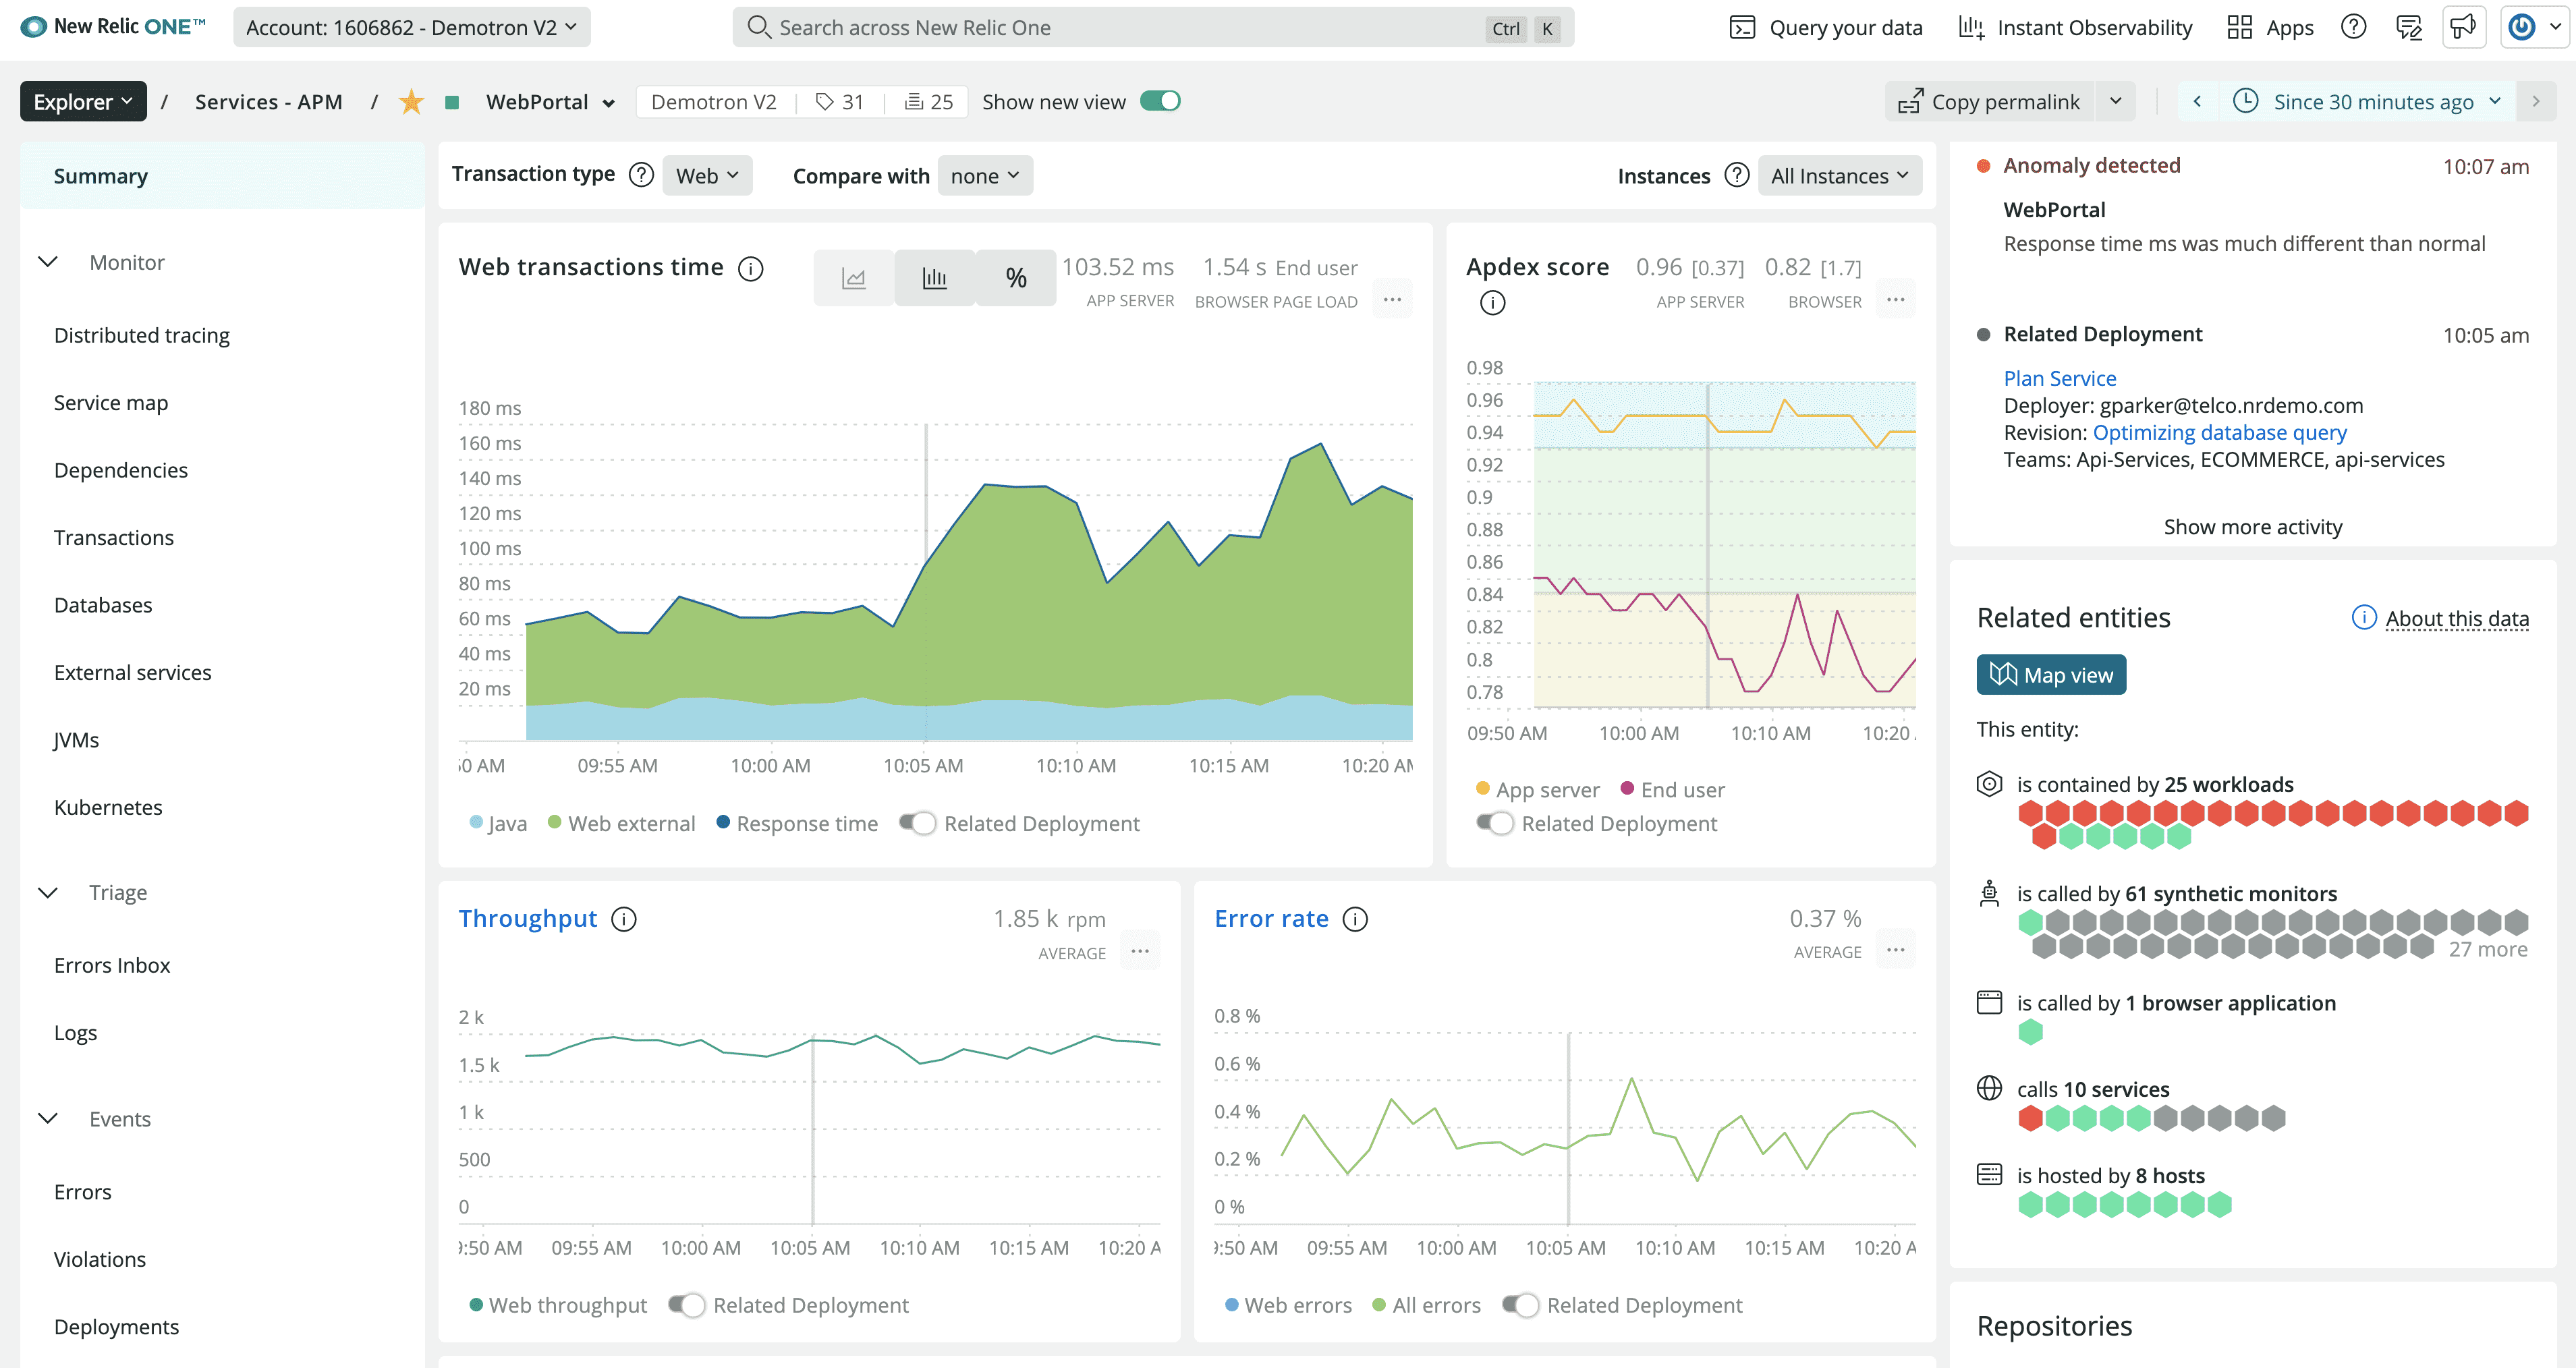
New Relic
New Relic One has evolved into a unified observability platform that combines metrics, logs, traces, and user experience monitoring with a consumption-based pricing model.
Key Features
- Full-stack observability in a single platform
- Customizable dashboards with NRQL query language
- Applied intelligence for anomaly detection
- DevOps workflow integration
- Real user monitoring and synthetic testing
- Infrastructure performance monitoring
- Kubernetes monitoring
Pros
- Consumption-based pricing model
- Comprehensive telemetry data platform
- Powerful customization capabilities
- Extensive integration ecosystem
- Strong APM capabilities with code-level visibility
- Detailed transaction tracing
Cons
- Complex pricing structure that can become expensive at scale
- Steep learning curve for new users
- Interface complexity can slow troubleshooting
- No public playground for testing
Best For
- Organizations wanting a single observability solution
- Development teams requiring detailed application performance insights
- Companies transitioning from traditional APM to full-stack observability
- Businesses with fluctuating monitoring needs
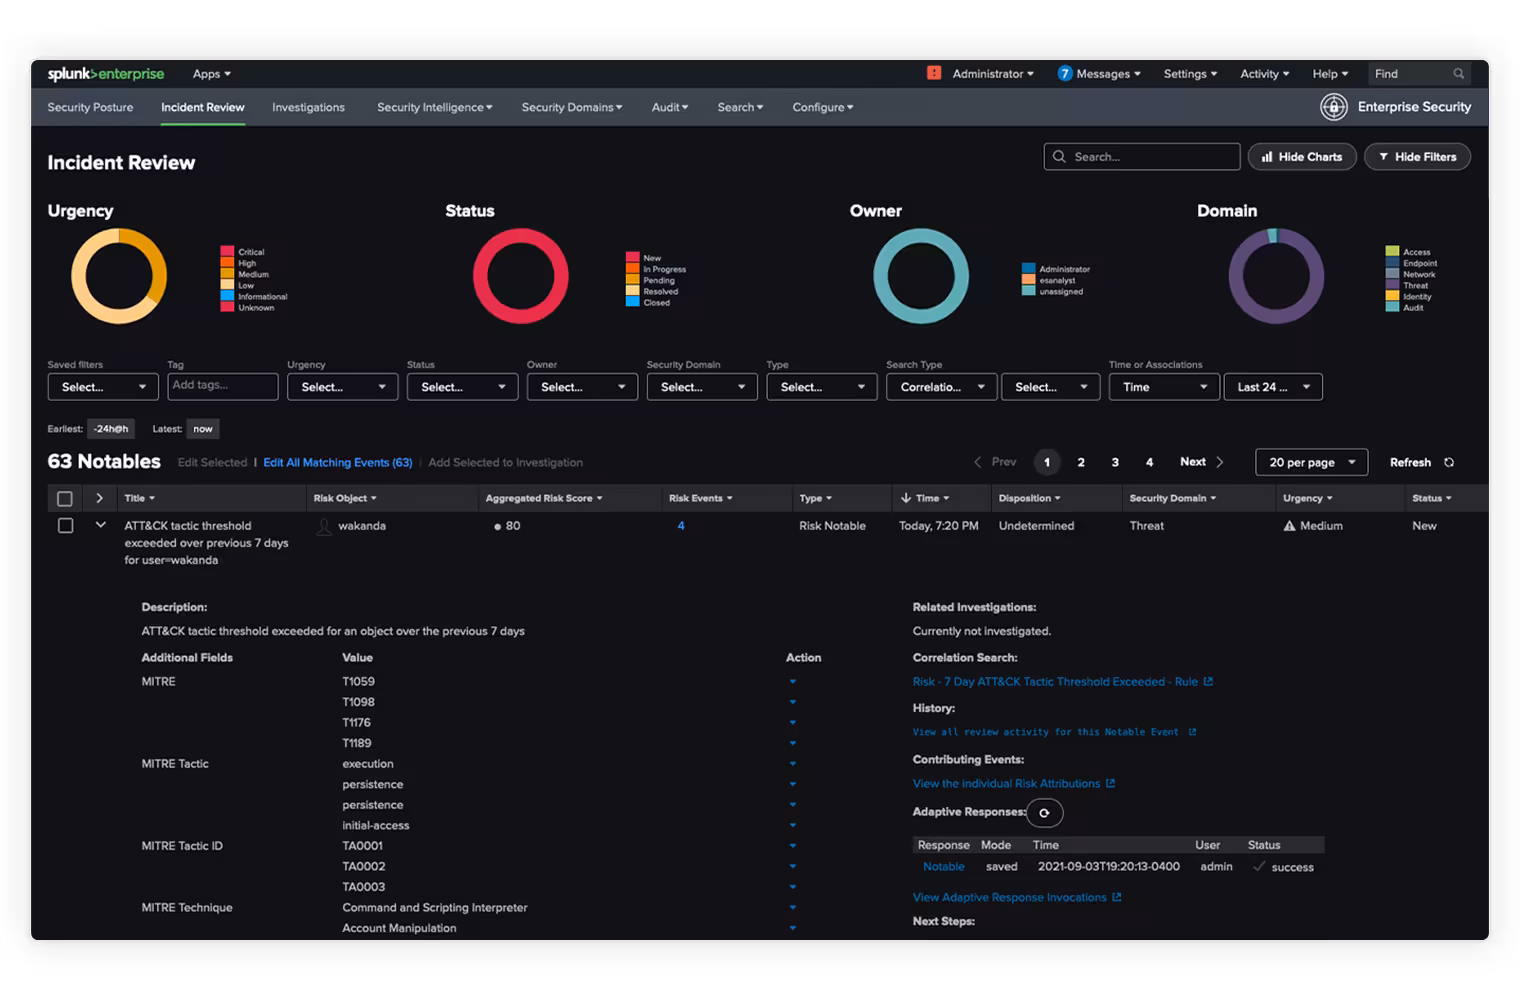
Splunk
Splunk has expanded beyond its log management roots to offer comprehensive observability capabilities with powerful analytics and search functionality.
Key Features
- Industry-leading log analysis capabilities
- Real-time data collection and analysis
- Advanced search functionality
- Powerful correlation across metrics, logs, and traces
- Machine learning for anomaly detection
- Extensive visualization options
- Security monitoring features
Pros
- Unmatched log search and analytics capabilities
- Highly customizable dashboards and reports
- Large ecosystem of apps and integrations
- Ability to handle massive data volumes
- Strong security and compliance features
- Versatile deployment options (cloud, on-premises, hybrid)
Cons
- Premium pricing that can be prohibitive for smaller organizations
- Resource-intensive installation and operation
- Significant learning curve
- Complex implementation and maintenance
Best For
- Large enterprises with extensive data analysis needs
- Organizations with strong security and compliance requirements
- Teams with existing log management investments
- Companies requiring advanced pattern recognition in operational data
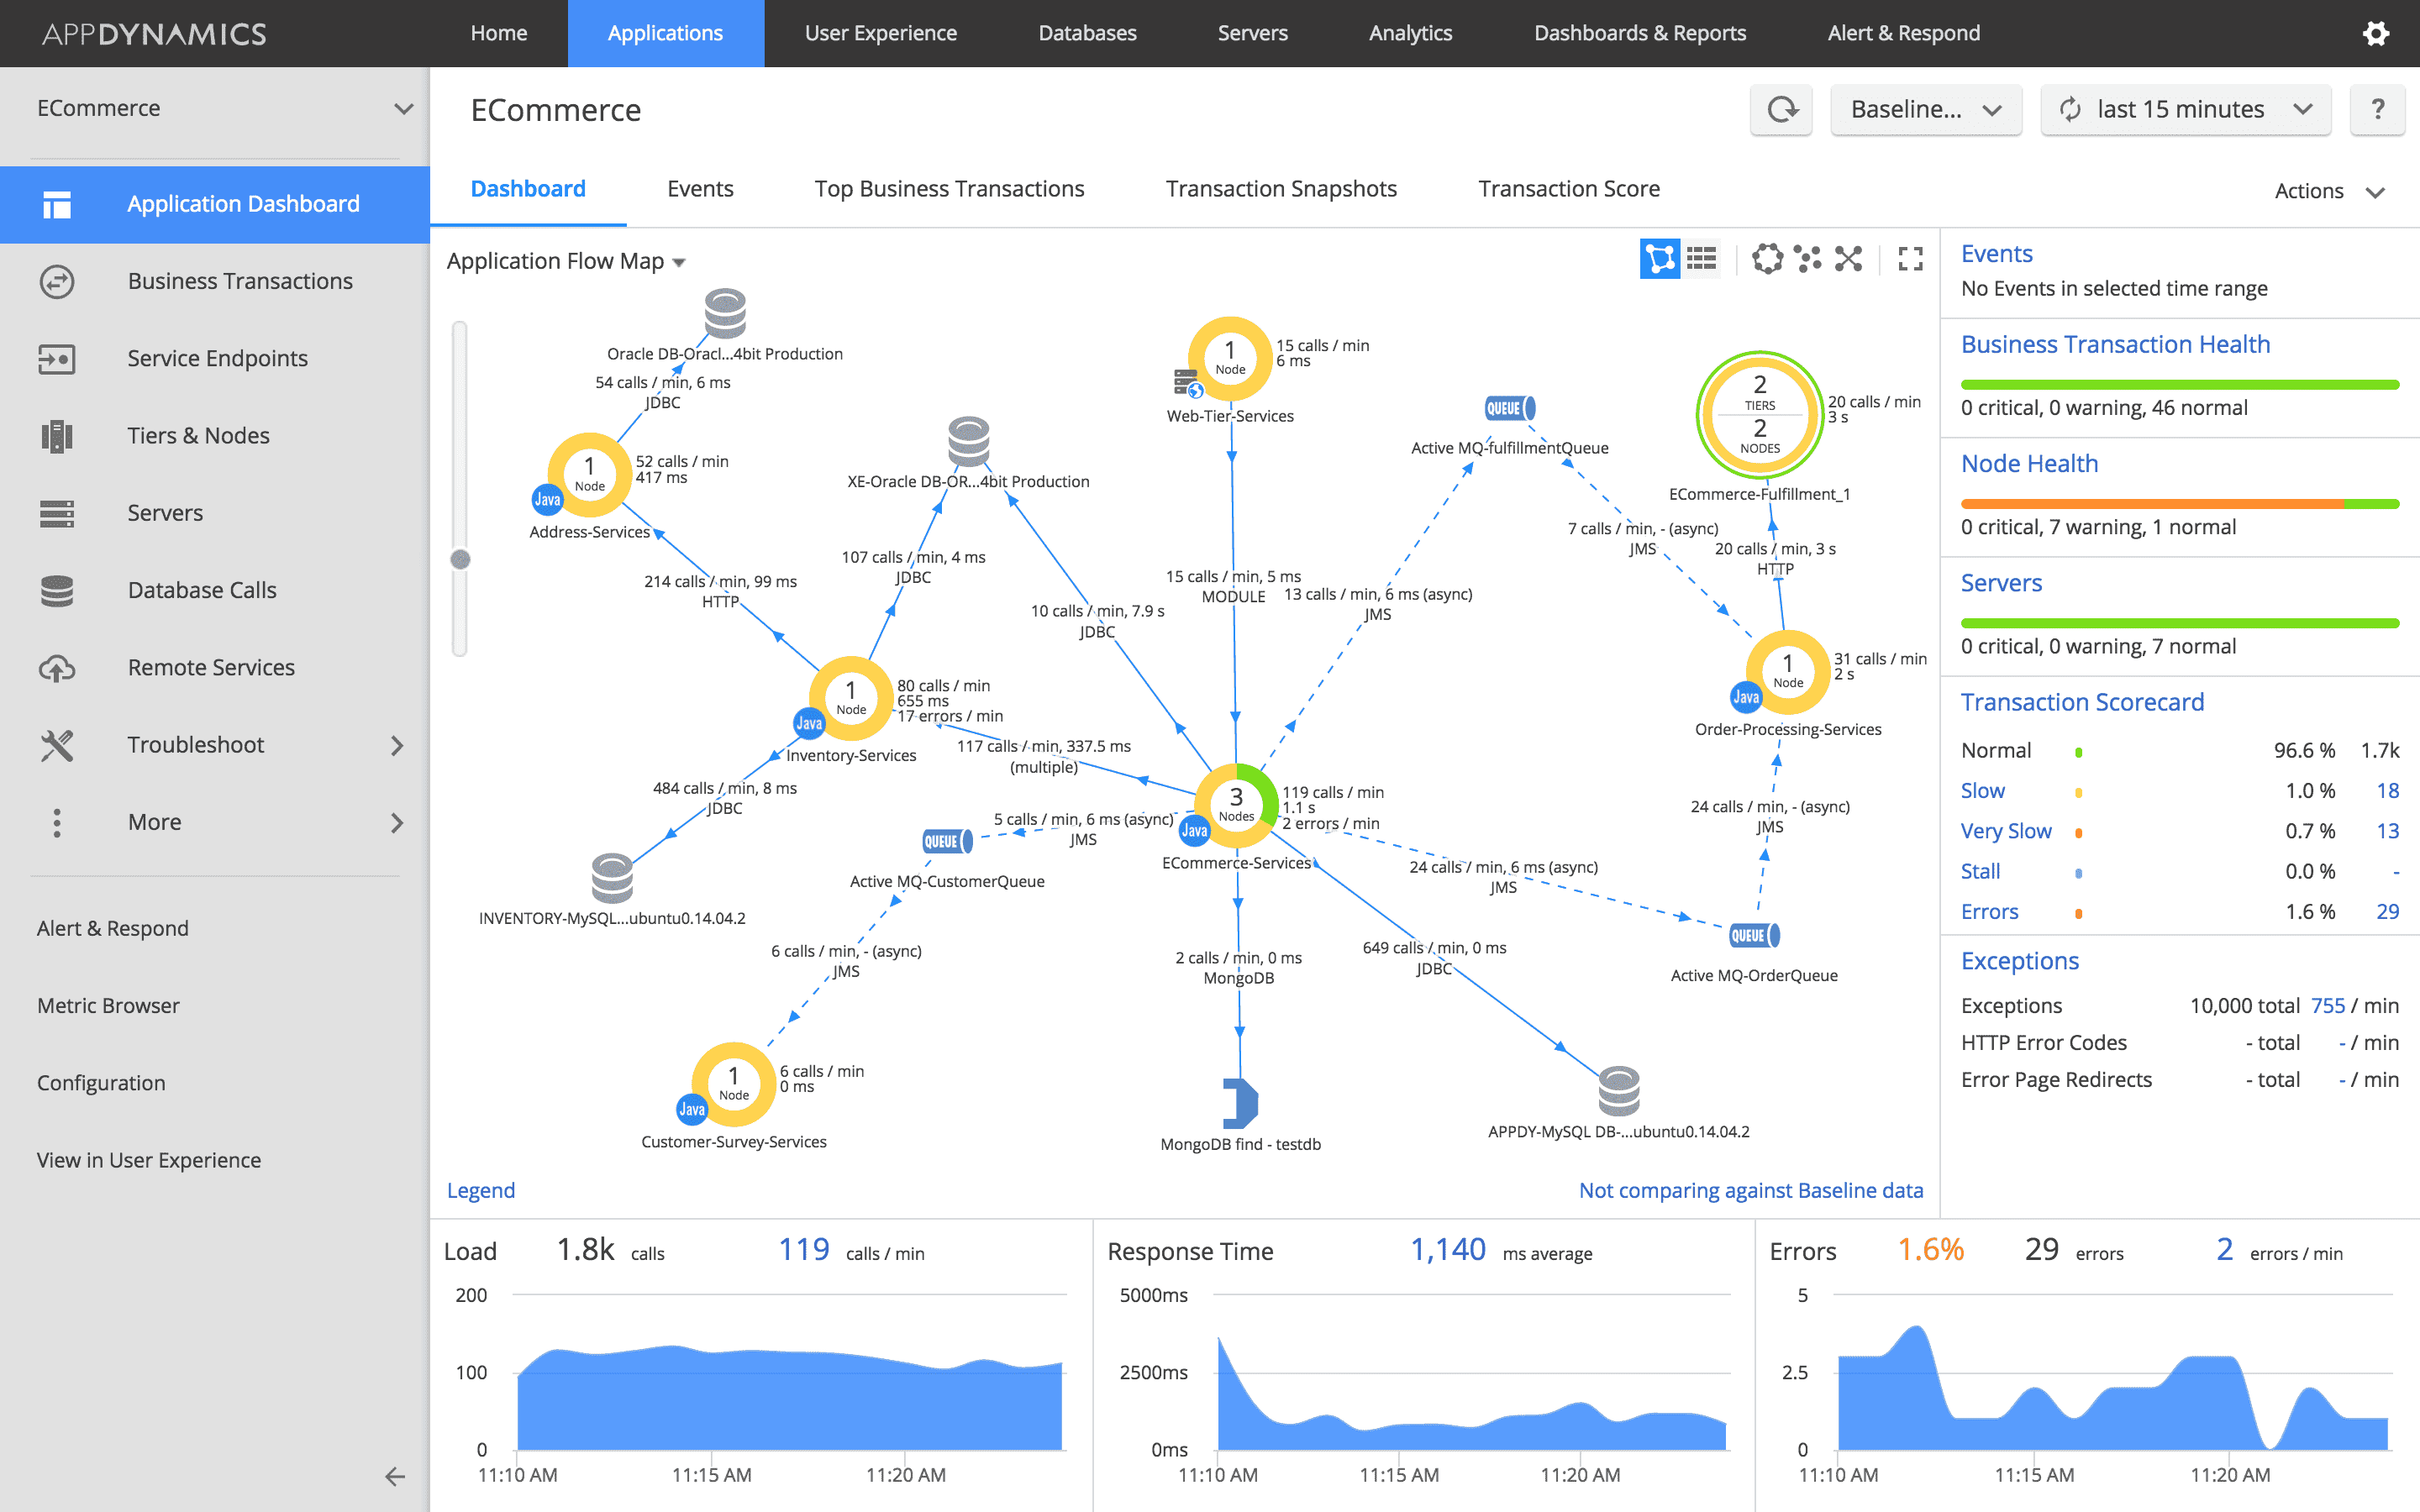
AppDynamics
AppDynamics, now part of Cisco's Splunk, provides business-centric monitoring that connects application performance to business outcomes with comprehensive visibility across the technology stack.
Key Features
- Business transaction monitoring
- Code-level diagnostics
- Infrastructure visibility
- User experience monitoring
- Business iQ for connecting IT metrics to business outcomes
- Automated service dependency mapping
- Integrated security monitoring (Cisco Secure Application)
Pros
- Superior application performance monitoring
- Business outcome correlation
- Detailed transaction insights
- Strong enterprise support
- Comprehensive Cisco integration
- Powerful baselining and anomaly detection
Cons
- Higher cost structure compared to many alternatives
- Complex licensing model
- Steep implementation learning curve
- Requires significant configuration for optimal results
Best For
- Large enterprises with business-critical applications
- Organizations focused on connecting IT metrics to business outcomes
- Companies with substantial Cisco investments
- Businesses requiring deep application transaction analysis
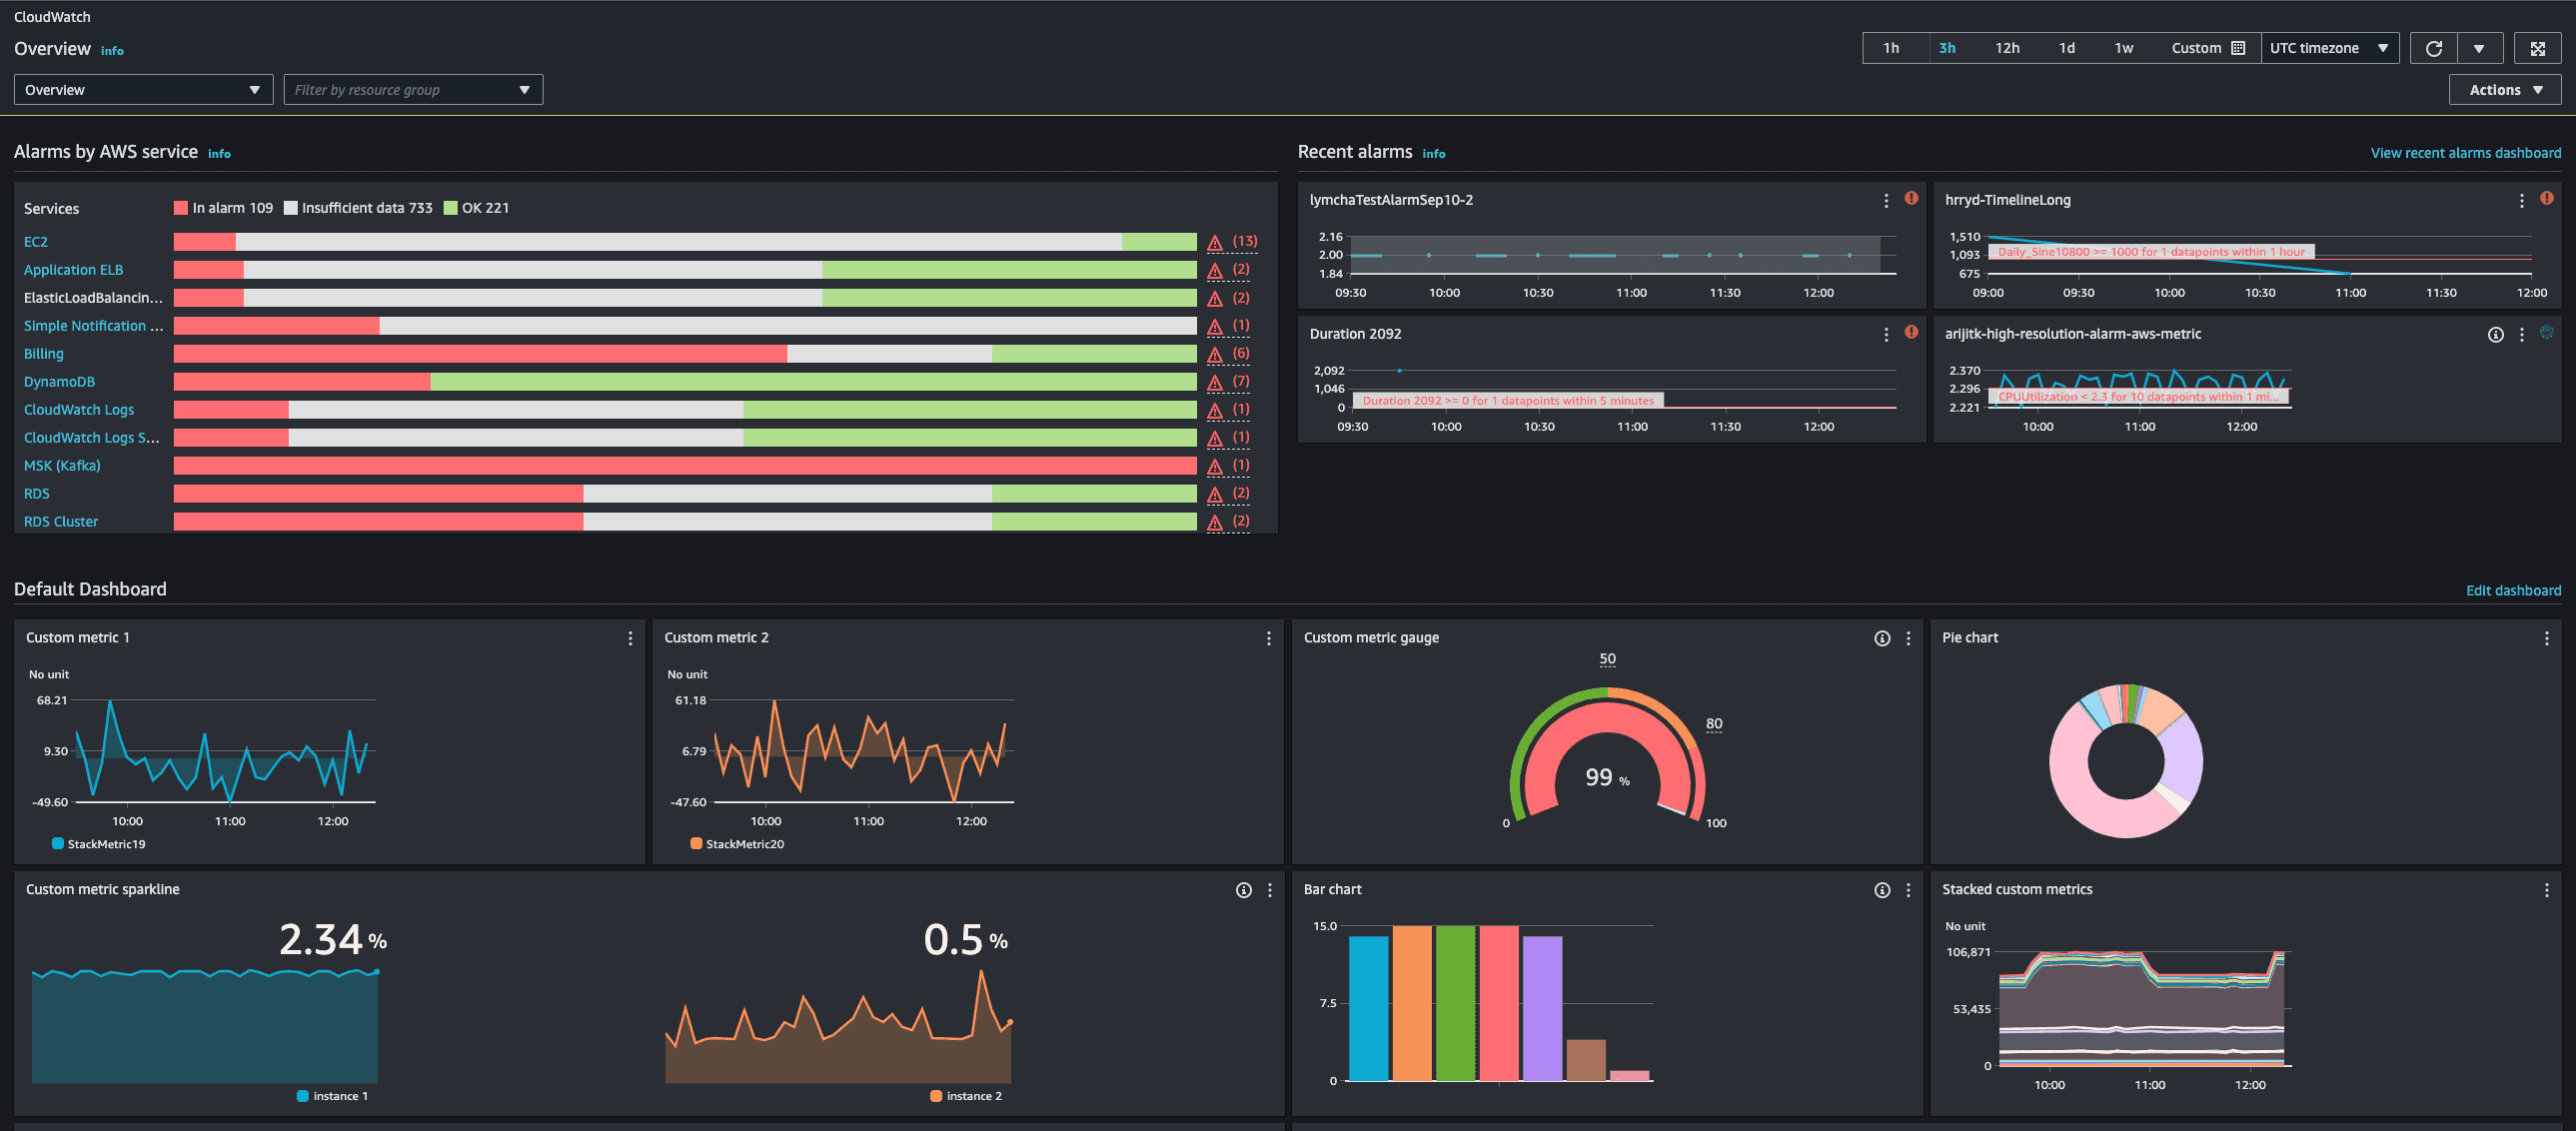
AWS CloudWatch
Amazon CloudWatch serves as the native monitoring solution for AWS environments, providing metrics, logs, and alarms with tight integration to AWS services.
Key Features
- Native AWS service monitoring
- Customizable dashboards
- Log analysis capabilities
- Cross-account monitoring
- Container insights
- Synthetic canary testing
- Anomaly detection
Pros
- Seamless integration with AWS services
- Cost-effective for AWS-centric deployments
- Native AWS implementation requiring minimal setup
- Consistent improvement and feature additions
- Integrates with AWS CloudTrail for comprehensive visibility
- Automatic scaling with AWS infrastructure
Cons
- Limited functionality outside AWS environments
- Less sophisticated than specialized monitoring solutions
- Basic visualization capabilities
- Challenging to use for complex, cross-platform monitoring
Best For
- Organizations primarily using AWS infrastructure
- Teams seeking simplified AWS monitoring
- Cost-conscious companies already invested in AWS
- Businesses requiring basic monitoring without additional vendors
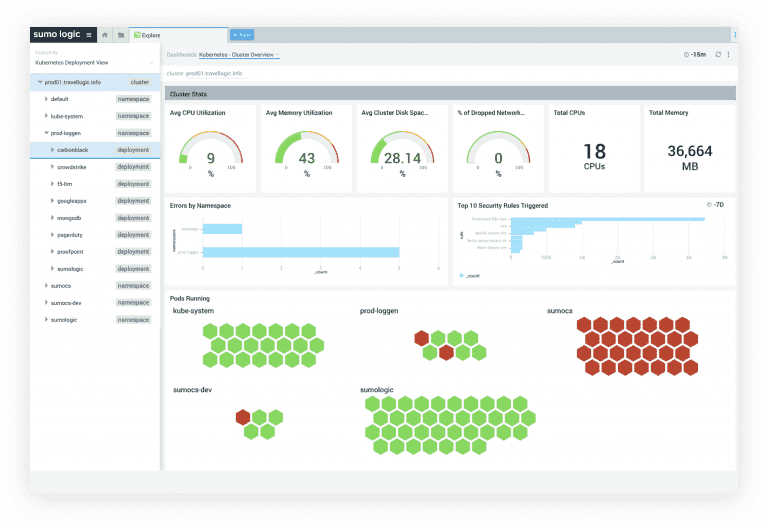
Sumo Logic
Sumo Logic offers a cloud-native, machine data analytics platform that combines log management, metrics monitoring, and security analytics with advanced machine learning capabilities.
Key Features
- Cloud-native SaaS platform
- Advanced log analytics
- Metrics visualization and monitoring
- Machine learning pattern detection
- Security analytics
- Compliance monitoring
- Cloud SIEM capabilities
Pros
- Purpose-built for cloud environments
- Strong security and compliance features
- Advanced pattern recognition and anomaly detection
- Easy implementation as SaaS solution
- Scalable architecture
- Comprehensive API
Cons
- Can become expensive at high data volumes
- Limited on-premises capabilities
- Steeper learning curve for advanced functions
- Less comprehensive APM features compared to competitors
Best For
- Security-focused organizations
- Companies requiring advanced log analytics
- Cloud-native businesses
- Teams wanting SaaS-based observability
SolarWinds
SolarWinds provides comprehensive IT infrastructure monitoring with a focus on network performance, server health, and application monitoring through its suite of products.
Key Features
- Network performance monitoring
- Server and application monitoring
- Database performance analysis
- Log management
- NetFlow traffic analysis
- Configuration management
- Capacity planning tools
Pros
- Cost-effective monitoring solution
- Strong network monitoring capabilities
- Straightforward implementation
- Broad technology coverage
- Extensive hardware monitoring
- Large knowledge base and community
Cons
- Less integrated than single-platform alternatives
- Basic user interface compared to modern competitors
- Limited cloud-native monitoring capabilities
- Less advanced analytics
Best For
- Network operations teams
- Organizations with substantial on-premises infrastructure
- IT departments requiring comprehensive hardware monitoring
- Companies with traditional IT infrastructures
IBM Instana
IBM Instana provides automated application performance monitoring with a focus on dynamic microservice environments and containerized applications.
Key Features
- Automated discovery and monitoring
- Real-time application mapping
- Kubernetes monitoring
- Microservices visibility
- One-second metric granularity
- AI-assisted root cause analysis
- Continuous deployment monitoring
Pros
- Superior Kubernetes and container monitoring
- Automatic dependency mapping
- Real-time visualization of architecture changes
- Low-overhead agent technology
- Simplified implementation
- Quick time-to-value
Cons
- Higher cost structure
- Less extensive integration ecosystem
- Focused primarily on modern applications
- Limited historical data retention in basic plans
Best For
- Organizations running microservice architectures
- Kubernetes-intensive environments
- Teams practicing continuous deployment
- Companies transitioning to cloud-native applications
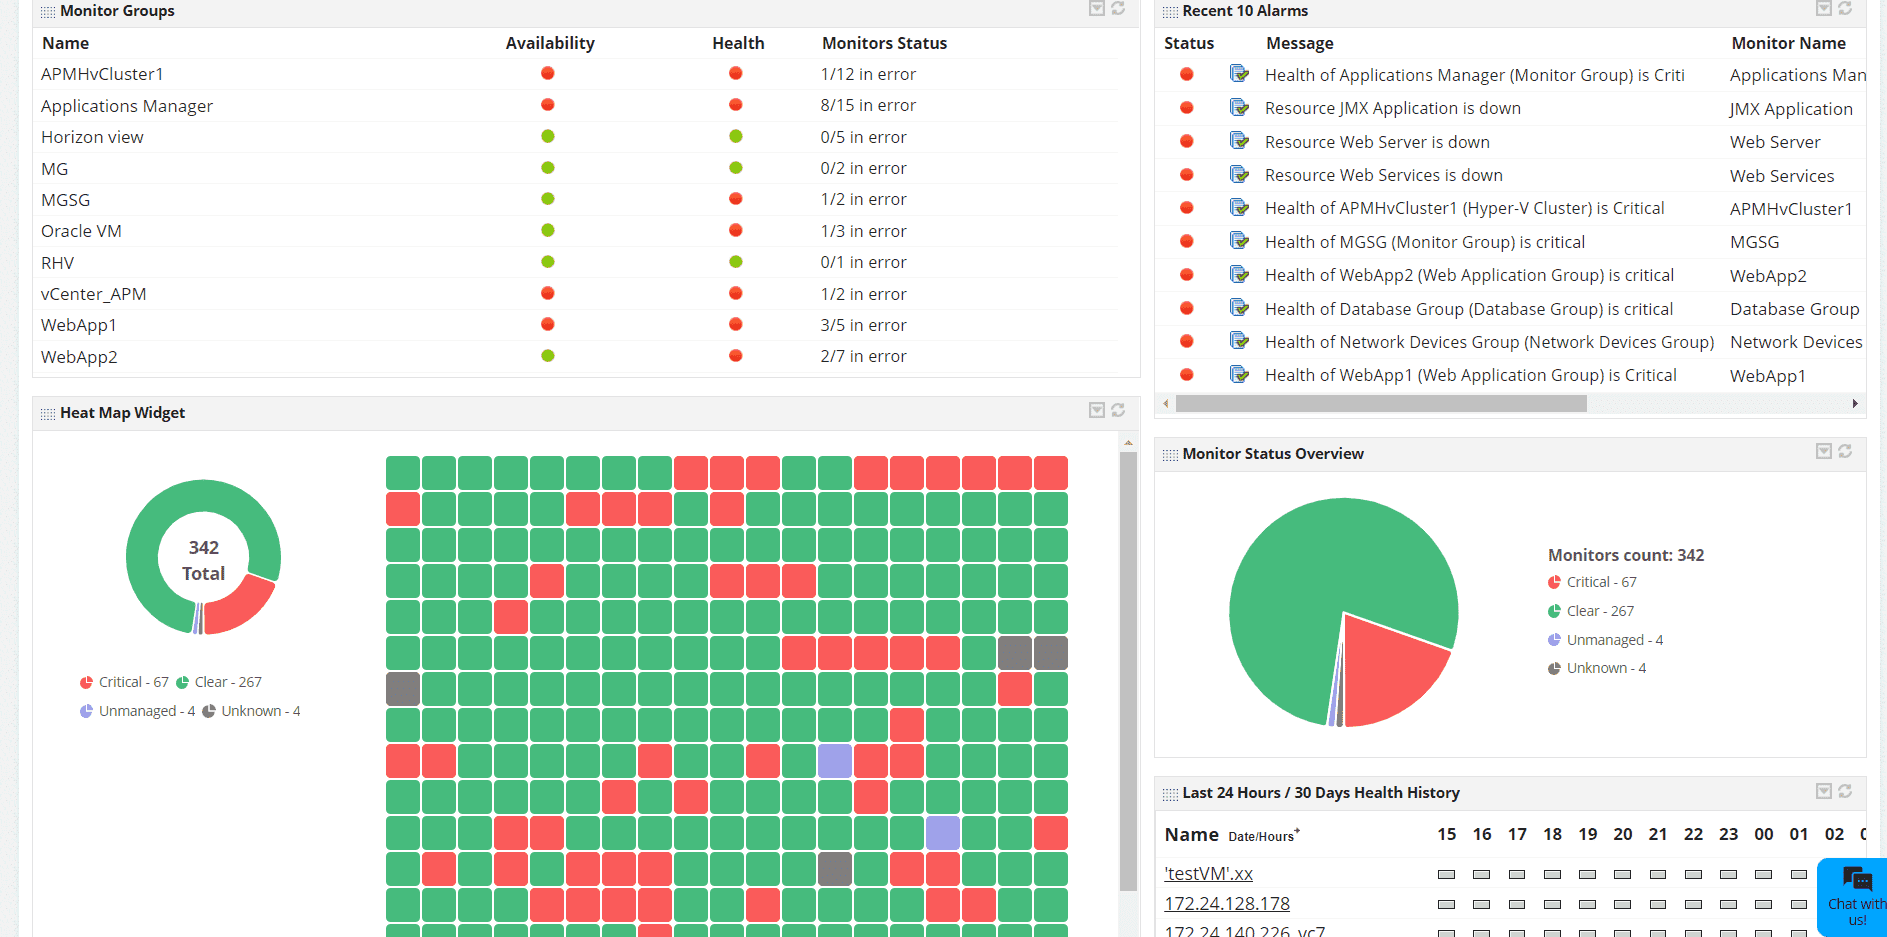
ManageEngine
ManageEngine offers a broad suite of IT management tools including Applications Manager and OpManager that provide comprehensive monitoring across applications, servers, and network devices.
Key Features
- Application performance monitoring
- Network monitoring
- Server monitoring
- Database monitoring
- VM monitoring
- End-user experience monitoring
- Custom metric tracking
Pros
- Cost-effective compared to enterprise solutions
- Comprehensive coverage of traditional IT infrastructure
- Modular approach allowing targeted tool selection
- Simple licensing model
- Quick implementation timeframe
- Strong on-premises capabilities
Cons
- Less sophisticated analytics compared to leaders
- Multiple products required for full coverage
- Limited cloud-native monitoring features
- Basic UX compared to modern alternatives
Best For
- Budget-conscious IT operations teams
- Organizations with traditional infrastructure
- Companies requiring straightforward monitoring
- IT departments with diverse technology stacks
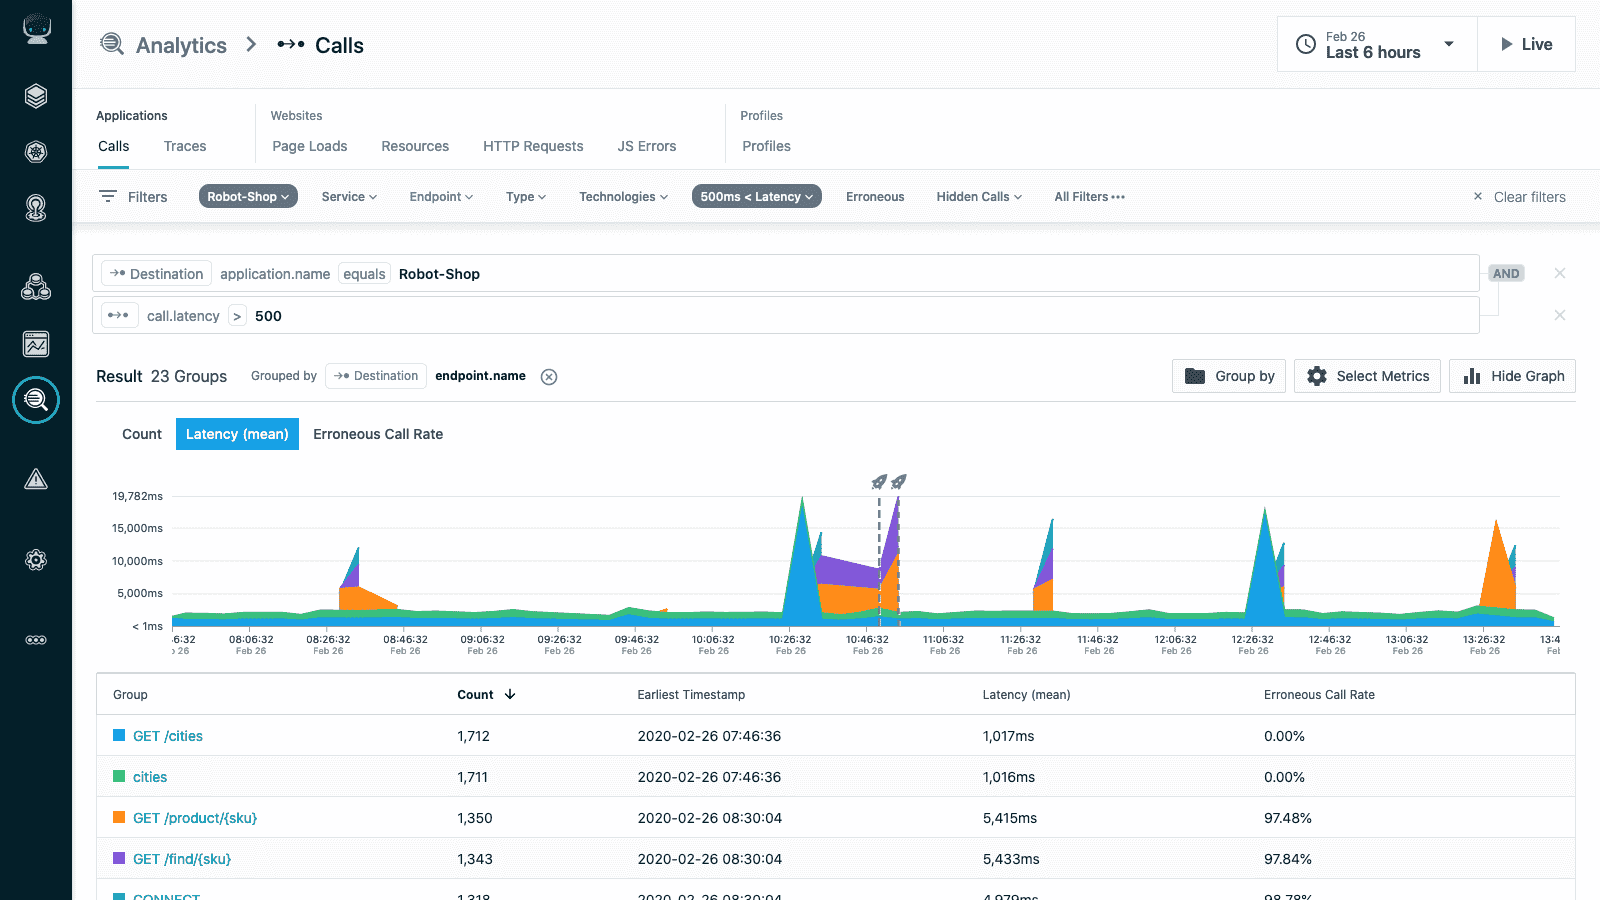
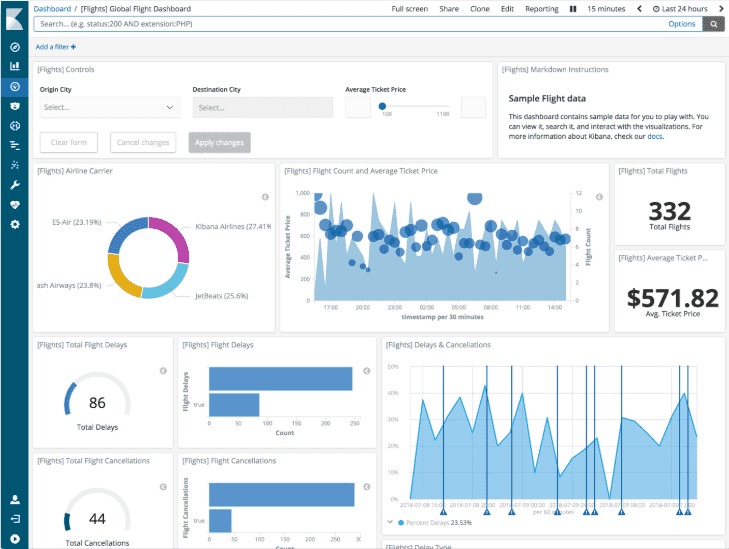
Elastic Observability
Elastic Observability leverages the Elastic Stack (formerly ELK) to provide logs, metrics, and APM capabilities with powerful search capabilities and flexible deployment options.
Key Features
- Centralized log management
- Infrastructure monitoring
- Application performance monitoring
- Real user monitoring
- Synthetic monitoring
- Powerful Elasticsearch backend
- Kibana visualization
Pros
- Open-source foundation with enterprise features
- Unified logs and metrics platform
- Extremely powerful search capabilities
- Flexible deployment models
- Strong community support
- Cost-effective scaling options
Cons
- Requires significant expertise to implement properly
- Can be resource-intensive
- Complex configuration for optimal performance
- Less automated than some competitors
Best For
- Organizations with significant log analysis requirements
- Teams with existing Elastic Stack investments
- Companies seeking flexible deployment options
- DevOps teams comfortable with open-source tools
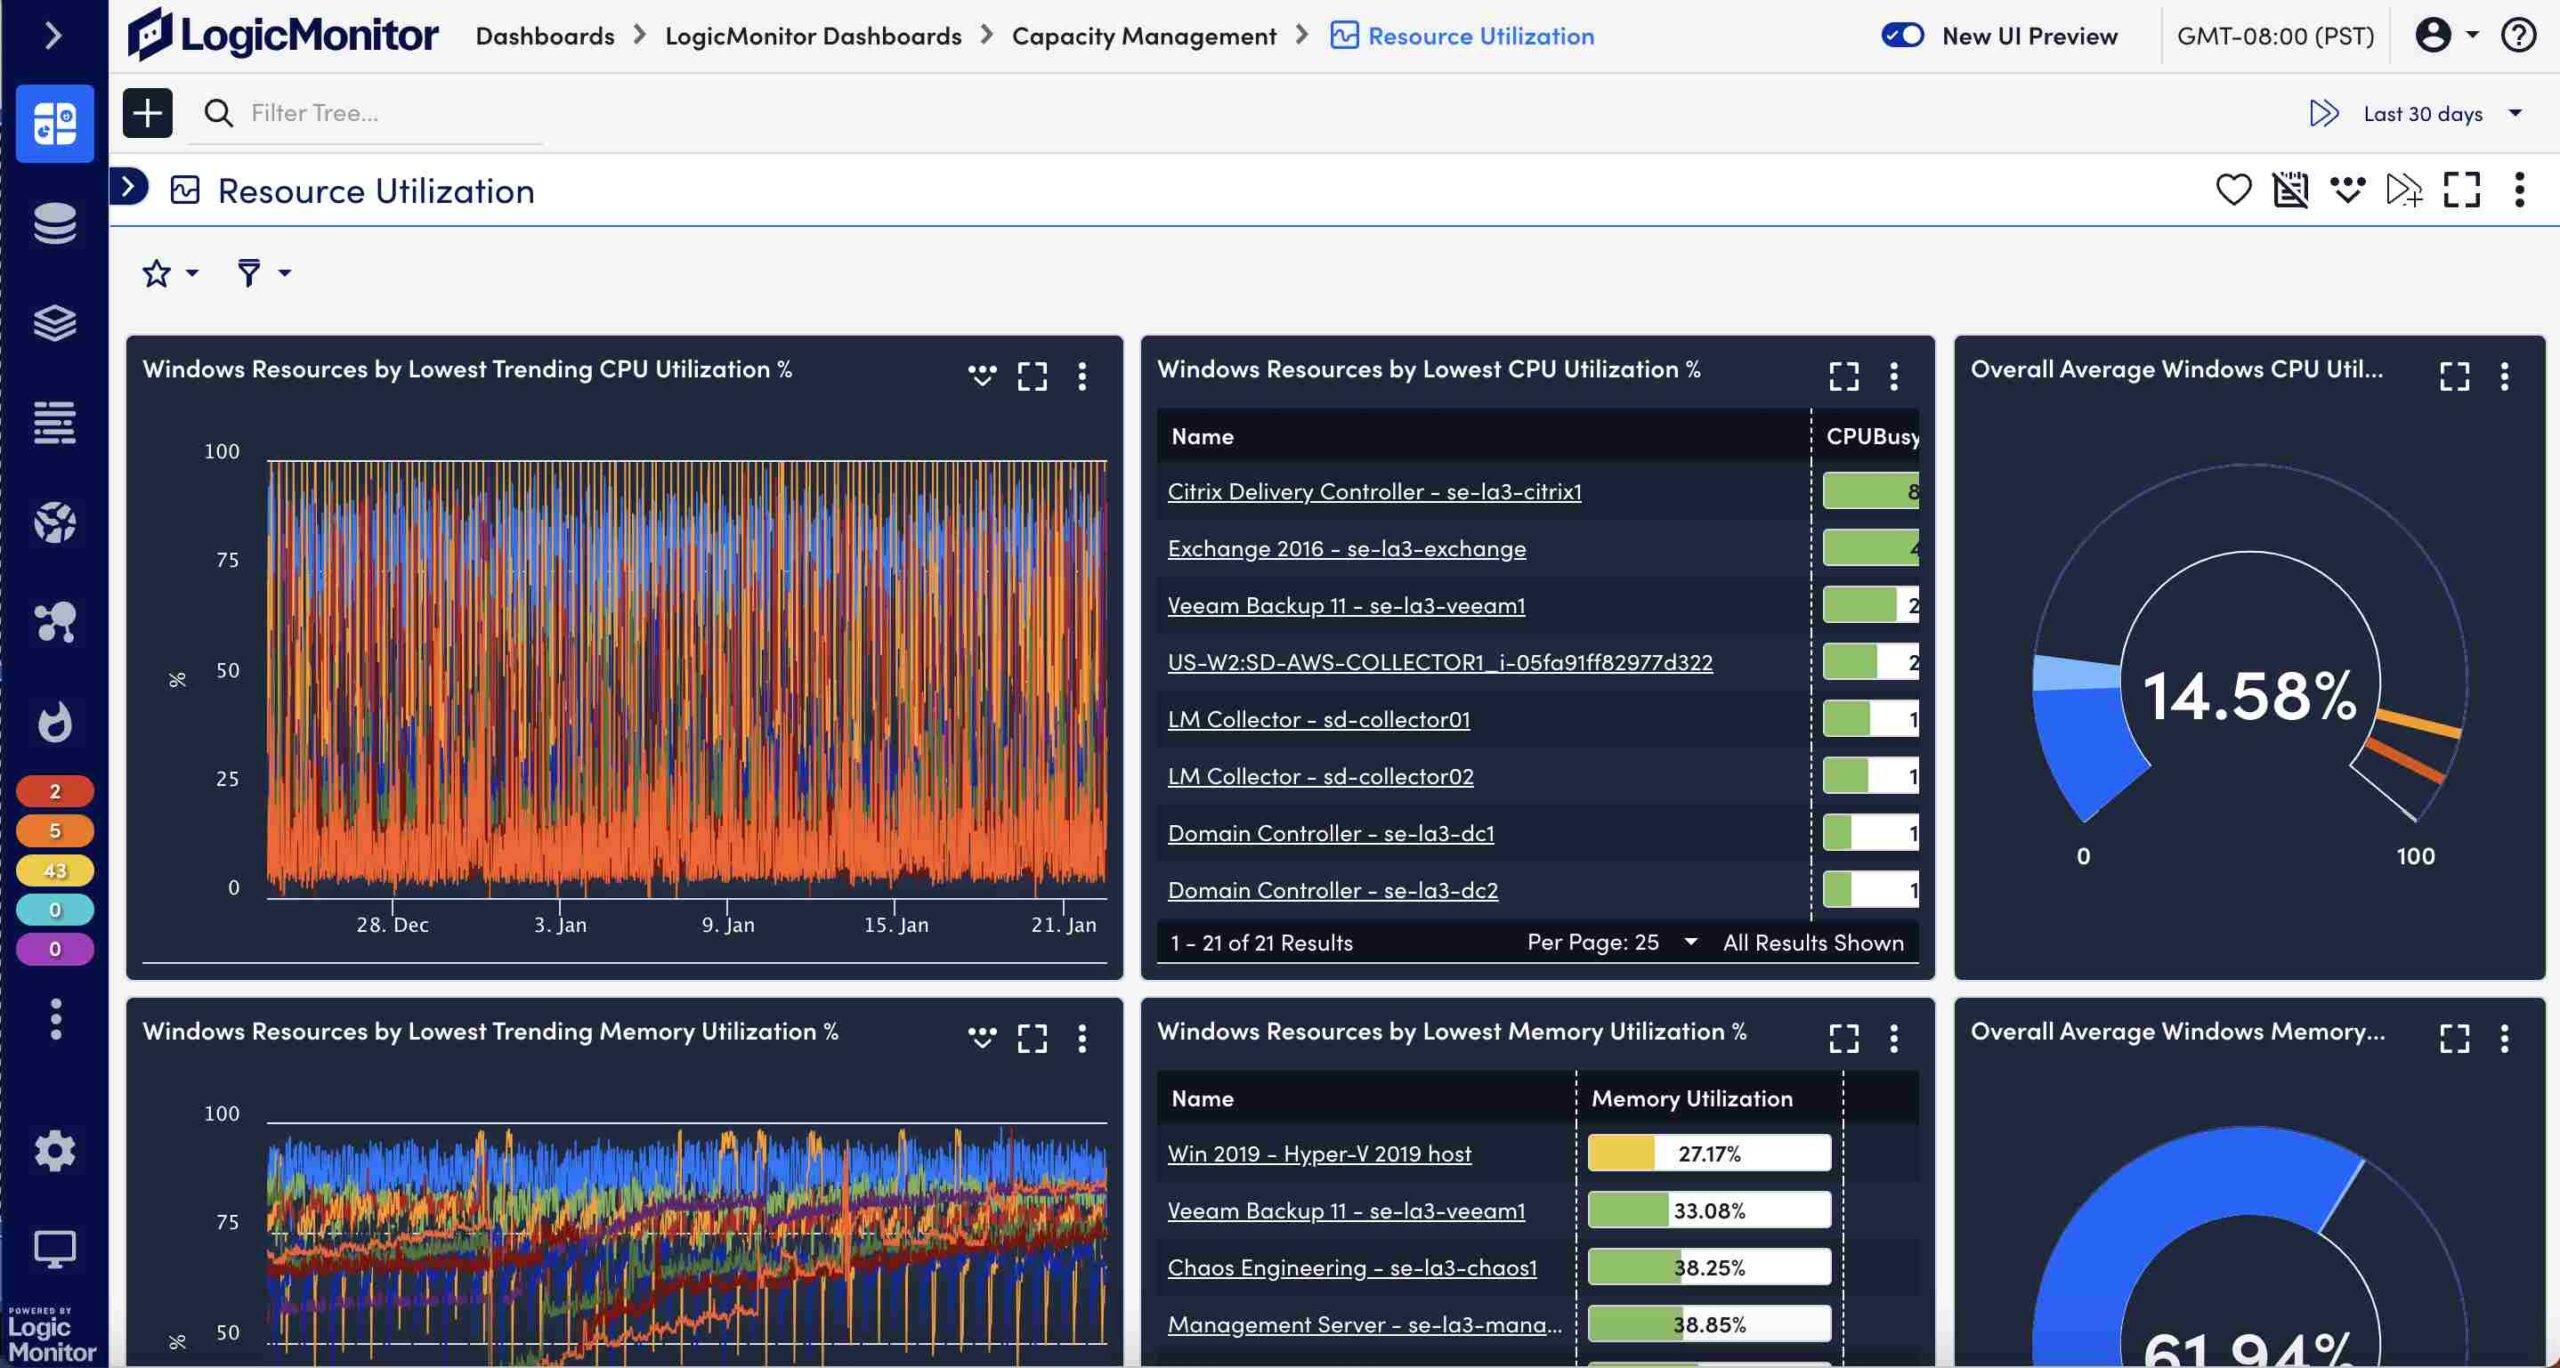
LogicMonitor
LogicMonitor delivers a SaaS-based infrastructure monitoring platform with extensive coverage across on-premises, cloud, and hybrid environments.
Key Features
- Automated discovery and monitoring
- Comprehensive infrastructure visibility
- Cloud monitoring
- NetFlow analysis
- Configurable alerting
- LM Intelligence AIOps
- Extensive device support
Pros
- Quick time-to-value with automated discovery
- Comprehensive device support
- Broad technology coverage
- Strong hybrid infrastructure monitoring
- Minimal configuration required
- Predictive alerting capabilities
Cons
- Less advanced APM capabilities
- Premium pricing compared to basic solutions
- Limited log management features
- Learning curve for advanced features
Best For
- Organizations with diverse infrastructure components
- MSPs managing multiple client environments
- Companies with hybrid cloud deployments
- IT operations teams requiring comprehensive device monitoring
Prometheus
Prometheus has become the de facto standard for container monitoring, especially in Kubernetes environments, offering a powerful open-source monitoring system with a dimensional data model.
Key Features
- Time-series database
- Powerful query language (PromQL)
- Native Kubernetes monitoring
- Service discovery
- Alerting and notification
- Extensive exporter ecosystem
- Grafana integration
Pros
- Open-source with no licensing costs
- Cloud Native Computing Foundation project
- Designed for container environments
- Highly scalable architecture
- Strong community support
- Extensive integration options
Cons
- Steep learning curve
- Requires significant configuration
- Limited visualization without Grafana
- Maintenance overhead
- Challenging long-term storage
Best For
- Kubernetes environments
- DevOps teams comfortable with open-source tools
- Organizations with container-based infrastructure
- Companies seeking cost-effective monitoring solutions
How to Choose the Right DataDog Competitor
When selecting a DataDog competitor for your monitoring needs, consider these key factors:
- Environment Compatibility: Match the solution to your infrastructure (cloud, on-premises, hybrid).
- Technical Requirements: Assess which observability pillars you need (metrics, logs, traces, user experience).
- Scale Considerations: Ensure the solution can grow with your organization.
- Implementation Resources: Evaluate the expertise required for successful deployment.
- Budget Constraints: Compare pricing models and total cost of ownership.
- Integration Needs: Verify compatibility with your existing technology stack.
- Team Capabilities: Consider your team's ability to manage the solution.
Conclusion
While DataDog remains a powerful observability platform, the market now offers numerous compelling competitors for organizations seeking different pricing structures, specialized features, or simplified interfaces. From open-source options like Uptrace and Prometheus to enterprise solutions like Dynatrace and AppDynamics, there's a monitoring solution for every business need.
For organizations looking to optimize costs while maintaining comprehensive observability, Uptrace stands out as a particularly strong competitor to DataDog in 2025. With its open-source foundation, intuitive interface, and ability to process billions of spans on a single server, Uptrace delivers enterprise-grade distributed tracing at a fraction of the cost. Ready to switch? Follow the Datadog migration guide.
FAQ
- Which DataDog competitor has the best price-to-feature ratio?
Uptrace offers exceptional value with enterprise features at a fraction of DataDog's cost, making it ideal for cost-conscious organizations seeking comprehensive observability. - What is the best open-source alternative to DataDog?
Prometheus combined with Grafana provides powerful open-source monitoring, while Uptrace offers an open-source foundation with commercial support options. - Which competitor handles Kubernetes monitoring best?
IBM Instana and Dynatrace excel at Kubernetes monitoring with automated discovery and detailed container insights, while Prometheus remains the standard for cloud-native environments. - Can any DataDog competitor handle enterprise-scale deployments?
Dynatrace, AppDynamics, and Splunk are proven enterprise-grade solutions that handle massive-scale deployments across thousands of servers and applications. - Which tool has the most straightforward implementation?
LogicMonitor and Uptrace offer the simplest implementations with automated discovery and minimal configuration requirements. - What's the best DataDog competitor for microservices architectures?
IBM Instana specializes in microservices monitoring with automatic dependency mapping, while Uptrace provides superior distributed tracing for microservices troubleshooting. - Which DataDog competitor offers the best security monitoring?
Splunk leads in security monitoring capabilities, with Elastic and Sumo Logic also providing strong security analytics features. - What DataDog competitor works best for hybrid cloud environments?
LogicMonitor and Dynatrace excel in hybrid environments, providing seamless monitoring across on-premises, private cloud, and public cloud infrastructure. - Which tool provides the best user experience monitoring?
New Relic and AppDynamics offer superior real user monitoring with detailed front-end performance insights and user journey tracking. - How do DataDog competitors handle alerting and notification?
Elastic, Dynatrace, and Uptrace provide sophisticated alerting with anomaly detection, while PagerDuty integration is common across most competitors for incident management.
You may also be interested in: