DataDog vs Grafana [2025 comparison]
DataDog and Grafana are leading tools in the monitoring and data visualization space. While they share some common ground, their approaches and strengths differ significantly. This comprehensive guide will help you choose the right tool for your specific needs in 2024.
Key Takeaways
- DataDog offers a comprehensive, all-in-one monitoring solution
- Grafana excels in customizable data visualization
- Pricing and scalability differ significantly between the two
- Your choice depends on specific monitoring needs and budget
Feature Comparison
| Feature | DataDog | Grafana |
|---|---|---|
| Primary Focus | Full-stack monitoring | Data visualization |
| Data Sources | 400+ integrations | 100+ data sources |
| Alerting | Advanced | Basic (with plugins) |
| APM | Built-in | Via plugins |
| Log Management | Built-in | Via Loki integration |
| Pricing Model | Per-host/per-metric | Open-source core, paid cloud offering |
| Customization | Moderate | High |
| Learning Curve | Steeper | Moderate |
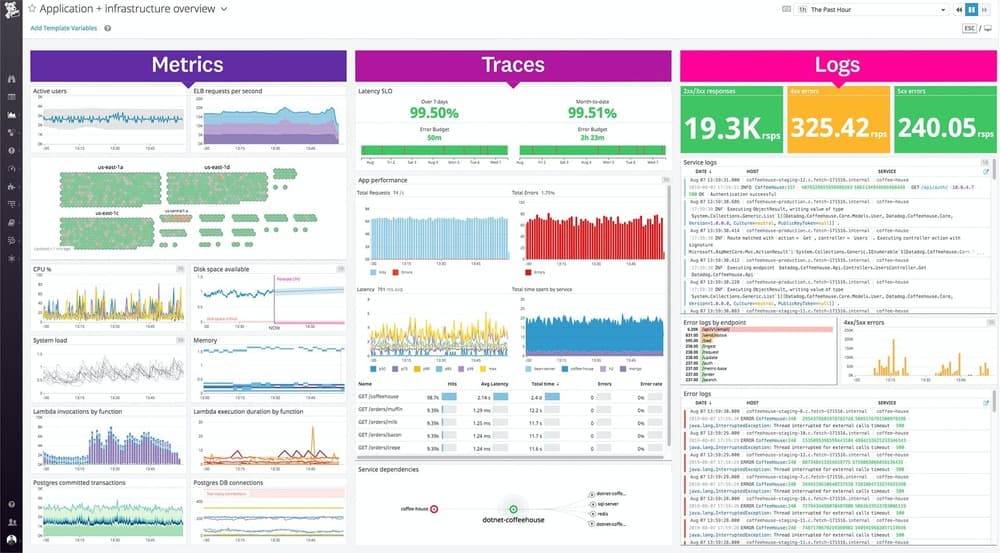
DataDog: Comprehensive Monitoring Solution
DataDog provides an all-encompassing monitoring platform that covers metrics, logs, traces, and real user monitoring (RUM) in a unified system. It offers deep insights into your infrastructure, applications, and user experience metrics, providing a holistic view of your systems.
Key Features
- Extensive Integrations: DataDog boasts over 400 built-in integrations with various technologies, including cloud providers, databases, containers, and orchestration platforms.
- Unified Platform: Combines metrics, traces, and logs in a single interface for comprehensive observability.
- Advanced APM: Offers detailed application performance monitoring with distributed tracing.
- AI-Powered Alerts: Utilizes machine learning for anomaly detection and intelligent alerting.
Real-World Example
A large e-commerce company switched to DataDog to monitor their microservices architecture. They reported a 30% reduction in MTTR (Mean Time To Resolution) due to the correlation between metrics, logs, and traces.
“We monitor an enormous number of data points, and Datadog has been able to keep up with the collection and correlation of these multidimensional metrics without any issues.” - Architecture Manager, MercadoLibre an E-commerce Giant in Latin America
DataDog Pros and Cons
Pros
- All-in-one observability solution
- Extensive integrations
- Powerful APM and distributed tracing
- AI-driven anomaly detection
Cons
- Higher cost, especially at scale
- Steeper learning curve
- Less control over data storage (cloud-based SaaS)
Cost-Efficiency Alert: While DataDog provides extensive features, it's not always the most economical choice. Our DataDog competitors guide identifies more cost-effective monitoring solutions.
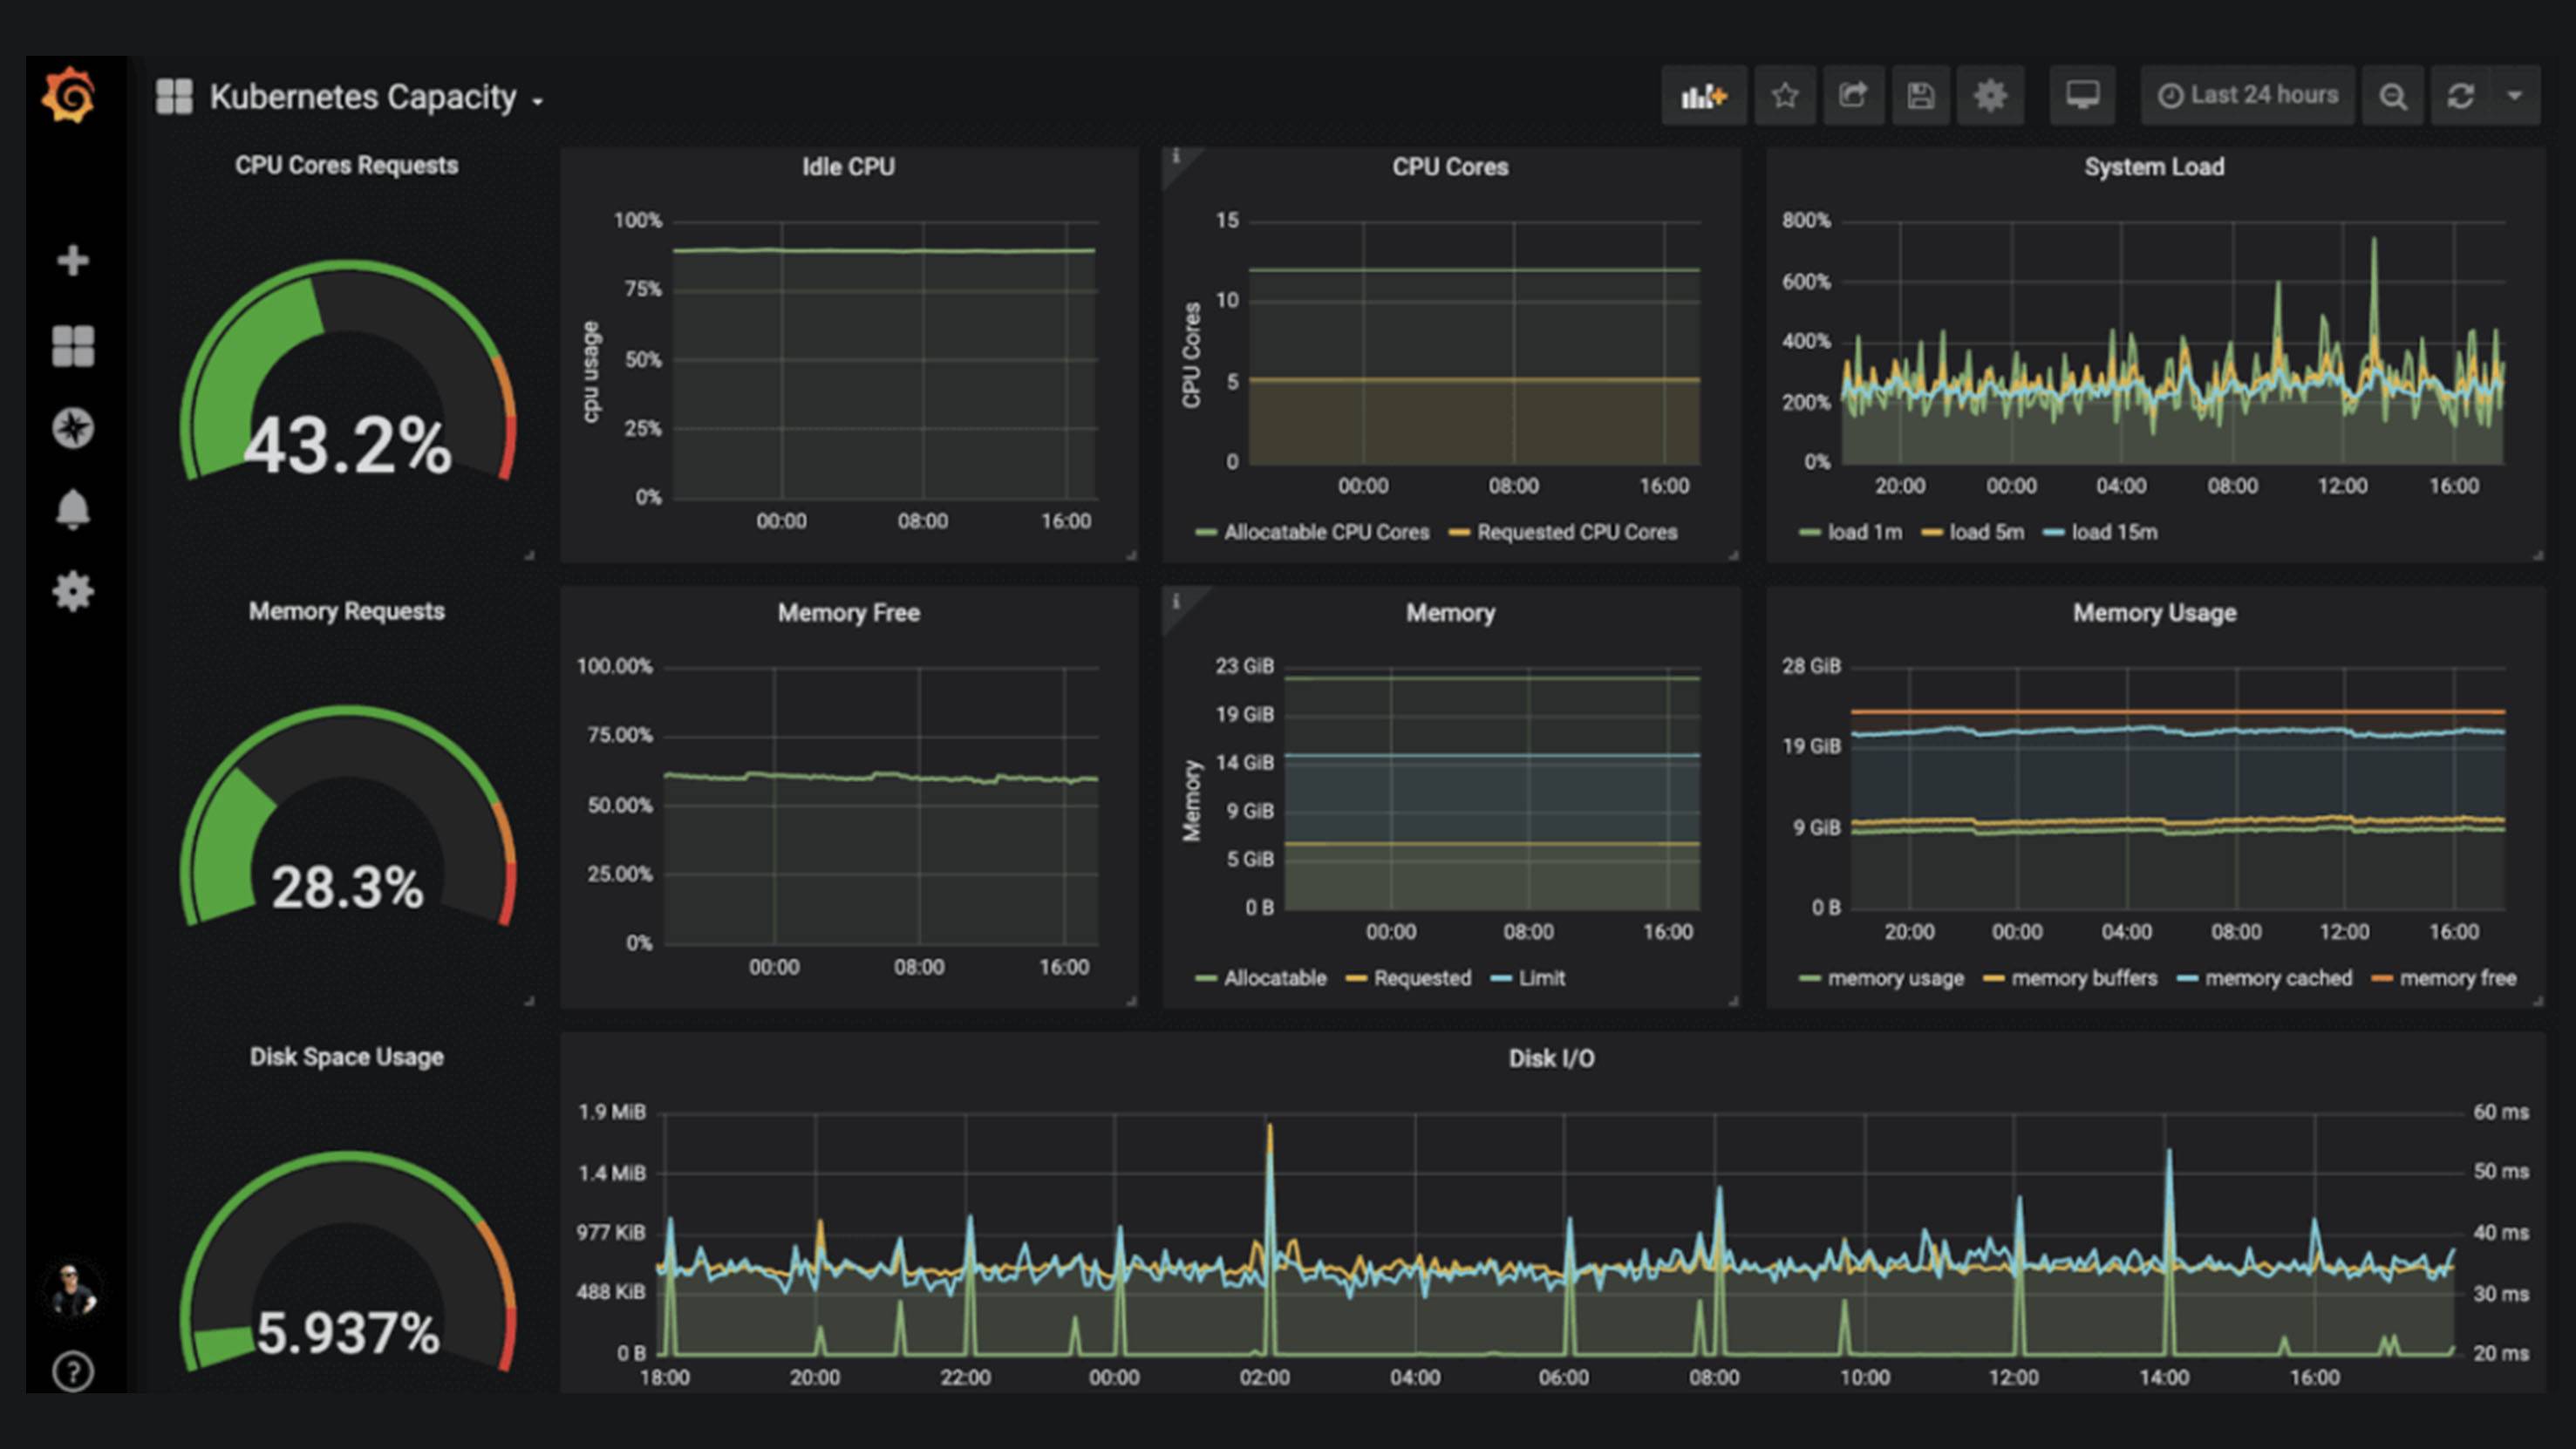
Grafana: Flexible Visualization Platform
Grafana is an open-source visualization and analytics platform that specializes in creating rich, interactive dashboards for time-series data. Its high extensibility and support for a wide range of data sources make it a popular choice for custom monitoring and visualization solutions.
Key Features
- Customizable Dashboards: Offers a wide range of visualization options and extensive customization capabilities.
- Multi-Data Source Support: Integrates with numerous data sources, including InfluxDB, Prometheus, and cloud monitoring platforms.
- Plugin Ecosystem: Extends functionality through a vast array of community-developed plugins.
- Alerting: Provides basic alerting capabilities, expandable through plugins.
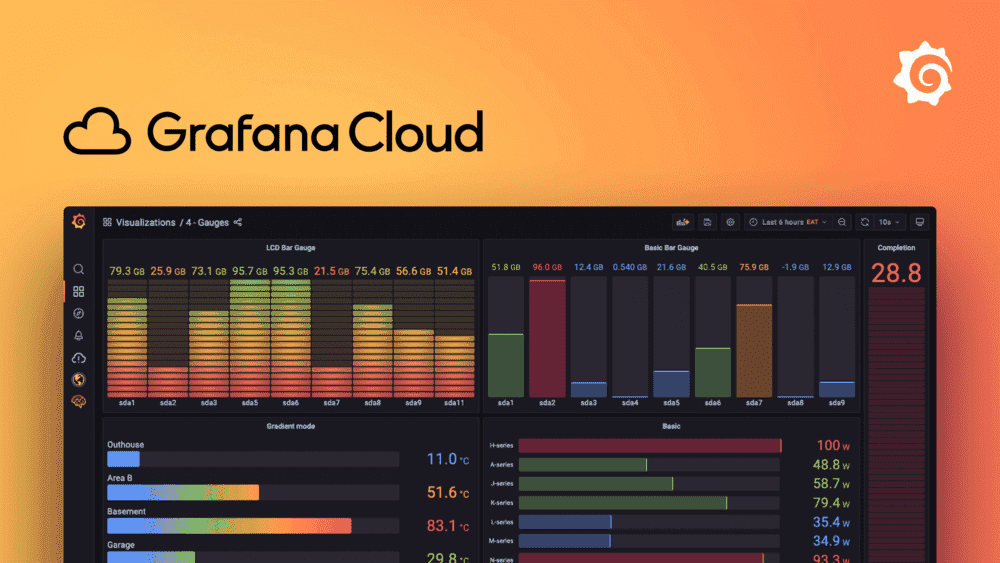
Grafana Cloud
Grafana Cloud builds upon the open-source Grafana platform, offering a managed service that handles infrastructure scaling, maintenance, and updates. It provides an easy-to-use interface for creating and customizing dashboards, visualizing data from multiple sources, and performing in-depth analysis.
Real-World Example
A medium-sized SaaS company adopted Grafana for its flexibility in creating custom dashboards. They were able to combine data from various sources, including Prometheus for metrics and Loki for logs, into a single pane of glass.
"Grafana's customization capabilities allowed us to create exactly the views we needed, improving our team's efficiency in monitoring and troubleshooting." - Jane Masters, CTO at SaaS Innovators
Grafana Pros and Cons
Pros
- Highly customizable visualizations
- Open-source core with strong community support
- Flexible data source integration
- Cost-effective for specific use cases
Cons
- Requires additional tools for full observability stack
- Can be complex to set up and configure
- Limited built-in monitoring capabilities
Pricing Comparison
DataDog Pricing
DataDog uses a per-host or per-metric pricing model, which can become costly for large-scale deployments:
- Infrastructure monitoring starts at $15/host/month
- APM and Continuous Profiler from $40/host/month
- Log Management from $0.10/GB ingested
Grafana Pricing
Grafana offers a free, open-source version and a paid cloud offering:
- Grafana Cloud has a generous free tier
- Paid plans start at $49/month for 3 team members and 3000 series
- Enterprise on-premise solutions available (contact sales)
Conclusion: Making the Right Choice
Choosing between DataDog and Grafana depends on your specific monitoring requirements, preferred features, ease of use, and budget. Consider the following factors:
- Scope of Monitoring: If you need comprehensive observability including APM, log management, and user experience tracking, DataDog provides an all-in-one solution. For focused data visualization and dashboard creation, Grafana might be more suitable.
- Budget: DataDog can be more expensive, especially at scale, while Grafana offers a more cost-effective solution for specific use cases.
- Customization Needs: If highly customizable visualizations are a priority, Grafana has the edge.
- Integration Requirements: Both tools offer extensive integrations, but DataDog's built-in integrations might be more convenient for some users.
- Team Expertise: Consider the learning curve and your team's existing skills when choosing between these tools.
Ultimately, many organizations find value in using both tools - DataDog for comprehensive monitoring and Grafana for specialized visualizations. Evaluate your specific needs, try out both platforms, and make an informed decision based on your unique requirements.
If cost or vendor lock-in is driving the decision, an OpenTelemetry-native option like Uptrace is worth evaluating too — see the Datadog migration guide if you're ready to move.
FAQ
- Can Grafana replace DataDog completely? While Grafana can replicate some of DataDog's functionality through plugins and integrations, it may require more setup and additional tools to match DataDog's comprehensive offering.
- Is DataDog more suitable for large enterprises? DataDog's all-in-one solution and scalability make it attractive for large enterprises, but it can be effectively used by businesses of all sizes.
- Can I use Grafana with DataDog? Yes, Grafana can use DataDog as a data source, allowing you to create custom visualizations of your DataDog metrics.
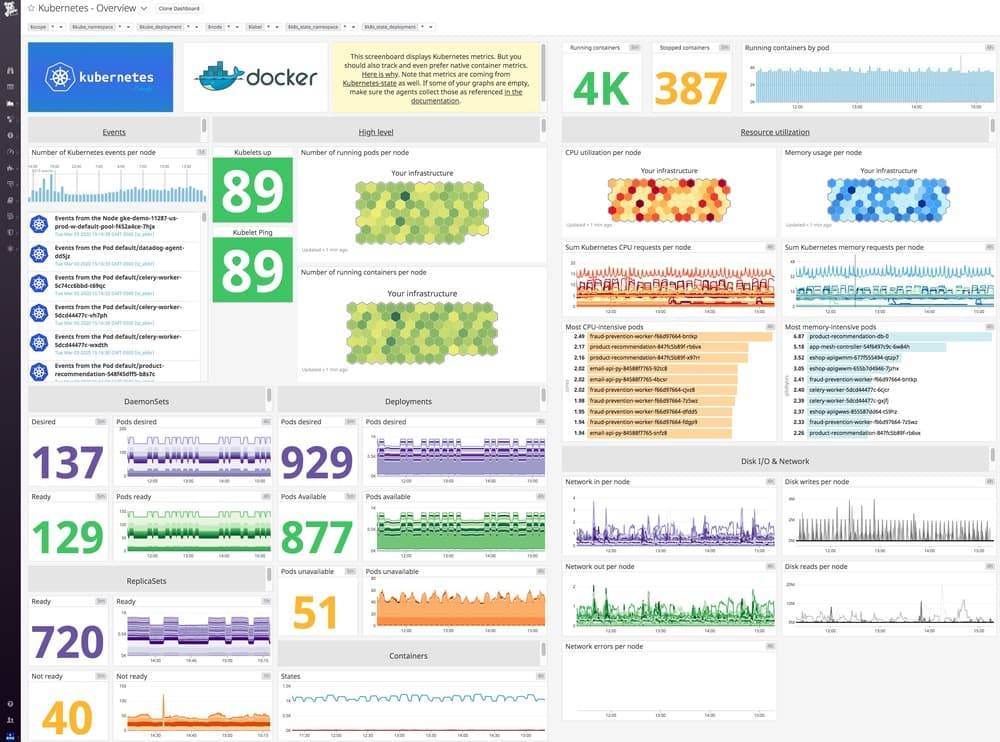
- Which tool is better for Kubernetes monitoring? Both tools offer strong Kubernetes monitoring capabilities. DataDog has more built-in features, while Grafana allows for more customization when combined with Prometheus.
- How do the alerting capabilities compare? DataDog offers more advanced, out-of-the-box alerting with AI-driven anomaly detection. Grafana's alerting is more basic but can be extended with plugins.
Ready to explore further? Try out both DataDog and Grafana to see which fits your needs best!
You may also be interested in: