DataDog vs Prometheus [2025 comparison]
DataDog and Prometheus are both popular monitoring solutions used to collect and analyze metrics and monitor the performance of systems, but Prometheus is open source and Datadog is proprietary.
Datadog provides a unified platform for monitoring, troubleshooting, and optimizing modern cloud-native applications and infrastructure. Prometheus is the most popular tool for monitoring time series metrics.
So, how to choose between Datadog and Prometheus? This guide provides a head-to-head comparison between both products based on installation complexity, user interface, running costs, and more.
DataDog Key Features
Datadog is a cloud-based monitoring and analytics platform that provides real-time visibility into the performance and behavior of applications, infrastructure, and cloud services.
DataDog allows you to monitor, troubleshoot, and optimize cloud-based applications all the way down to a single line of code or individual user requests.
DataDog is most commonly used for cloud-based applications to measure and monitor performance. It provides end-to-end distributed tracing from user devices to backend databases.
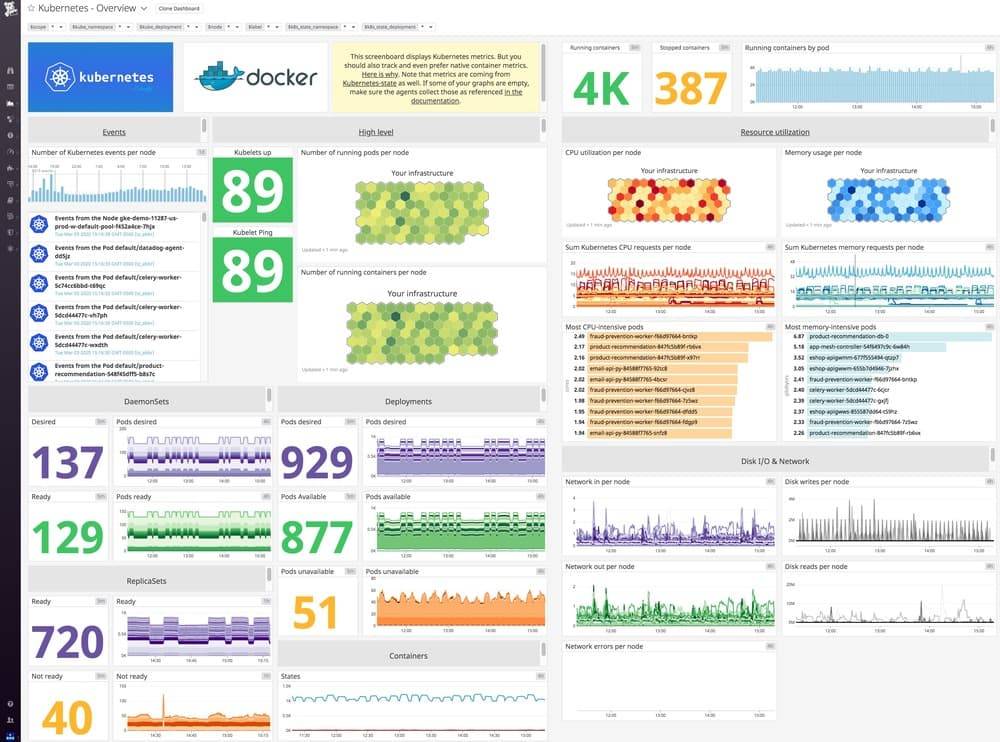
DataDog comes with a large collection of pre-built dashboards, for example, the Kubernetes dashboard shows you an overview of pods, nodes, deployments, and more. If you are not satisfied with the results, you can create your own dashboards.
DataDog offers a comprehensive alerting system that can notify you when CPU load is above a certain threshold or when DataDog detects an anomaly in the data.
Tech Stack Optimization: DataDog might not integrate seamlessly with all environments. Our guide to DataDog competitors can help you find better-suited monitoring options for your tech stack.
Prometheus Key Features
Prometheus is an open-source monitoring system with flexible query language and real-time alerting. Prometheus collects metrics from various sources and provides real-time visibility into performance and behavior of applications, infrastructure, and services.
Prometheus is widely used in cloud-native environments, and integrates well with other open source tools and platforms, such as Kubernetes and Grafana.
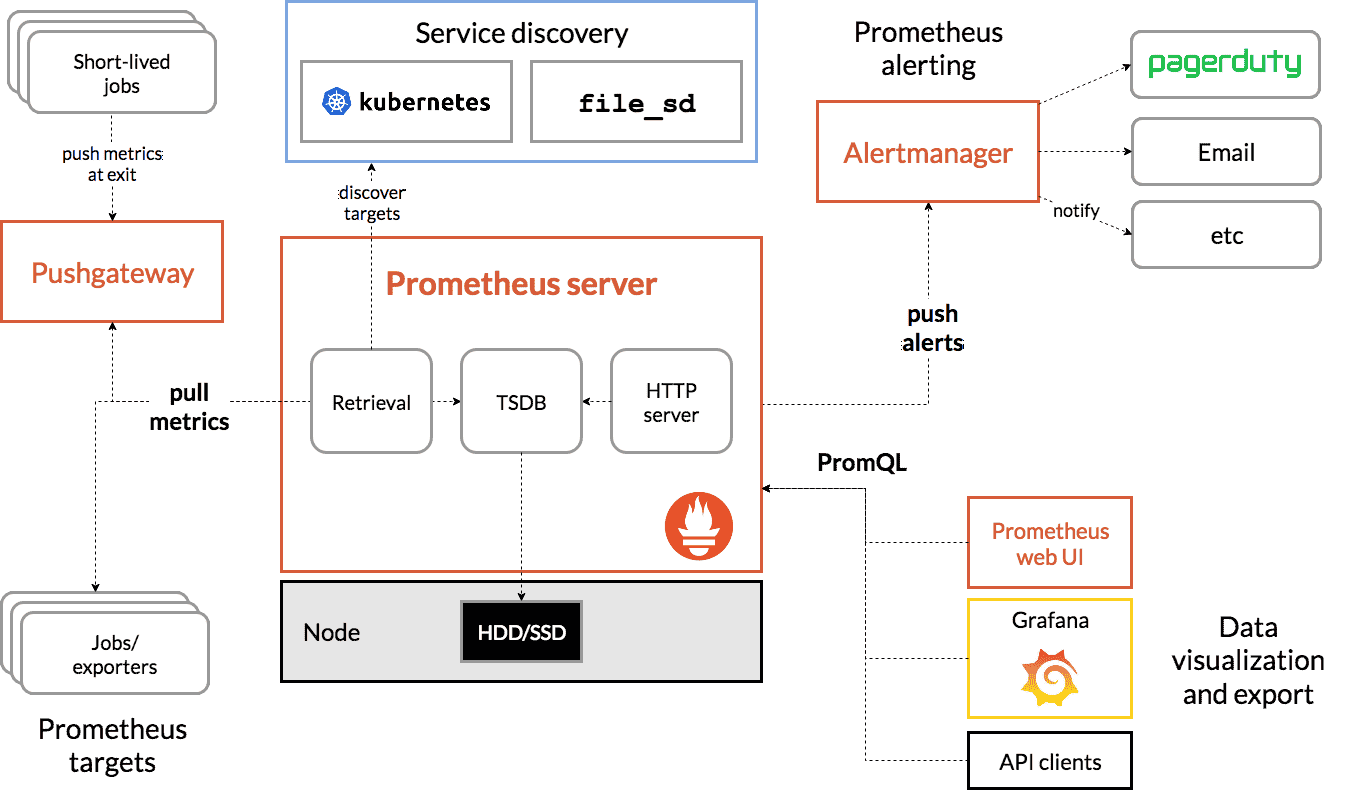
Prometheus does not have a lot of built-in functionality, but it can be easily extended with plugins. If you need an alerting system, you can install AlertManager. If you want rich dashboards with wide variety of charts and widgets, you can install Grafana and use Prometheus as a data source. Learn more about Prometheus metrics, including receiving and exporting them, at Prometheus: Receiving and Exporting Metrics.
Prometheus has its own query language called PromQL that lets users select and aggregate time series data in real time. Learning the language requires some effort and time, but it is worth doing so.
Prometheus also provides a flexible alerting system, enabling organizations to set up rules and receive notifications in real-time when performance thresholds are breached.
Key differences between Datadog and Prometheus
As you can see, there are some similarities between Prometheus and DataDog in terms of supported features and functionality, but there are also significant differences.
DataDog is much more broadly applicable, providing performance monitoring, alert management, and data analysis in one place. Prometheus focuses primarily on collecting and monitoring metrics.
You can start using DataDog immediately after creating an account and installing an agent, but with Prometheus you may need to install additional third-party plug-ins.
In terms of sheer number of features, Datadog is far ahead, but the initial setup can be a bit overwhelming. On the other hand, Prometheus is much easier to get started with and comes with a rich ecosystem of tools and plug-ins that can be added later.
Data collection and storage
DataDog uses a proprietary agent-based approach to collect and route metrics and logs to its cloud platform. It provides automated instrumentation and integration with various frameworks and libraries. DataDog provides its own storage backend and handles data retention and scalability.
Prometheus, being open source, provides a pull-based model where applications and systems expose their metrics in a standardized format. Prometheus scrapes metrics from these endpoints and stores them locally in its time series database.
Prometheus stores metrics in a time series database with unique metric names and key-value pairs for filtering. It uses a pull-based model to collect metrics from target systems and provides a powerful query language and graphical user interface for data analysis and visualization.
Cost and licensing
DataDog is a commercial product with pricing based on usage and features. It offers different pricing tiers and plans based on the number of monitored hosts, metrics, and additional features.
Prometheus, being open source, is free to use and has no direct licensing costs. However, there may be costs associated with hosting, storage, and management the Prometheus infrastructure.
Choosing the right tool
Both products have great features and robust monitoring capabilities, but before making a decision, consider your organization's resources and goals.
You may also want to consider open source DataDog Alternatives such as Uptrace which can provide the same functionality for a lower price.
Uptrace is an open source APM for OpenTelemetry with an intuitive query builder, rich dashboards, automated alerts, and integrations for most languages and frameworks.
Uptrace can process billions of spans on a single server, allowing you to monitor your software at 10x less cost.
- If you just need metrics, Prometheus is the right choice for you.
- If you need tracing and logging in addition to metrics, try Uptrace.
- If you need a little bit of everything and are not afraid of the associated costs, DataDog is your choice.
Conclusion
The choice between DataDog and Prometheus depends on a number of factors, including specific monitoring requirements, budget, existing infrastructure, and preference for open source or commercial solutions.
DataDog offers a comprehensive, all-in-one solution with additional features and support, while Prometheus offers flexibility, extensibility, and a vibrant open source community.
DataDog is a SaaS-based application with complex pricing tiers and can be quite expensive if you need to monitor lots of resources. As for Prometheus, it is completely free and does not require much maintenance.
Prometheus is a good fit for organizations that need a scalable and open-source monitoring solution for their cloud-native applications, while Datadog is a better choice for organizations that require a more comprehensive and integrated monitoring platform for their entire technology stack.
If you want Prometheus-compatible metrics plus traces and logs in one open-source platform, Uptrace combines both — see the Datadog migration guide for a path off Datadog.
FAQ
- What are the main differences between Datadog and Prometheus? Datadog is a comprehensive SaaS platform offering metrics, traces, and logs monitoring with built-in features, while Prometheus is an open-source solution focused primarily on metrics collection. Datadog uses an agent-based approach, while Prometheus uses a pull-based model.
- How do their pricing models compare? Prometheus is free and open-source but requires infrastructure and maintenance costs. Datadog uses a subscription model based on hosts, metrics, and features, which can become expensive for large deployments. Consider total cost of ownership when making a decision.
- Which tool is better for cloud-native applications? Both excel in cloud environments:
- Prometheus integrates naturally with Kubernetes and cloud-native tools
- Datadog offers more comprehensive cloud monitoring features
- Both support container monitoring
- Consider your specific cloud architecture needs
- What about ease of setup and maintenance? Their approaches differ significantly:
- Datadog offers quick setup with immediate monitoring capabilities
- Prometheus requires more initial configuration but is more flexible
- Datadog handles scaling automatically
- Prometheus needs manual scaling configuration
- How do they handle data storage? The storage approaches are quite different:
- Prometheus stores data locally in its time-series database
- Datadog manages data storage in their cloud platform
- Prometheus offers options for remote storage
- Consider retention needs and data volume
- Which has better visualization capabilities? Each has different strengths:
- Datadog provides built-in, sophisticated dashboards
- Prometheus typically pairs with Grafana for visualization
- Datadog offers more out-of-box visualizations
- Prometheus/Grafana combination offers more customization
- How do they compare for alerting? Both offer robust alerting:
- Datadog includes advanced alerting with machine learning capabilities
- Prometheus uses Alertmanager for flexible alert routing
- Datadog provides more integrated alerting features
- Prometheus requires additional setup but offers more control
- Is there a middle-ground alternative? Yes, tools like Uptrace offer a balance:
- Open-source with commercial support options
- Combines metrics, traces, and logs
- More cost-effective than Datadog
- Easier setup than Prometheus
You may also be interested in: