Kibana vs Grafana - Comparison for Advanced Monitoring and Observability [2025 Guide]
Kibana and Grafana are the leading options when selecting a tool for observability and monitoring in cloud environments. This guide extensively explores their variances to assist you in selecting the most suitable option for your requirements. Understanding these tools is crucial for effective system monitoring, whether managing a small startup or a large enterprise.
User Interface & Experience
The user interface is often the first point of interaction and can significantly impact user adoption and efficiency.
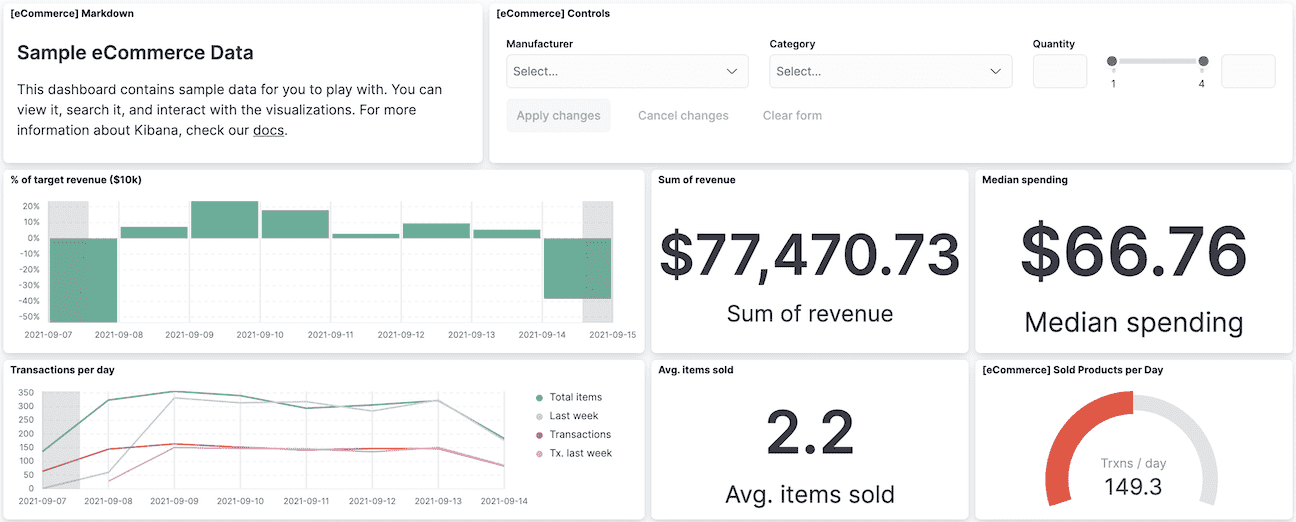
Kibana
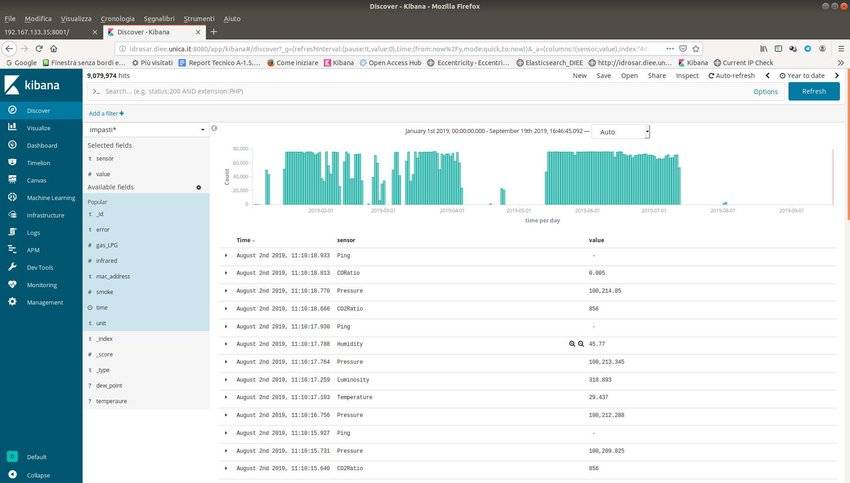
- Design Philosophy: Clean, minimalist interface optimized for Elasticsearch data.
- Learning Curve: Steeper for users unfamiliar with Elasticsearch, but intuitive for those within the Elastic ecosystem.
- Customization: Limited compared to Grafana, focuses on out-of-the-box functionality.
- Dashboards: Easy to create basic dashboards, but less flexible for complex, multi-source visualizations.
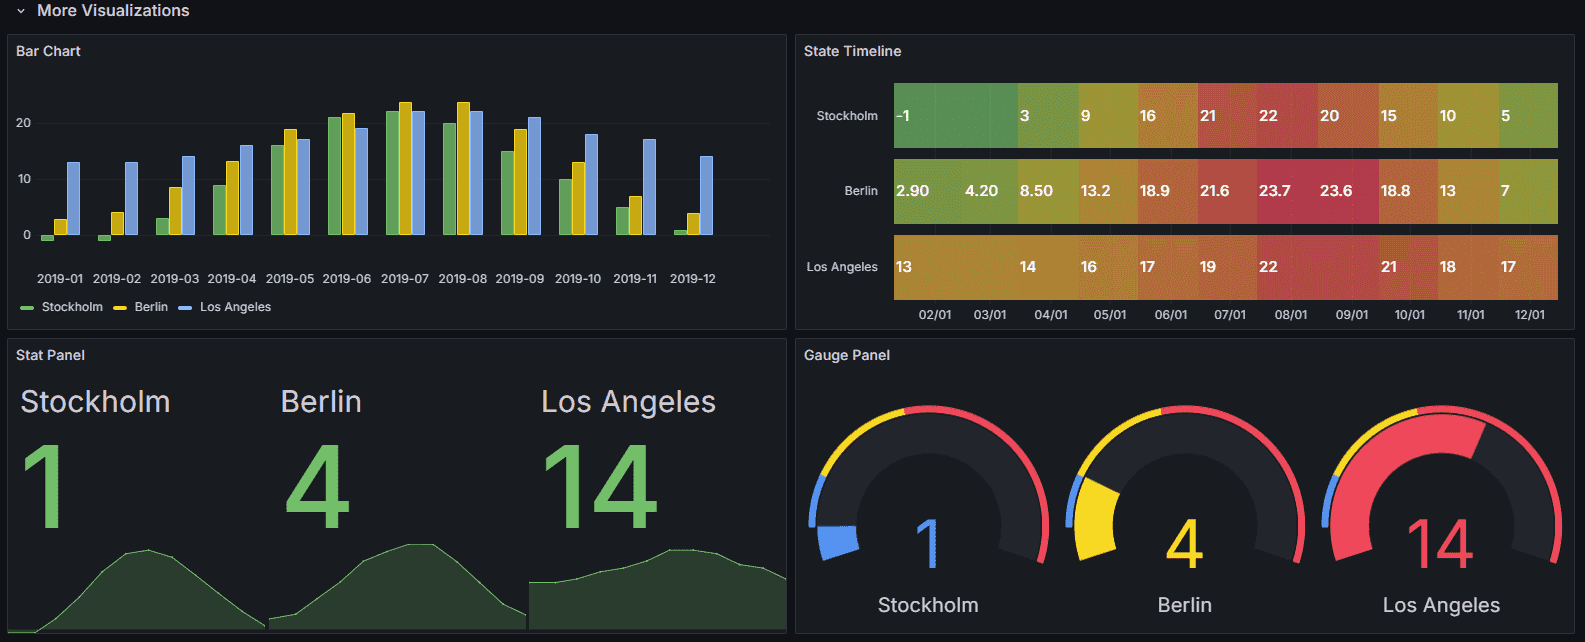
Grafana
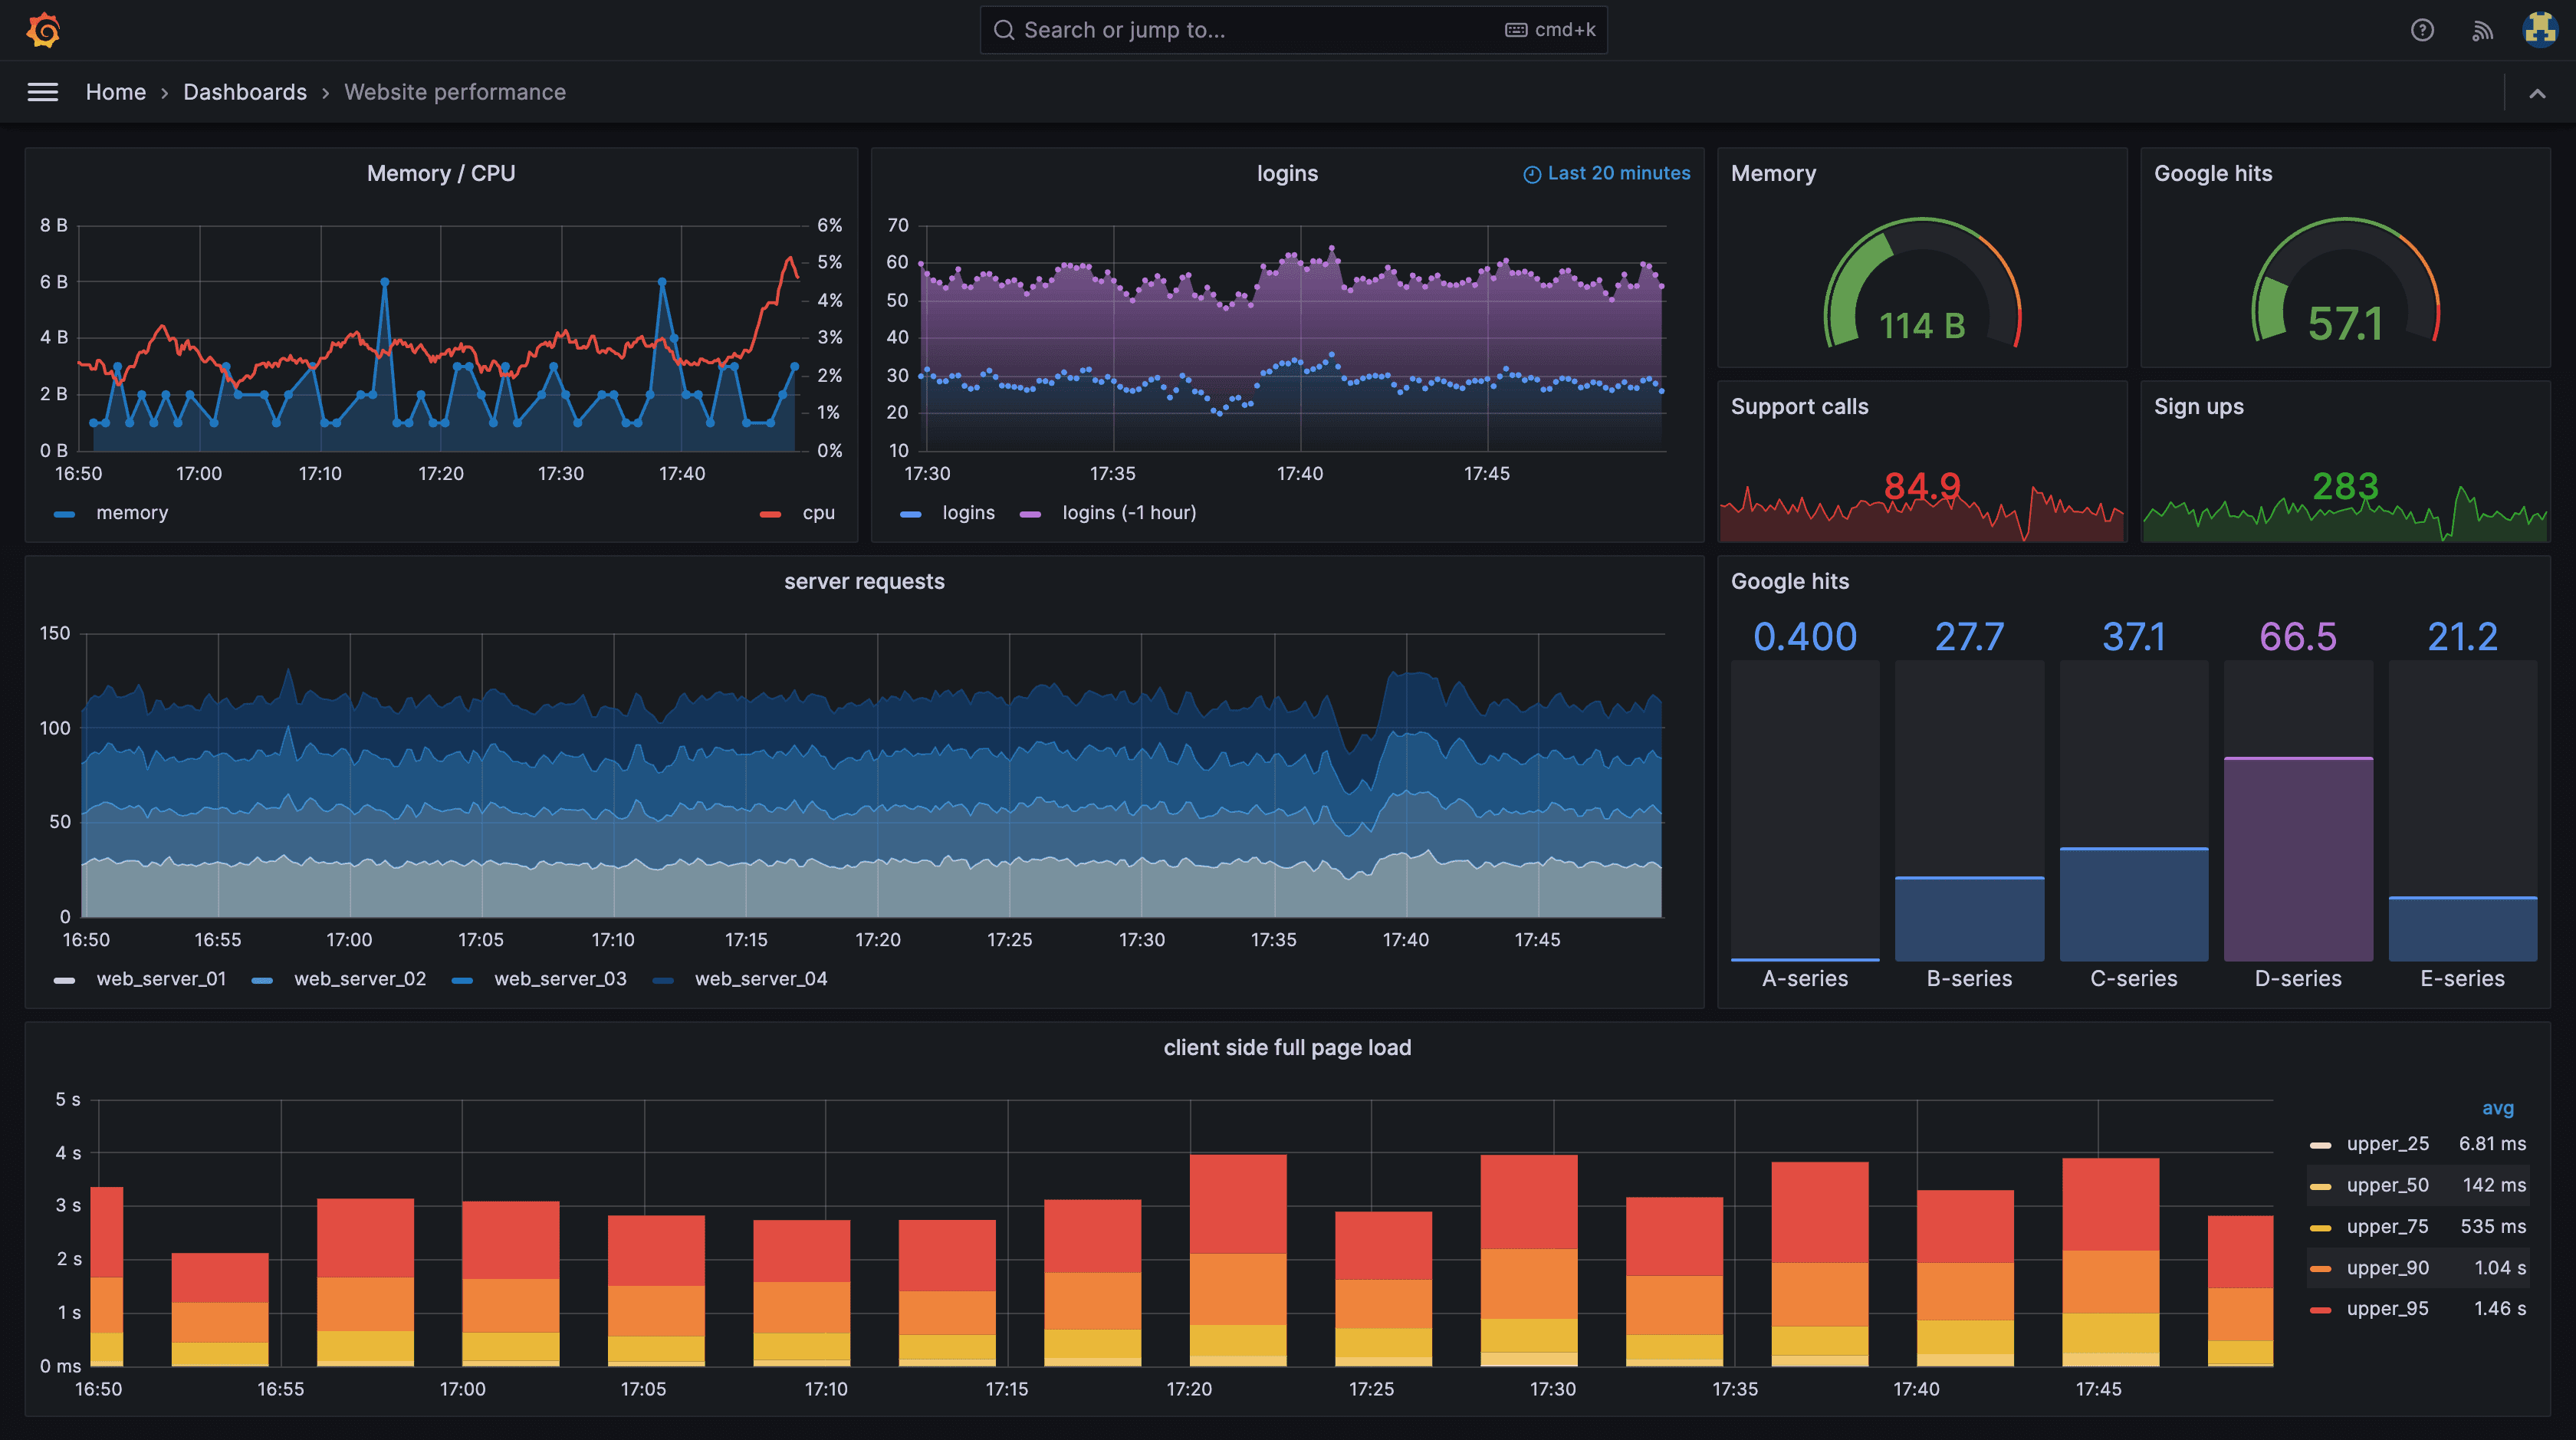
- Design Philosophy: Highly customizable, plugin-based architecture.
- Learning Curve: Generally considered more accessible for diverse data sources.
- Customization: Extensive options for dashboard layout, panel design, and data representation.
- Dashboards: Supports complex, multi-datasource dashboards with a wide range of visualization options.
| Feature | Kibana | Grafana |
|---|---|---|
| UI Customization | Limited | Extensive |
| Out-of-the-box Experience | Excellent for Elasticsearch | Good for multiple sources |
| Dashboard Sharing | Basic sharing options | Advanced sharing and embedding |
| Mobile Experience | Limited | Responsive design, dedicated mobile app |
Pro Tip: When evaluating the UI, consider not just the initial ease of use, but also the long-term flexibility as your monitoring needs grow and evolve.
Querying Capabilities
The ability to effectively query and analyze data is at the heart of any monitoring solution.
Kibana
- Query Language: Uses Elasticsearch Query DSL and Lucene query syntax.
- Strengths:
- Powerful for full-text search and log analysis
- Excellent for unstructured and semi-structured data
- Limitations:
- Complex for users not familiar with Elasticsearch
- Limited to Elasticsearch data sources
Grafana
- Query Language: Supports multiple query languages depending on the data source.
- Supported Languages:
- PromQL for Prometheus
- InfluxQL and Flux for InfluxDB
- SQL for relational databases
- Elasticsearch DSL for Elasticsearch
- Strengths:
- Versatile across different data types and sources
- Can combine queries from multiple sources in a single dashboard
Query Comparison Example:
Elasticsearch query in Kibana:
{
  "query": {
    "bool": {
      "must": [
        { "match": { "status": "error" } },
        { "range": { "@timestamp": { "gte": "now-1d/d", "lt": "now/d" } } }
      ]
    }
  }
}
Equivalent PromQL query in Grafana (assuming Prometheus data):
sum(rate(http_requests_total{status="error"}[1d]))
Key Consideration: If your data lives primarily in Elasticsearch, Kibana's native integration provides a more streamlined experience. For environments with diverse data sources, Grafana's flexibility is unparalleled.
Integration & Ecosystem
The ability to integrate with various data sources and tools can significantly impact the overall effectiveness of your monitoring solution.
Kibana
- Core Integration: Tightly integrated with the Elastic Stack (Elasticsearch, Logstash, Beats).
- Data Sources:
- Primary: Elasticsearch
- Limited support for other sources through Elastic's integrations
- Plugin Ecosystem:
- More limited compared to Grafana
- Focuses on enhancing Elastic Stack functionality
Grafana
- Core Integration: Designed to be data source agnostic.
- Data Sources: Supports 85+ data sources including:
- Time-series databases: Prometheus, InfluxDB, Graphite
- Logging: Loki, Elasticsearch
- Cloud providers: AWS CloudWatch, Azure Monitor, Google Cloud Monitoring
- Relational databases: MySQL, PostgreSQL
- Tracing: Jaeger, Zipkin
- Plugin Ecosystem:
- Extensive marketplace with community and official plugins
- Easily extensible for custom data sources and visualizations
| Feature | Kibana | Grafana |
|---|---|---|
| Primary Ecosystem | Elastic Stack | Multi-vendor |
| Number of Supported Data Sources | Limited | 85+ |
| Custom Data Source Development | Complex | Straightforward |
| Third-party Integrations | Limited | Extensive |
Integration Example: Monitoring a microservices architecture
- With Kibana:
- Use Filebeat to collect logs
- Process logs with Logstash
- Store in Elasticsearch
- Visualize in Kibana
- With Grafana:
- Collect metrics with Prometheus
- Store logs in Loki
- Implement tracing with Jaeger
- Visualize all in Grafana dashboards
Explore Elastic Stack integrations
Browse Grafana's supported data sources
Visualizations & Performance
Effective data visualization is crucial for understanding complex systems and identifying issues quickly.
Kibana
- Visualization Types:
- Strong in log and text-based visualizations
- Basic charts: line, bar, pie, area
- Specialized: heat maps, gauge, goal
- Geospatial: coordinate maps, region maps
- Strengths:
- Excellent for log analysis and text-based data exploration
- Powerful data tables with drill-down capabilities
- Limitations:
- Less variety in graph types compared to Grafana
- Limited customization options for individual visualizations
Grafana
- Visualization Types:
- Comprehensive set of charts: line, bar, pie, gauge, heatmap
- Advanced: flame graphs, state timeline, node graph
- Geospatial: world map, geo map
- Custom panels through plugins
- Strengths:
- Highly customizable visualizations
- Support for real-time data and streaming
- Ability to mix different visualization types in a single dashboard
- Limitations:
- Can be overwhelming for beginners due to the vast number of options
Performance Considerations:
- Kibana:
- Optimized for Elasticsearch, handles large log volumes efficiently
- Can slow down with complex aggregations on very large datasets
- Grafana:
- Generally faster for time-series data, especially with Prometheus
- Performance can vary depending on the underlying data source
Visualization Comparison:
| Feature | Kibana | Grafana |
|---|---|---|
| Time-series Graphs | Good | Excellent |
| Log Visualization | Excellent | Good |
| Geospatial Mapping | Good | Excellent |
| Custom Visualizations | Limited | Extensive through plugins |
| Real-time Data Support | Limited | Excellent |
Pro Tip: When dealing with large datasets, consider using pre-aggregated data or summary indices in Elasticsearch for Kibana, and recording rules in Prometheus for Grafana to improve dashboard performance.
Alerting & Notification Systems
Effective alerting is crucial for proactive monitoring and quick incident response.
Kibana
- Alerting System: Elastic Alerting (part of Stack Management)
- Features:
- Rule-based alerts on Elasticsearch data
- Supports various alert conditions (metric threshold, anomaly detection)
- Integrates with Elastic's machine learning capabilities
- Notification Channels: Email, Slack, webhook, PagerDuty
- Strengths:
- Deep integration with Elasticsearch queries
- Anomaly detection-based alerts
Grafana
- Alerting System: Grafana Alerting (unified system as of Grafana 8.0)
- Features:
- Multi-datasource alerting
- Support for complex alert conditions
- Alert grouping and silencing
- Notification Channels: Email, Slack, webhook, PagerDuty, custom integrations
- Strengths:
- Flexible alerting across different data sources
- Visual alert rule editor
Alerting Example:
Kibana alert for high CPU usage:
- name: High CPU Usage
  trigger:
    schedule:
      interval: 1m
  conditions:
    - type: threshold
      field: system.cpu.usage
      threshold: 90
      comparator: gt
      timeframe:
        minutes: 5
  actions:
    - send_email:
        to: ['ops@example.com']
Equivalent Grafana alert:
- name: High CPU Usage
  rules:
    - expr: avg(system_cpu_usage) > 90
      for: 5m
      labels:
        severity: warning
  notifications:
    - email:
        to: ['ops@example.com']
Key Consideration: If your monitoring stack is primarily Elastic-based, Kibana's alerting will be more native. For multi-source environments, Grafana's alerting system offers more flexibility.
Machine Learning & Anomaly Detection
As systems become more complex, machine learning-driven insights become increasingly valuable for identifying unusual patterns and potential issues.
Kibana
- ML Capabilities: Part of the Elastic Stack X-Pack features
- Key Features:
- Unsupervised anomaly detection
- Forecasting based on historical data
- Job management and tuning interface
- Use Cases:
- Detecting unusual log patterns
- Identifying abnormal metric spikes
- Predicting system resource usage
Grafana
- ML Capabilities: Available through plugins and integrations
- Key Features:
- Anomaly detection panels
- Integration with external ML services (e.g., Amazon SageMaker)
- Community-driven ML plugins
- Use Cases:
- Identifying outliers in time-series data
- Forecasting trends for capacity planning
- Clustering similar metrics or logs
ML Implementation Example:
Kibana ML job for detecting unusual CPU usage:
{
  "job_id": "unusual_cpu_usage",
  "analysis_config": {
    "bucket_span": "15m",
    "detectors": [
      {
        "function": "mean",
        "field_name": "system.cpu.user.pct"
      }
    ],
    "influencers": ["host.name"]
  },
  "data_description": {
    "time_field": "@timestamp"
  }
}
Grafana anomaly detection using TensorFlow.js plugin:
import * as tf from '@tensorflow/tfjs'

const model = tf.sequential({
  layers: [
    tf.layers.dense({ inputShape: [10], units: 5, activation: 'relu' }),
    tf.layers.dense({ units: 1 }),
  ],
})

model.compile({ optimizer: 'sgd', loss: 'meanSquaredError' })

// Train the model with your time-series data
// Use the model to predict anomalies
Pro Tip: While Kibana offers more out-of-the-box ML capabilities, Grafana's flexibility allows for integration with a wider range of ML tools and services. Consider your team's ML expertise and specific use cases when choosing.
Scalability & Performance at Scale
As your monitoring needs grow, the ability of your chosen tool to scale becomes crucial.
Kibana
- Scalability Model:
- Scales with Elasticsearch cluster
- Can handle large volumes of log data efficiently
- Performance Factors:
- Index size and shard configuration in Elasticsearch
- Complexity of queries and aggregations
- Number of concurrent users
- Best Practices:
- Use index lifecycle management for efficient data retention
- Implement cross-cluster search for distributed deployments
- Utilize index patterns and runtime fields for flexible data models
Grafana
- Scalability Model:
- Stateless architecture allows for horizontal scaling
- Performance depends largely on the underlying data sources
- Performance Factors:
- Number and complexity of dashboards
- Query efficiency of connected data sources
- Frequency of data updates
- Best Practices:
- Use caching mechanisms for frequently accessed dashboards
- Implement federated architectures for large-scale deployments
- Optimize queries and use pre-aggregation where possible
Scalability Comparison:
| Aspect | Kibana | Grafana |
|---|---|---|
| Data Volume Handling | Excellent for logs | Depends on data source |
| User Concurrency | Good | Excellent |
| Distributed Deployment | Through Elasticsearch | Native support |
| Query Performance | Can slow with complex aggregations | Varies by data source |
Scaling Example: Monitoring a large e-commerce platform
- Kibana approach:
- Deploy Elasticsearch cluster with hot-warm-cold architecture
- Use index lifecycle management for efficient data retention
- Implement cross-cluster search for geographically distributed logs
- Use Kibana spaces for different departments (e.g., operations, security)
- Grafana approach:
- Deploy Grafana in a horizontally scaled setup behind a load balancer
- Use Prometheus federation for metrics collection across regions
- Implement Grafana Enterprise for advanced authentication and caching
- Utilize Grafana's folder-based permissions for departmental access control
Key Consideration: For log-heavy workloads, Kibana's tight integration with Elasticsearch can offer better out-of-the-box performance. For diverse data sources and metrics-focused monitoring, Grafana's flexibility can be advantageous.
Community & Support
A strong community and reliable support can significantly impact the long-term success of your monitoring solution.
Kibana
- Community Size: Large, part of the broader Elastic community
- Community Resources:
- Elastic Forums
- GitHub repositories
- Elastic Stack Exchange
- Official Support:
- Elastic Support (paid)
- Comprehensive documentation
- Regular webinars and training sessions
- Release Cycle: Follows Elastic Stack release cycle (major releases every quarter)
Grafana
- Community Size: Very large, active open-source community
- Community Resources:
- Grafana Community Forums
- GitHub repositories (highly active)
- Grafana Slack channel
- Official Support:
- Grafana Enterprise support (paid)
- Extensive documentation
- Regular webinars and Grafana Labs training
- Release Cycle: More frequent releases, with major versions approximately every 6-8 weeks
Community Comparison:
| Aspect | Kibana | Grafana |
|---|---|---|
| Open Source Contributions | Good | Excellent |
| Third-party Plugins | Limited | Extensive |
| Community Events | Regular | Frequent (including GrafanaCon) |
| Documentation Quality | Excellent | Excellent |
Pro Tip: When evaluating community support, look beyond just the size. Consider the activity level on GitHub, the frequency of answered questions on forums, and the availability of third-party tutorials and courses.
Pricing & Deployment Options
Understanding the cost structure and deployment flexibility is crucial for long-term planning and budgeting.
Kibana
- Licensing Model:
- Open Source (Basic) - Limited features
- Elastic License - Full features, some usage restrictions
- Enterprise - Full features, no restrictions
- Deployment Options:
- Self-hosted (on-premises or cloud)
- Elastic Cloud (managed service)
- Pricing Factors:
- Data volume
- Number of nodes
- Required features (e.g., machine learning, security)
Grafana
- Licensing Model:
- Open Source - Core features
- Grafana Enterprise - Advanced features and support
- Grafana Cloud - Fully managed service
- Deployment Options:
- Self-hosted (on-premises or cloud)
- Grafana Cloud
- Pricing Factors:
- Number of active users
- Number of data sources
- Required features (e.g., alerting, reporting)
Pricing Comparison for a Mid-sized Deployment:
| Aspect | Kibana (Elastic Cloud) | Grafana Enterprise |
|---|---|---|
| Base Price | Starting at $95/month | Starting at $49/editor/month |
| Data Retention | Varies by tier | Depends on data source |
| User Limit | Unlimited | Priced per editor |
| Support | 24/7 for Enterprise tier | Business hour support included |
Key Consideration: While open-source versions are available for both, enterprise features and support can significantly impact pricing. Consider your long-term needs and growth projections when evaluating costs.
Security Features
As monitoring tools often handle sensitive data, robust security features are essential.
Kibana
- Authentication:
- Integration with Elastic Security
- Support for LDAP, Active Directory, SAML, and OpenID Connect
- Authorization:
- Role-based access control (RBAC)
- Field and document level security in Elasticsearch
- Data Protection:
- TLS encryption for data in transit
- Encryption at rest (with Elastic License)
- Auditing:
- Comprehensive audit logging (with Elastic License)
- Compliance: Assists in meeting various compliance standards (HIPAA, PCI DSS, etc.)
Grafana
- Authentication:
- Built-in user management
- Support for LDAP, OAuth, and SAML
- Authorization:
- Role-based access control (RBAC)
- Team-based permissions
- Data Protection:
- TLS encryption for data in transit
- Encryption at rest (Enterprise feature)
- Auditing:
- Audit logs for user actions (Enterprise feature)
- Compliance: Helps in achieving compliance with various standards
Security Feature Comparison:
| Feature | Kibana | Grafana |
|---|---|---|
| Single Sign-On | Yes | Yes |
| Fine-grained Access Control | Excellent | Good |
| Data Encryption | Yes | Yes (Enterprise) |
| Audit Logging | Yes (Licensed) | Yes (Enterprise) |
Security Implementation Example:
Kibana security configuration (in elasticsearch.yml):
xpack.security.enabled: true
xpack.security.authc:
  realms:
    ldap:
      ldap1:
        order: 0
        url: 'ldaps://ldap.example.com:636'
        bind_dn: 'cn=ldapuser,dc=example,dc=com'
        user_search:
          base_dn: 'dc=example,dc=com'
          filter: '(cn={0})'
Grafana LDAP configuration (in grafana.ini):
[auth.ldap]
enabled = true
config_file = /etc/grafana/ldap.toml

[server]
root_url = https://grafana.example.com
Pro Tip: Regularly audit your security configurations and keep both the core platform and any plugins up to date to maintain a strong security posture.
Best Use Cases
Understanding the strengths of each tool can help in choosing the right solution for specific scenarios.
Kibana
- Log Analysis and Management:
- Ideal for centralized logging solutions
- Powerful for full-text search and log correlation
- Example: Analyzing application logs for error patterns
- Security Information and Event Management (SIEM):
- Strong in security analytics and threat hunting
- Integrates well with Elastic Security
- Example: Monitoring network traffic for suspicious activities
- Application Performance Monitoring (APM):
- Good for tracing requests across microservices
- Integrates with Elastic APM
- Example: Tracking user transaction times in a web application
- Business Intelligence on Log Data:
- Useful for extracting insights from unstructured data
- Powerful aggregations and visualizations
- Example: Analyzing customer behavior from e-commerce logs
Grafana
- Multi-source Data Visualization:
- Excellent for creating unified dashboards from diverse data sources
- Supports a wide range of data types and formats
- Example: Creating a single view of metrics from Prometheus, logs from Loki, and traces from Jaeger
- IoT and Sensor Data Monitoring:
- Great for real-time data visualization
- Supports high-frequency data updates
- Example: Monitoring temperature sensors in a large facility
- Cloud Infrastructure Monitoring:
- Strong integrations with major cloud providers
- Flexible for hybrid and multi-cloud environments
- Example: Monitoring AWS, Azure, and on-premises resources in a single dashboard
- DevOps and CI/CD Metrics:
- Good for visualizing software development and deployment metrics
- Integrates well with various CI/CD tools
- Example: Tracking build times, deployment frequencies, and error rates
Use Case Comparison:
| Scenario | Kibana | Grafana |
|---|---|---|
| Log Analysis | Excellent | Good |
| Metrics Visualization | Good | Excellent |
| Security Monitoring | Excellent | Good |
| Multi-data Source Dashboards | Limited | Excellent |
| Real-time Data Streaming | Good | Excellent |
Pro Tip: Consider using both tools in complementary roles. For example, use Kibana for deep log analysis and Grafana for unified metric visualization across multiple systems.
Uptrace: A Modern Alternative
While Kibana and Grafana are established players, newer tools like Uptrace offer innovative approaches to observability.
Key Features of Uptrace
- OpenTelemetry Native:
- Built from the ground up to support OpenTelemetry
- Simplifies instrumentation and data collection
- Unified Observability:
- Combines metrics, traces, and logs in a single platform
- Provides context-rich insights
- ClickHouse Backend:
- Leverages ClickHouse for high-performance analytics
- Enables fast querying of large datasets
- User-Friendly Interface:
- Intuitive dashboards and exploration tools
- Low learning curve for new users
- Cost-Effective:
- Open-source core with transparent pricing for enterprise features
- Can be more economical for certain use cases
Comparison with Kibana and Grafana:
| Feature | Uptrace | Kibana | Grafana |
|---|---|---|---|
| OpenTelemetry Support | Native | Limited | Good (via plugins) |
| Unified Observability | Excellent | Good | Good |
| Query Performance | Excellent | Good | Varies by data source |
| Ease of Setup | Very Easy | Moderate | Moderate |
| Customization | Good | Excellent | Excellent |
Key Consideration: If you're starting a new observability project or looking to consolidate tools, Uptrace's modern architecture and focus on OpenTelemetry make it a compelling option to evaluate alongside Kibana and Grafana.
Conclusion
Choosing between Kibana, Grafana, or an alternative like Uptrace depends on various factors:
- Data Sources: If you're primarily working with Elasticsearch data, Kibana offers the most native experience. For diverse data sources, Grafana's flexibility is unmatched. Uptrace shines in OpenTelemetry-based environments.
- Use Case: Kibana excels in log analysis and security monitoring. Grafana is superior for metric visualization and multi-source dashboards. Uptrace offers a unified approach to observability.
- Scalability: All tools can scale, but their performance characteristics differ. Kibana scales well with Elasticsearch, Grafana's performance depends on data sources, and Uptrace leverages ClickHouse for high-performance analytics.
- Community and Ecosystem: Kibana and Grafana have large, established communities. Uptrace, being newer, has a growing community focused on modern observability practices.
- Cost and Licensing: Consider both immediate and long-term costs, including potential savings in training and integration for tools that align closely with your stack.
Ultimately, the best choice depends on your specific requirements, existing infrastructure, and future growth plans. Many organizations find value in using multiple tools for different aspects of their observability strategy.
We recommend:
- Clearly define your observability requirements and use cases.
- Evaluate each tool with a proof of concept in your environment.
- Consider the total cost of ownership, including training and integration efforts.
- Assess the alignment with your future technology roadmap, especially concerning trends like OpenTelemetry adoption.
Remember, observability is an ongoing journey. The tool you choose should not only meet your current needs but also adapt to your evolving requirements in the dynamic world of modern infrastructure and application development. Anyway you can combile this tools. Using Uptrace with Grafana could help in complex monitoring scenarios, offering the best from both tools. By combining Uptrace's strengths in distributed tracing and OpenTelemetry with Grafana's visualization prowess, organizations can create a more comprehensive and flexible observability solution tailored to their specific needs.
FAQ
- Which is better for log analysis, Kibana or Grafana? Kibana is generally considered superior for log analysis due to its tight integration with Elasticsearch and powerful full-text search capabilities. However, Grafana can also handle log data effectively, especially when combined with log-centric data sources.
- Can Grafana work with Elasticsearch data? Yes, Grafana can connect to Elasticsearch as a data source. While it may not have the same level of native integration as Kibana, it can effectively visualize and query Elasticsearch data.
- Is Kibana only for Elasticsearch, or can it work with other data sources? Kibana is primarily designed for Elasticsearch, but recent versions have introduced limited support for additional data sources through Elastic's integrations. However, its capabilities with non-Elasticsearch data are not as extensive as Grafana's.
- How do the machine learning capabilities of Kibana and Grafana compare? Kibana, through X-Pack features, offers more robust out-of-the-box machine learning capabilities, including anomaly detection and forecasting. Grafana's machine learning features are generally available through plugins or integrations with external ML services.
- Which tool is more suitable for real-time monitoring of high-cardinality data? Grafana generally performs better with high-cardinality data, especially when paired with time-series databases like Prometheus. However, the performance can also depend on the underlying data source and query optimization.
You may also be interested in: