12 OpenTelemetry-Compatible Platforms You Should Know in 2025
Why OpenTelemetry Matters in 2025
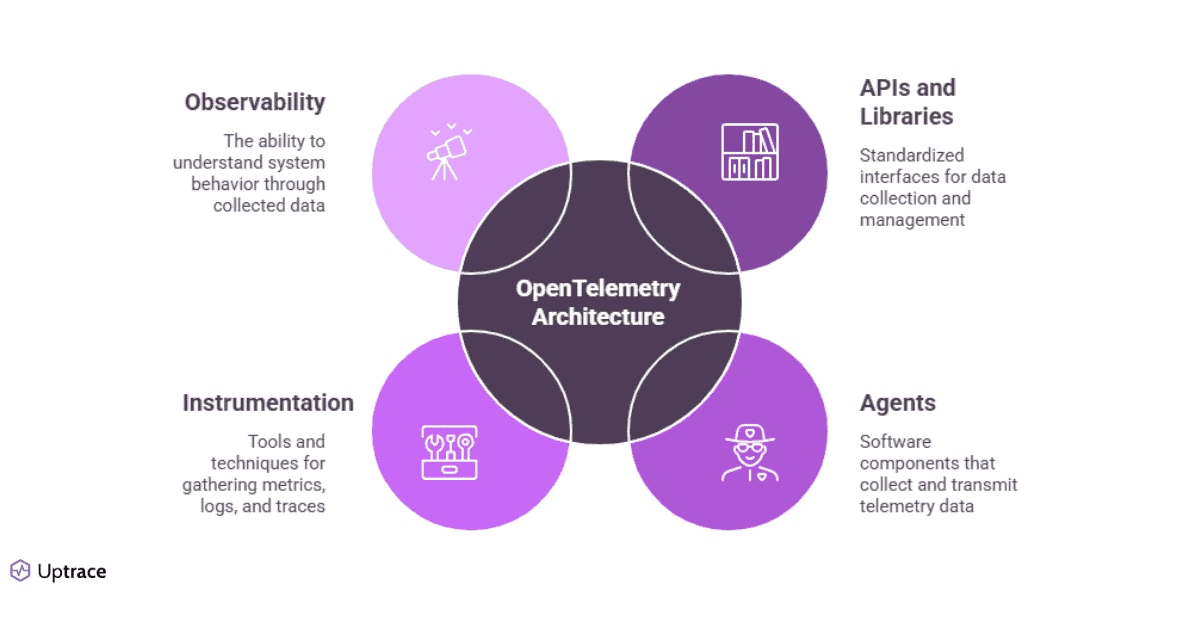
OpenTelemetry has transformed how engineering teams implement observability. This vendor-neutral framework for collecting metrics, traces, and logs has become indispensable for several reasons:
Elimination of vendor lock-in
Organizations can switch observability providers without changing instrumentation code, enabling greater flexibility and negotiating power with vendors.
Reduced agent sprawl
A single OpenTelemetry Collector replaces multiple proprietary agents, simplifying deployment and reducing resource consumption across your infrastructure.
Future-proof architecture
As standards evolve, implementations simply update without requiring changes to your instrumentation, protecting your observability investment.
Community-driven innovation
The vibrant ecosystem around OpenTelemetry continuously improves capabilities, with contributions from organizations of all sizes advancing the standard rapidly.
The OpenTelemetry Collector serves as the backbone of this ecosystem, providing a unified gateway for processing and routing telemetry data to your backend of choice.
Top OpenTelemetry-Compatible Platforms
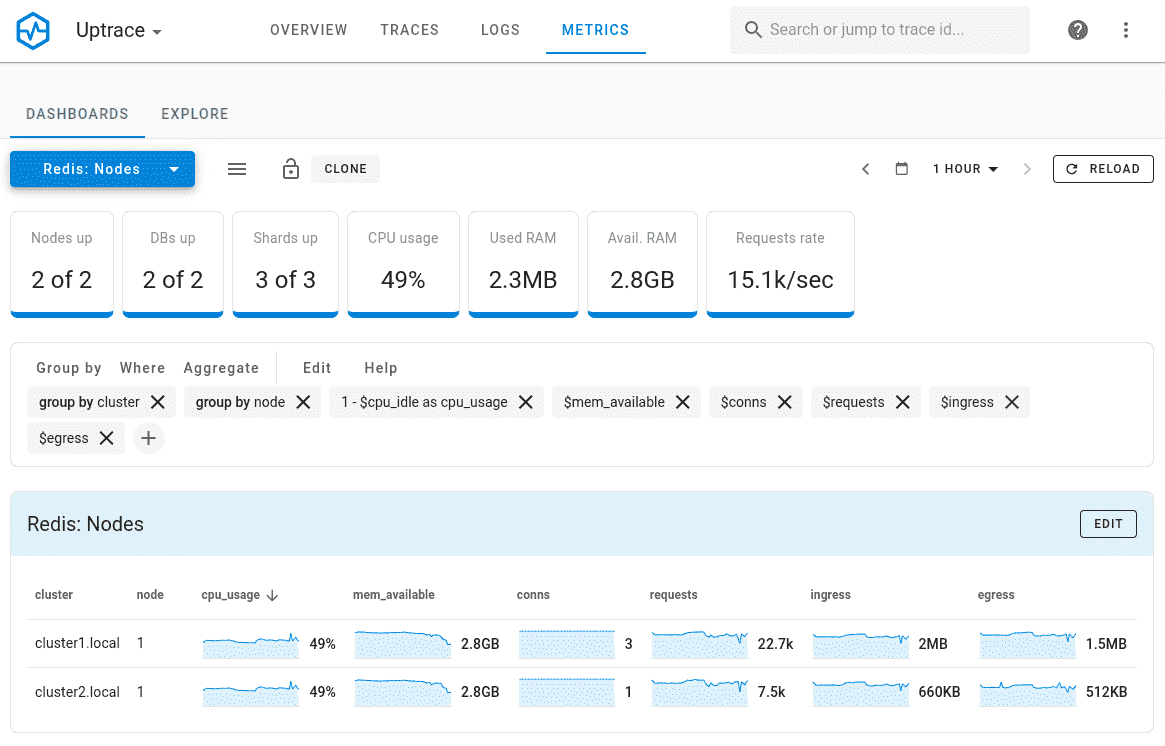
Uptrace
Uptrace is an OpenTelemetry-native APM built from the ground up to leverage the full potential of the OpenTelemetry ecosystem. Unlike platforms that merely support OpenTelemetry as an add-on, Uptrace treats it as a first-class citizen, providing seamless integration with the OpenTelemetry protocol and data model.
Capabilities:
- SQL backend delivers both query performance and flexibility
- Distributed tracing with detailed span analysis
- Real-time error monitoring and alerting
- Intuitive query builder designed specifically for OpenTelemetry data
- Single unified UI for metrics, traces, and logs
Potential Drawbacks:
- Newer entrant compared to some established vendors
- Community size still growing
Key Takeaways
✓ Uptrace represents the future of OpenTelemetry-native platforms, built specifically for the standard.
✓ SQL-powered backend provides exceptional performance for complex queries across high-cardinality data.
✓ Unified experience across metrics, traces, and logs simplifies correlation and troubleshooting.
✓ Purpose-built instrumentation libraries enhance the core OpenTelemetry experience.
✓ Ideal for organizations committed to OpenTelemetry as their observability standard.
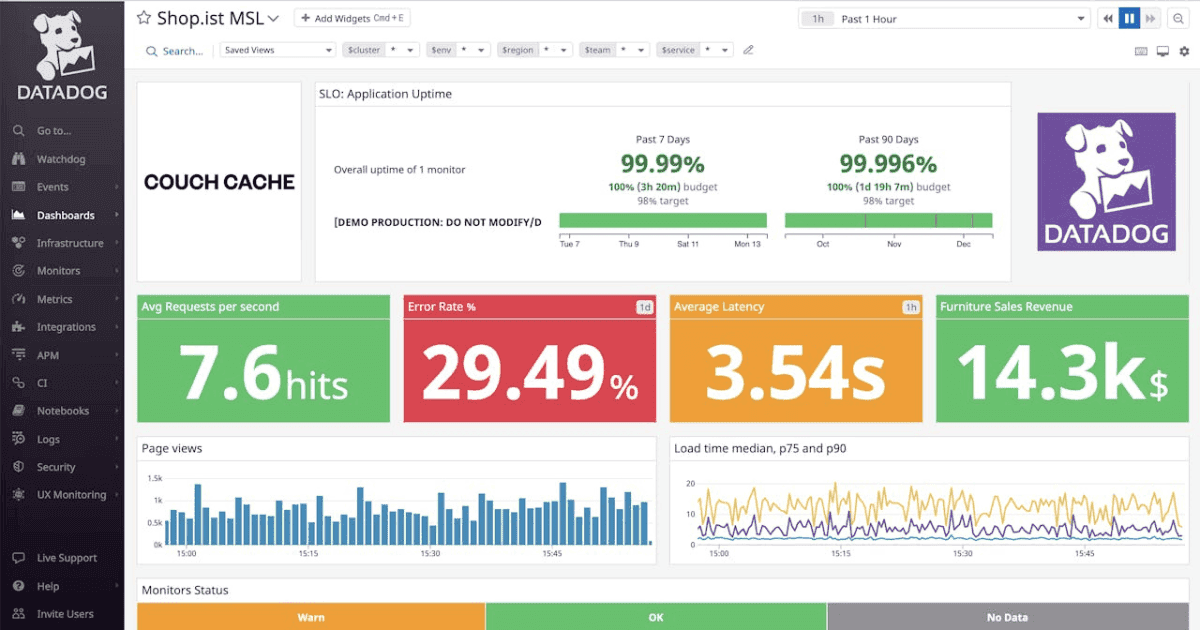
Datadog
Datadog has embraced OpenTelemetry by offering comprehensive integration options for organizations transitioning to this open standard. Their OpenTelemetry support extends across their full-stack observability platform, allowing teams to leverage existing Datadog visualizations and analytics with OpenTelemetry-collected data.
Capabilities:
- Mature dashboarding and visualization capabilities
- Strong cross-correlation between metrics, traces, and logs
- Extensive integration ecosystem for broad visibility
- Pre-built monitors and alerts for common scenarios
- Datadog OpenTelemetry integration works with minimal configuration
Potential Drawbacks:
- Can become expensive at scale
- Some advanced features still optimized for proprietary agents
Key Takeaways
✓ Datadog offers enterprise-grade stability with growing OpenTelemetry support.
✓ Extensive integration ecosystem connects OpenTelemetry data with other operational tools.
✓ Provides a gradual migration path from proprietary agents to OpenTelemetry.
✓ Advanced visualization capabilities enhance the value of OpenTelemetry-collected data.
✓ Best suited for enterprises already invested in the Datadog ecosystem.
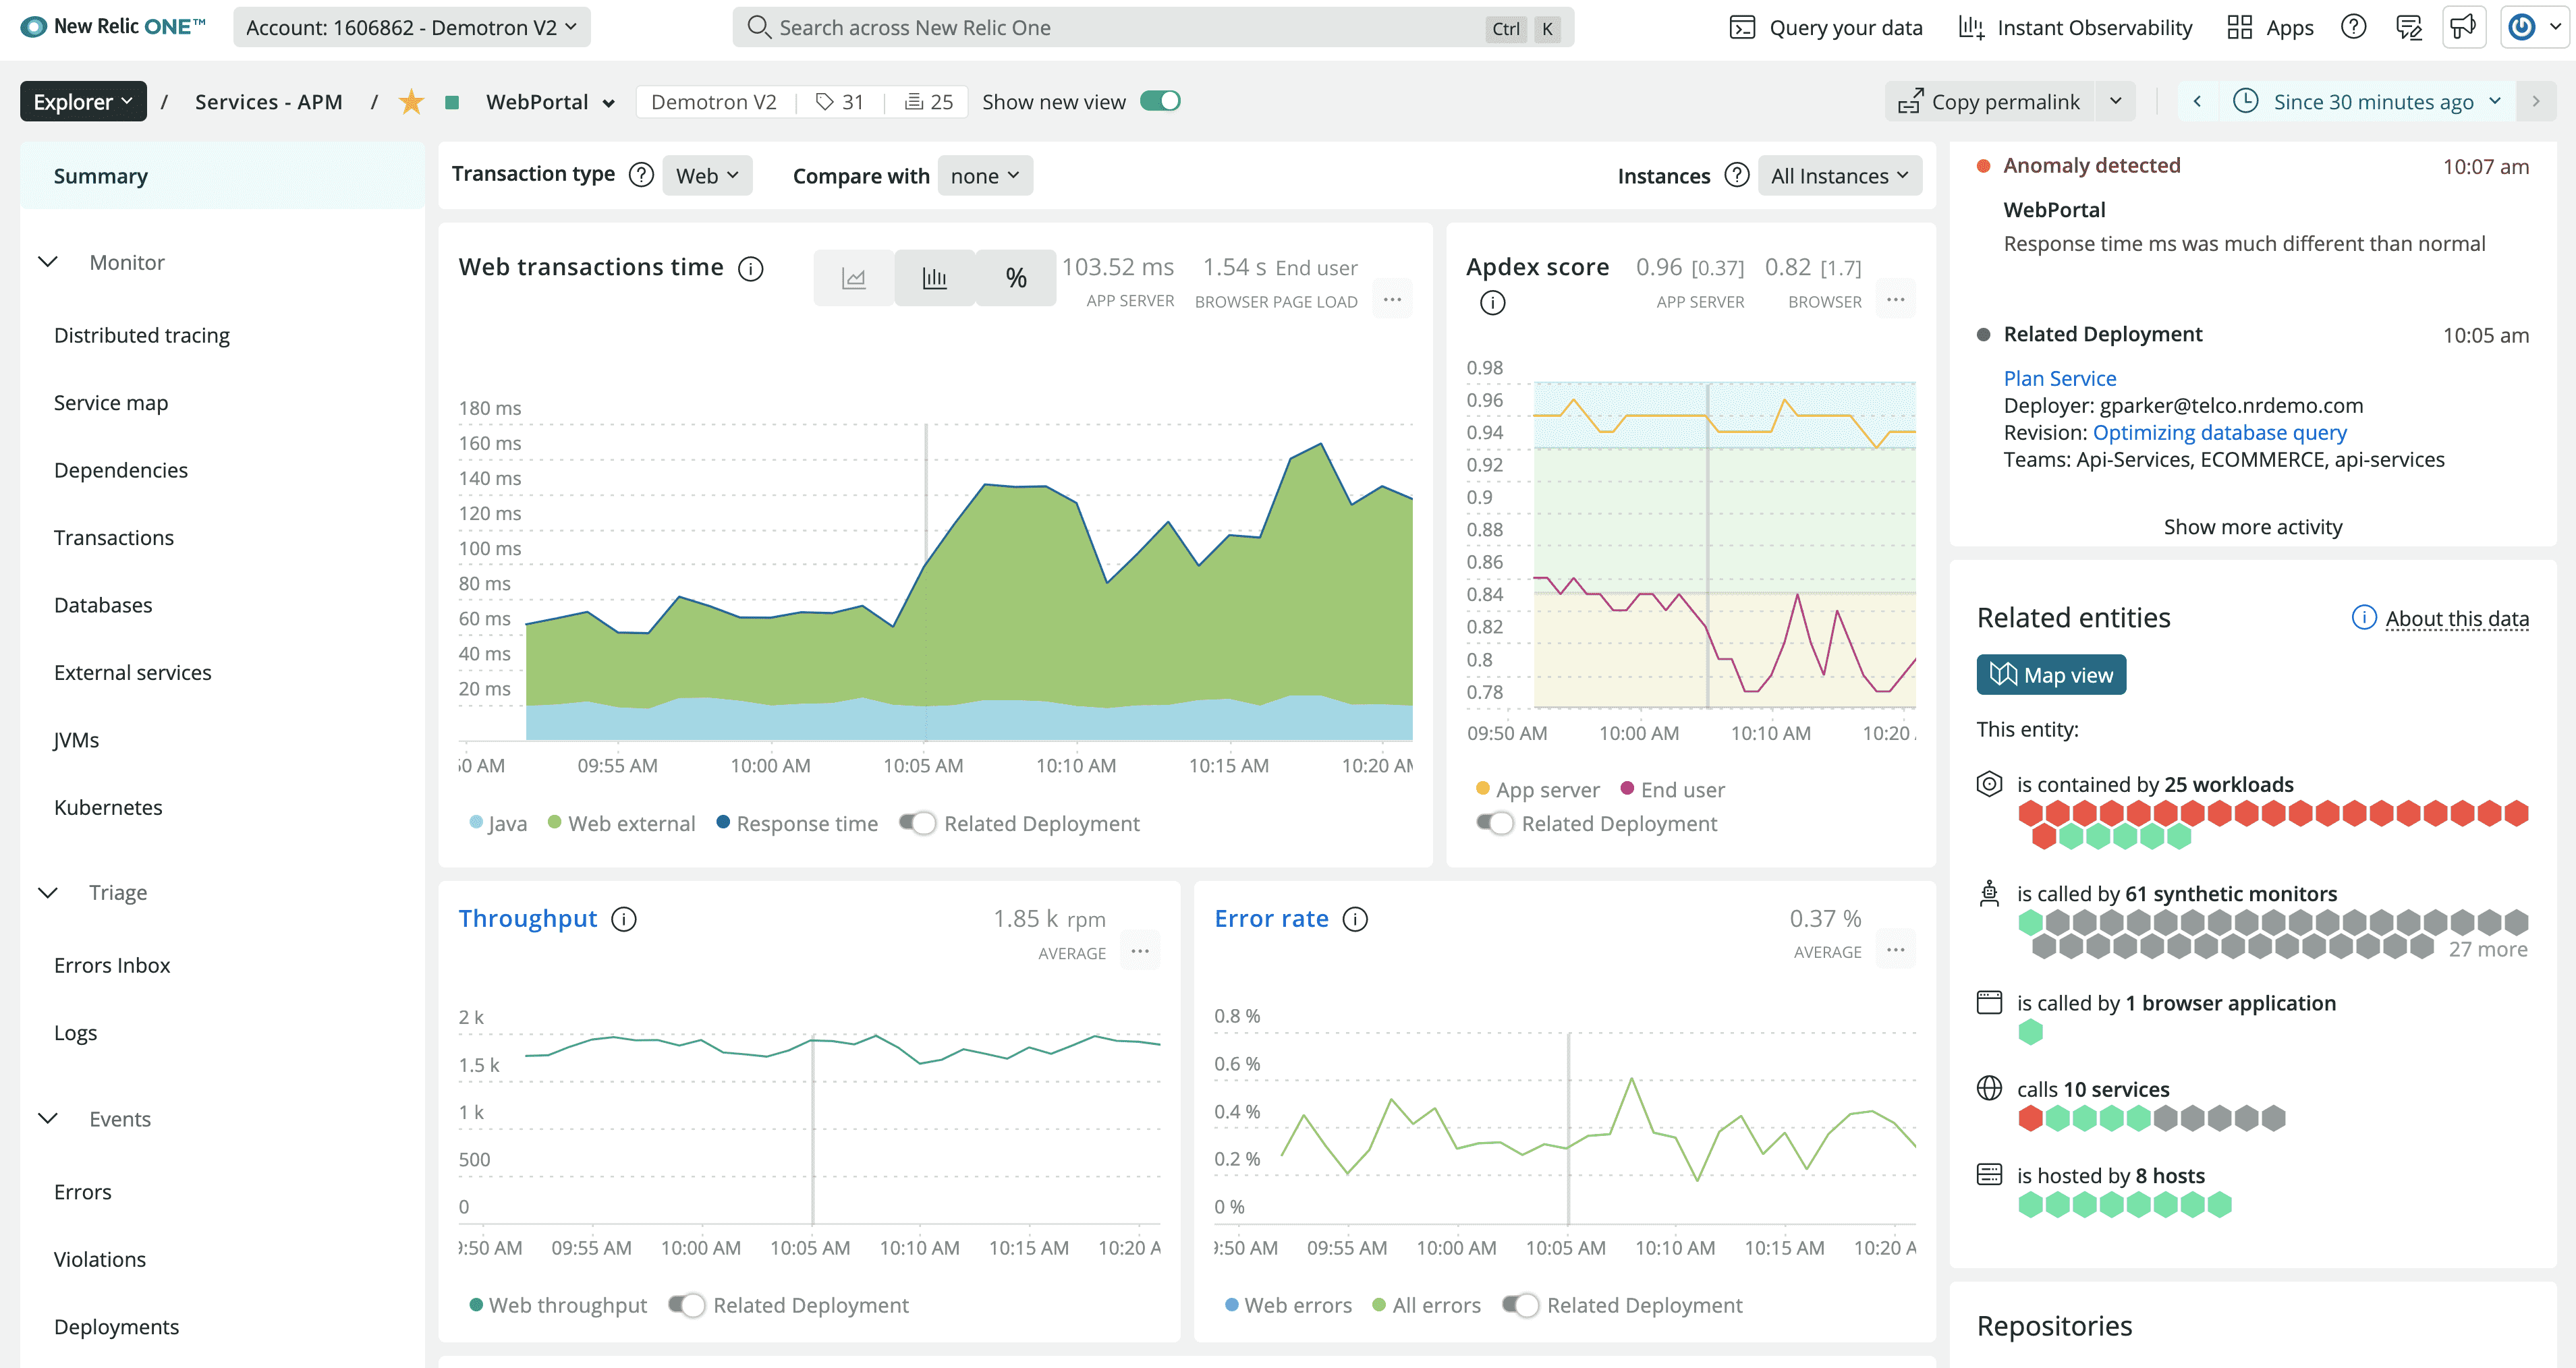
New Relic
New Relic has deeply integrated OpenTelemetry capabilities across their platform, allowing teams to unify telemetry data regardless of its source. Their commitment to OpenTelemetry includes native support for the protocol and significant contributions to the open source project.
Capabilities:
- Unified platform approach simplifies data correlation
- Powerful query language (NRQL) works seamlessly with OpenTelemetry data
- Comprehensive APM capabilities enhance trace context
- Cost-effective pricing for OpenTelemetry data ingestion
- AI-assisted troubleshooting and anomaly detection
Potential Drawbacks:
- Learning curve for the NRQL query language
- UI can feel overwhelming for new users
Key Takeaways
✓ New Relic provides comprehensive OpenTelemetry integration throughout their observability platform.
✓ NRQL query language enables powerful analysis of OpenTelemetry-collected telemetry.
✓ User-based pricing model can reduce costs for teams standardizing on OpenTelemetry.
✓ AI capabilities automatically detect anomalies in OpenTelemetry metrics and traces.
✓ Strong for organizations seeking to consolidate multiple monitoring tools into a unified platform.
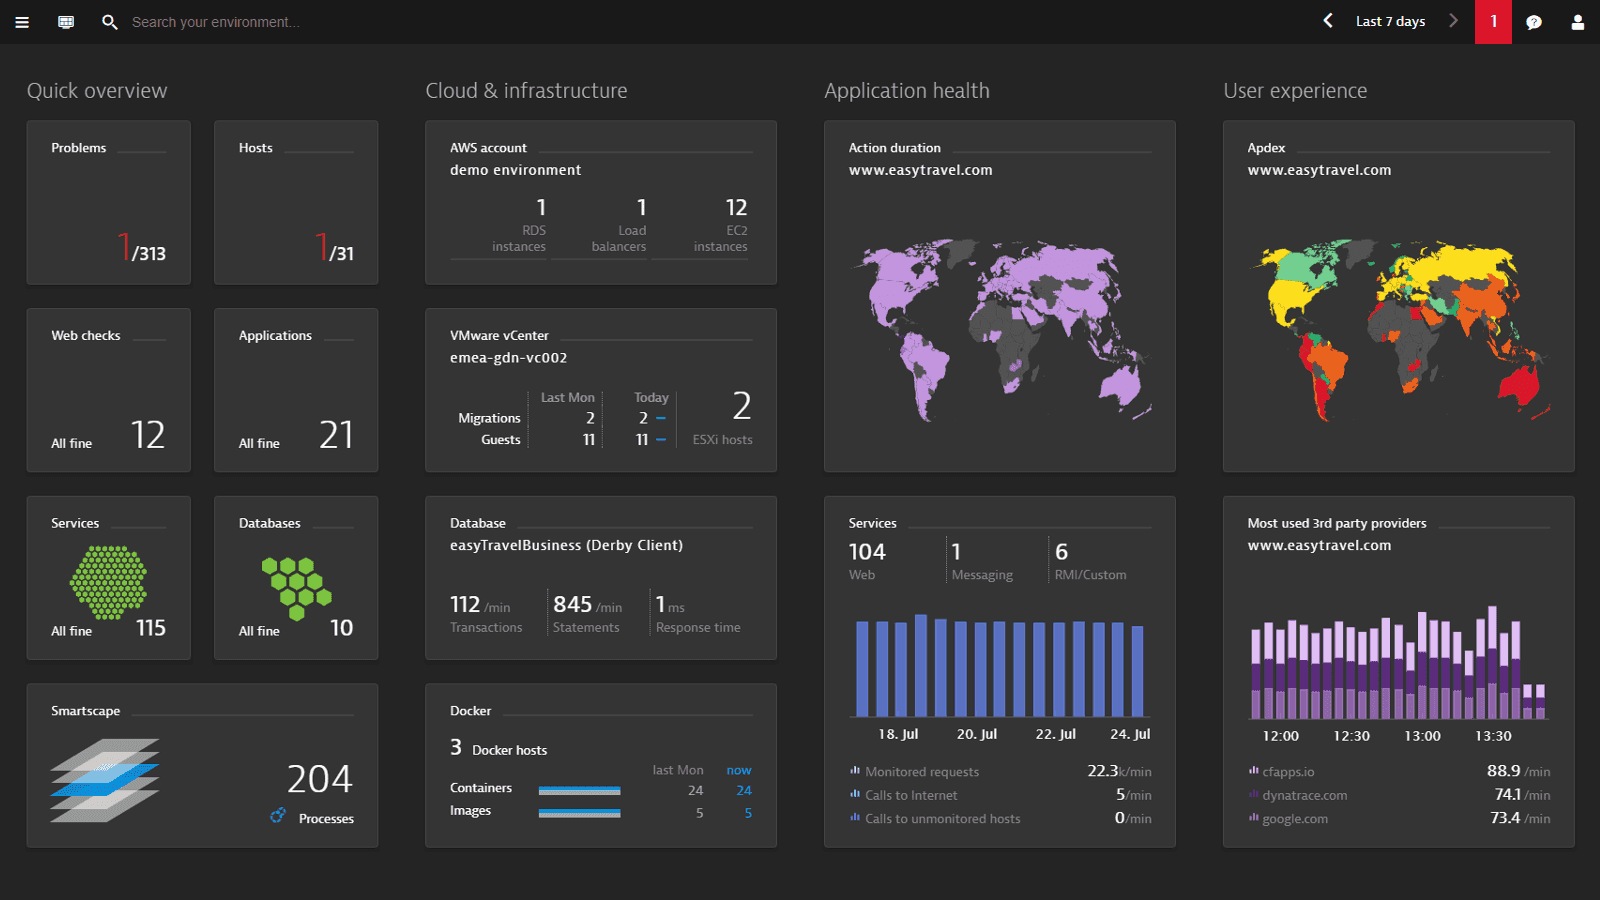
Dynatrace
Dynatrace has evolved its observability platform to fully support OpenTelemetry, allowing their Davis AI engine to analyze and derive insights from OpenTelemetry-collected data. Their approach focuses on automatic discovery and intelligent analysis.
Capabilities:
- Davis AI provides automated root cause analysis for OpenTelemetry data
- Topology mapping works with OpenTelemetry-instrumented services
- Auto-discovery capabilities reduce manual configuration
- Enterprise-grade security and compliance features
- Dynatrace OpenTelemetry integration supports seamless data enrichment
Potential Drawbacks:
- Higher price point than many competitors
- Some features still work best with Dynatrace OneAgent
Key Takeaways
✓ Dynatrace leverages AI to extract maximum insight from OpenTelemetry data.
✓ Automatic service discovery and topology mapping enhance context for OpenTelemetry traces.
✓ Davis AI determines root cause across complex service dependencies.
✓ Enterprise security and compliance features make it suitable for regulated industries.
✓ Best for large organizations with complex environments requiring automated analysis.
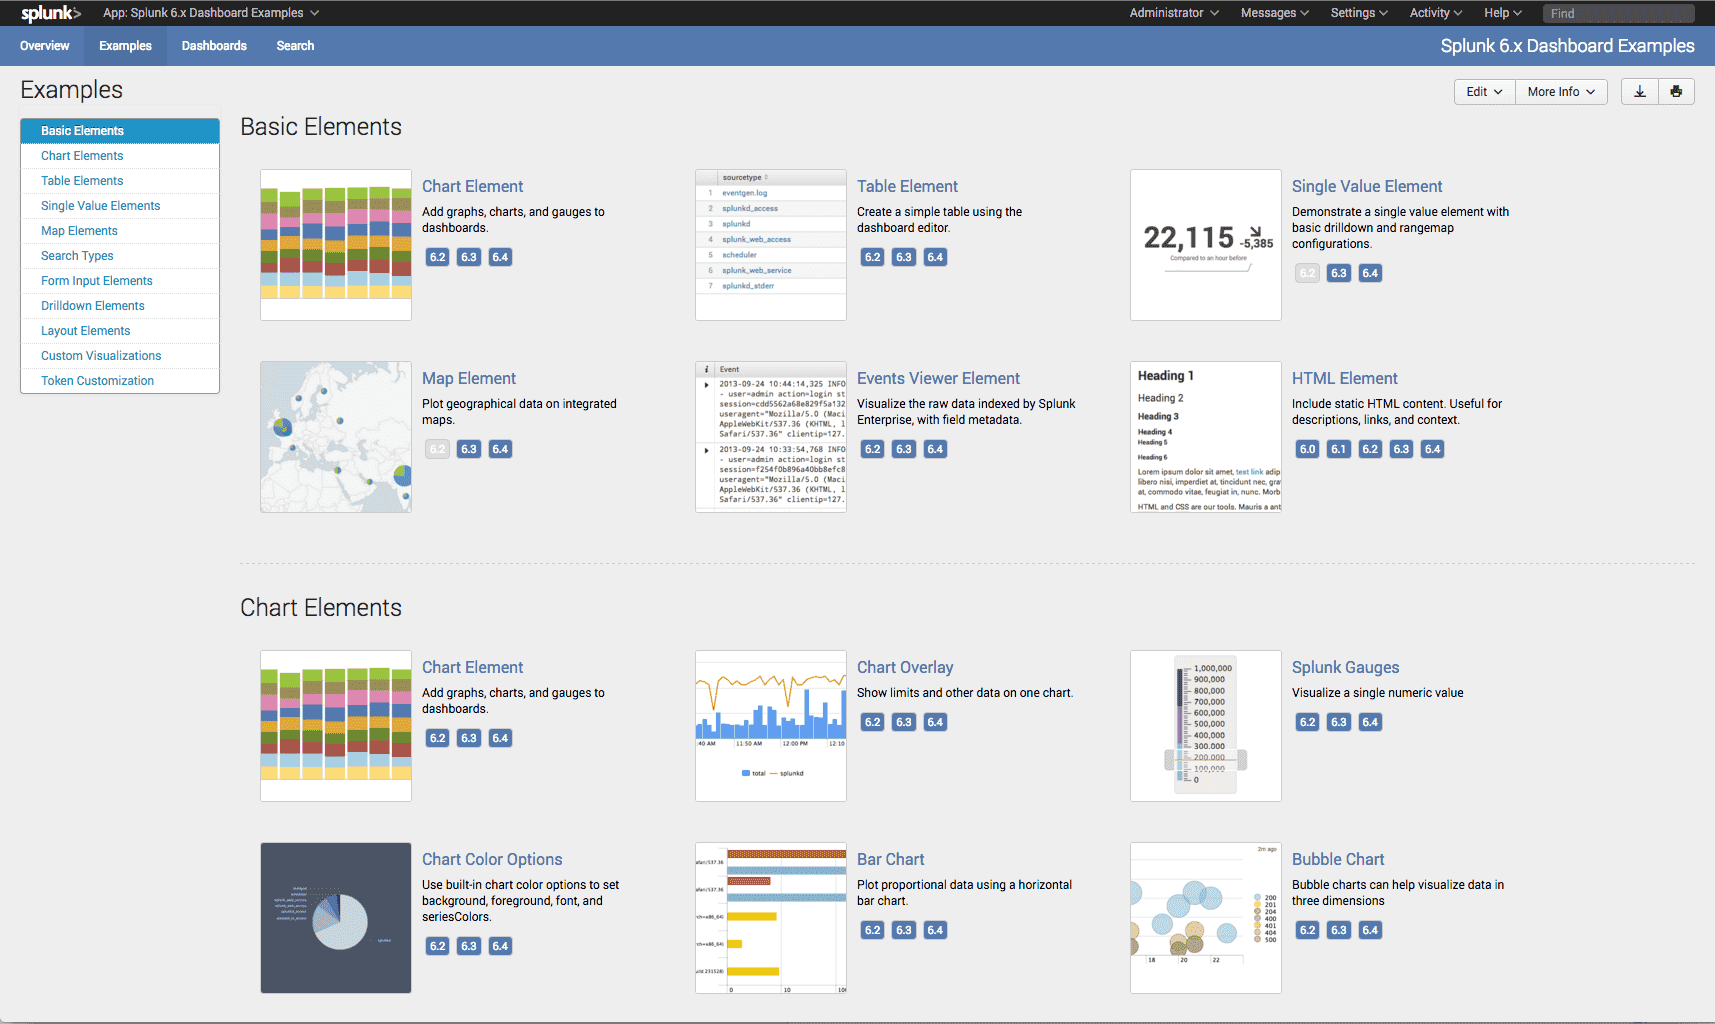
Splunk Observability Cloud
Splunk has embraced OpenTelemetry as a core input for their Observability Cloud, leveraging their big data expertise to provide powerful analysis capabilities for OpenTelemetry-collected telemetry.
Capabilities:
- Powerful search capabilities across all telemetry types
- Advanced analytics and machine learning features
- Strong security integration with Splunk security offerings
- Custom OpenTelemetry Collector configurations supported
- Splunk OpenTelemetry support includes custom processors and exporters
Potential Drawbacks:
- Complex pricing model
- Can require significant resources to run effectively
Key Takeaways
✓ Splunk excels at search-based analysis of OpenTelemetry data at massive scale.
✓ Custom OpenTelemetry Collector configurations extend data collection capabilities.
✓ Integration with Splunk security products creates a unified security and observability platform.
✓ Advanced analytics can detect patterns across millions of traces and metrics.
✓ Particularly valuable for enterprises already invested in the Splunk ecosystem.
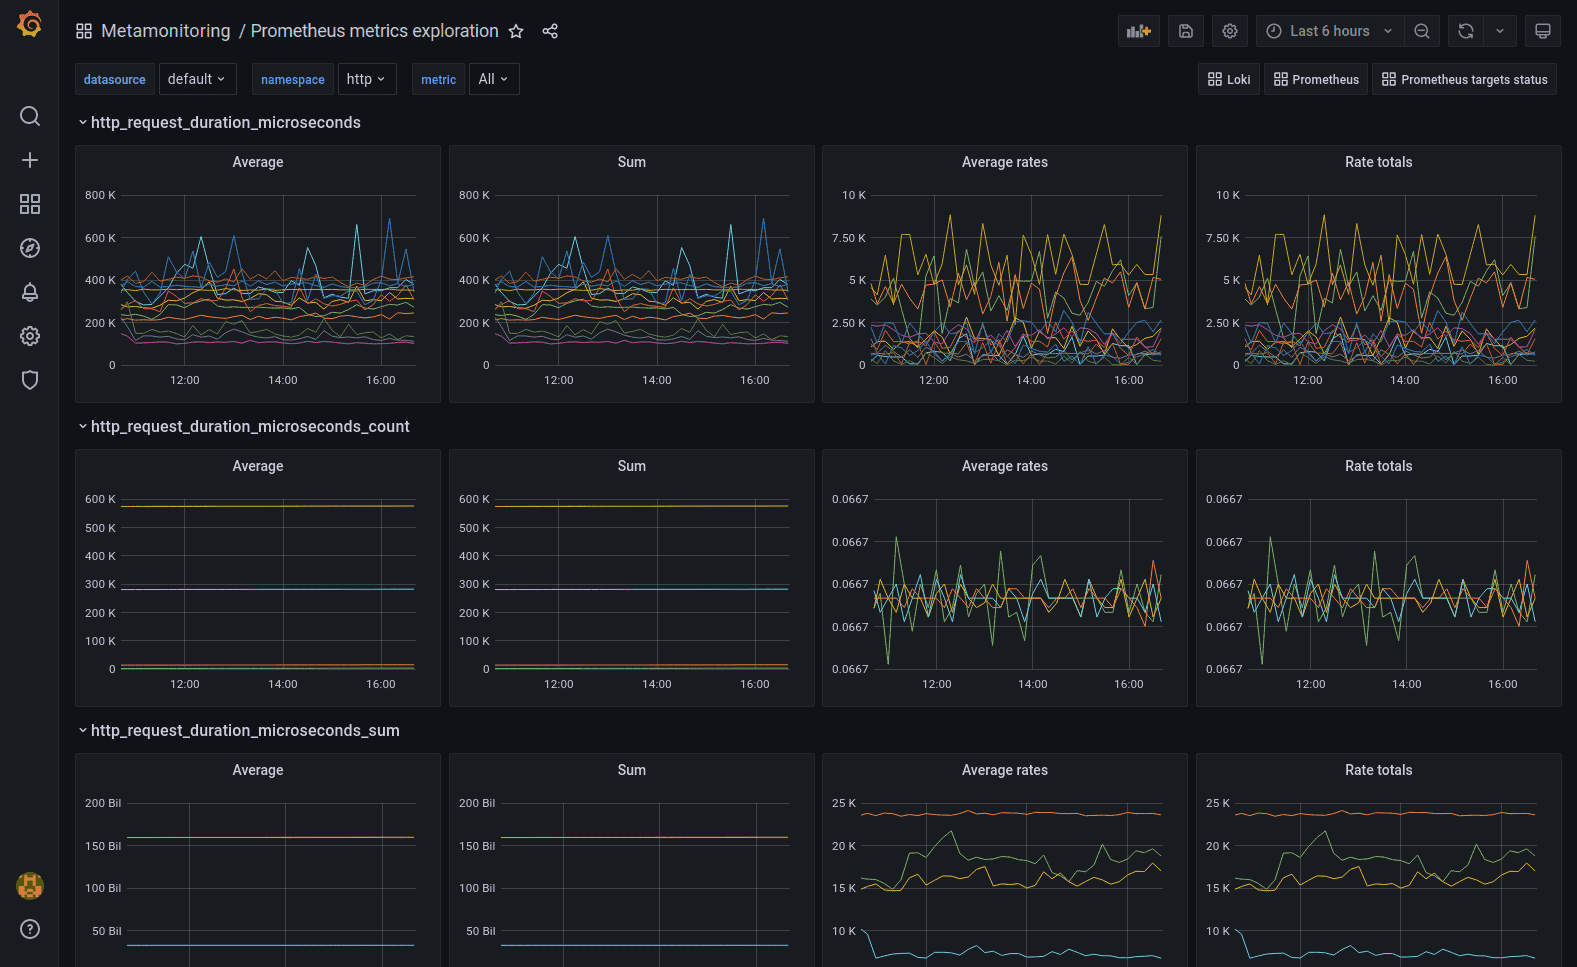
Grafana Cloud
Grafana Labs has built their observability platform around open standards, making them a natural fit for OpenTelemetry. Their Grafana OpenTelemetry integration spans their Tempo (traces), Mimir (metrics), and Loki (logs) backends.
Capabilities:
- Industry-leading visualization capabilities
- Tempo provides native OpenTelemetry trace storage
- Open source core with commercial support options
- Extensive plugin ecosystem
- Excellent multi-source data correlation
Potential Drawbacks:
- Requires some setup expertise
- Managed service still maturing
Key Takeaways
✓ Grafana Cloud provides best-in-class visualization for OpenTelemetry data.
✓ Tempo offers purpose-built storage optimized for OpenTelemetry traces.
✓ Open source foundation aligns with OpenTelemetry's community-driven approach.
✓ Multi-source dashboards enable correlation between various telemetry types.
✓ Excellent choice for teams that prioritize customizable visualizations and open standards.
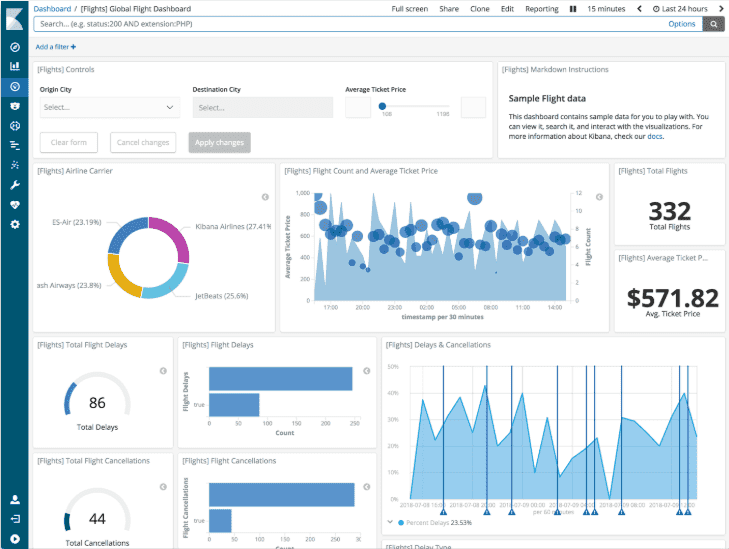
Elastic Observability
Elastic has integrated OpenTelemetry across their observability stack, allowing users to leverage their powerful search capabilities with OpenTelemetry-collected data.
Capabilities:
- Full-text search across all telemetry types
- Kibana provides flexible visualization options
- Self-hosted or cloud deployment options
- Machine learning features for anomaly detection
- Seamless integration with Elastic Security
Potential Drawbacks:
- Complex configuration for optimal performance
- Resource-intensive at scale
Key Takeaways
✓ Elastic Observability leverages full-text search for OpenTelemetry analysis.
✓ Flexible deployment options include self-hosted, cloud, and hybrid configurations.
✓ Machine learning capabilities automatically identify anomalies in OpenTelemetry metrics.
✓ Integration with Elastic Security creates unified observability and security workflows.
✓ Ideal for organizations already using the ELK stack for other use cases.
Lightstep
Lightstep was created by several of the founders of OpenTelemetry, giving them unique insight into the standard's capabilities and direction. Now part of ServiceNow, their platform offers specialized capabilities for understanding system behavior through OpenTelemetry data.
Capabilities:
- Advanced correlation between metrics and traces
- Change Intelligence features identify regression causes
- Exceptional trace analysis capabilities
- Deep integration with ServiceNow workflows
- Pioneering work on OpenTelemetry best practices
Potential Drawbacks:
- More specialized than some general-purpose platforms
- ServiceNow acquisition has changed some aspects of the platform
Key Takeaways
✓ Lightstep was created by OpenTelemetry founders with deep understanding of the standard.
✓ Provides industry-leading correlation capabilities between metrics and traces.
✓ Change Intelligence identifies service degradation causes automatically.
✓ ServiceNow integration creates powerful workflow automation possibilities.
✓ Particularly strong for organizations focusing on service reliability and performance.
Jaeger
Jaeger, a CNCF graduated project, has evolved from its origins as a distributed tracing system to embrace OpenTelemetry fully. The OpenTelemetry Jaeger integration is one of the most mature in the ecosystem. For a comprehensive comparison of Jaeger with other distributed tracing tools, see our detailed guide. This article can help understand it more deeply.
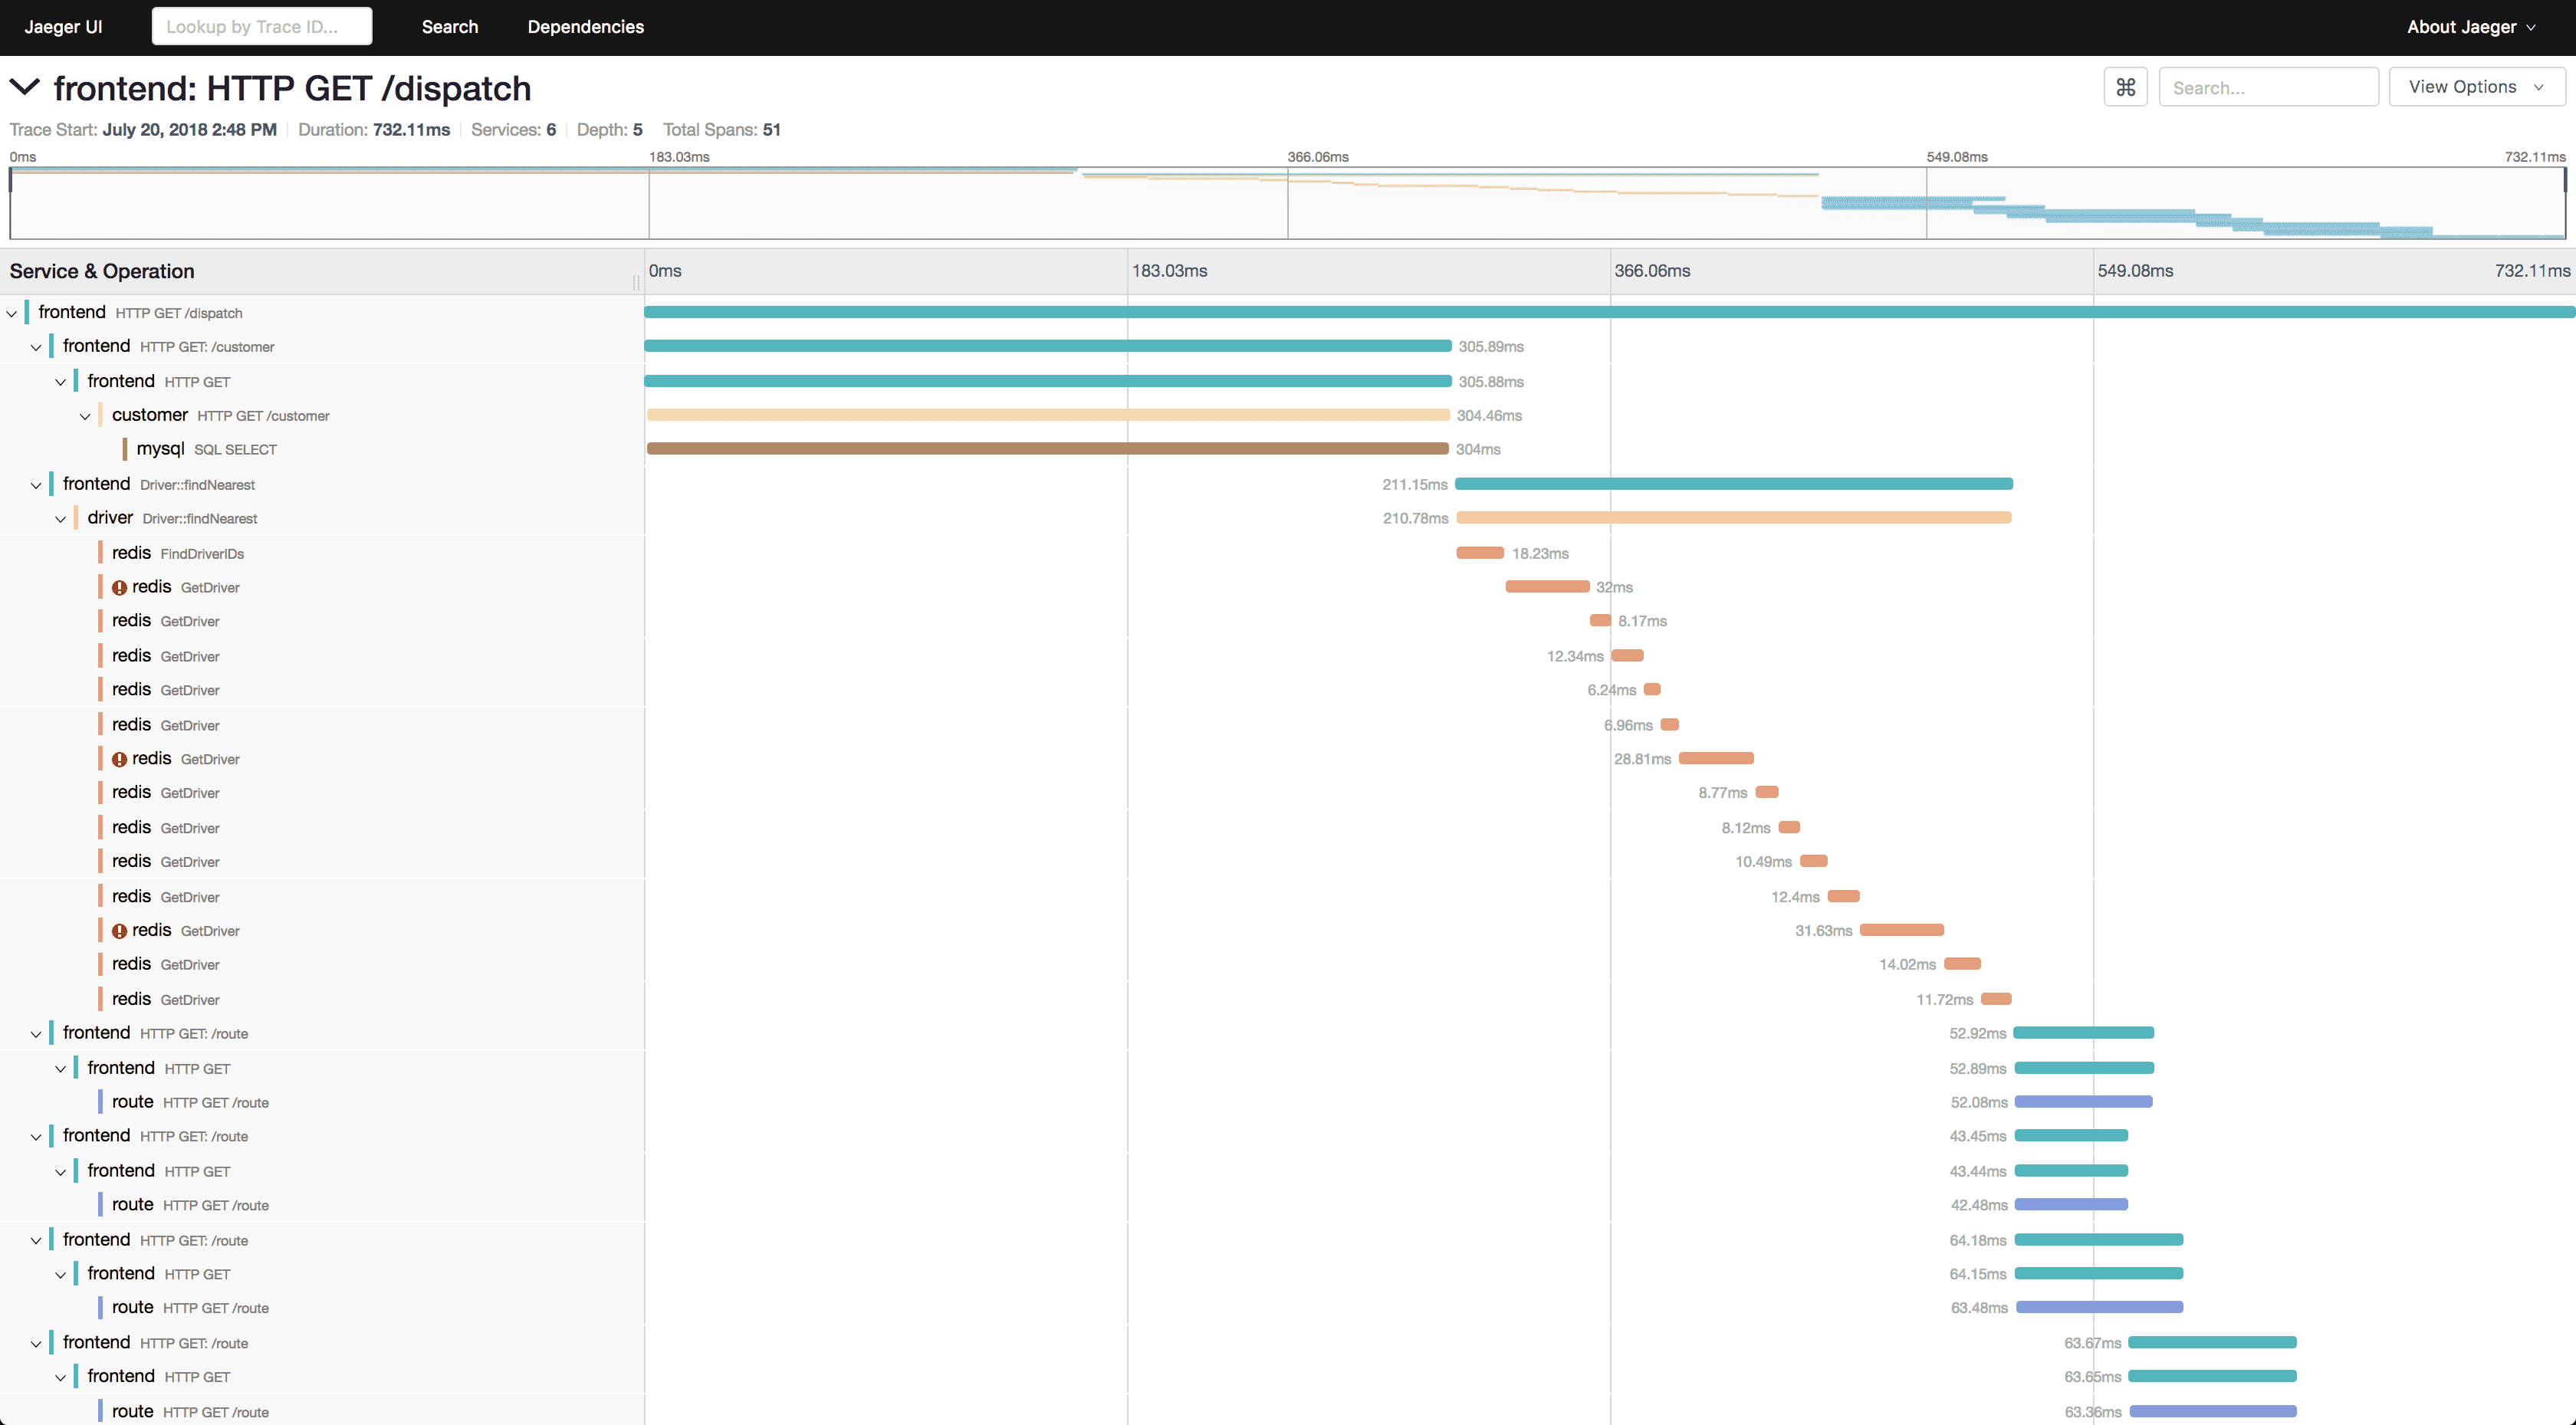
Capabilities:
- Purpose-built for distributed tracing
- Multiple storage backend options (Elasticsearch, Cassandra)
- Active open source community
- Zero vendor lock-in
- Native OpenTelemetry protocol support
Potential Drawbacks:
- Focused primarily on tracing rather than full observability
- Requires more manual setup than commercial alternatives
Key Takeaways
✓ Jaeger provides a mature, open-source solution for OpenTelemetry trace analysis.
✓ CNCF graduated project status ensures continued community development.
✓ Multiple storage backends offer flexibility for different deployment scenarios.
✓ OpenTelemetry protocol support ensures future compatibility.
✓ Best choice for organizations prioritizing open source solutions for distributed tracing.
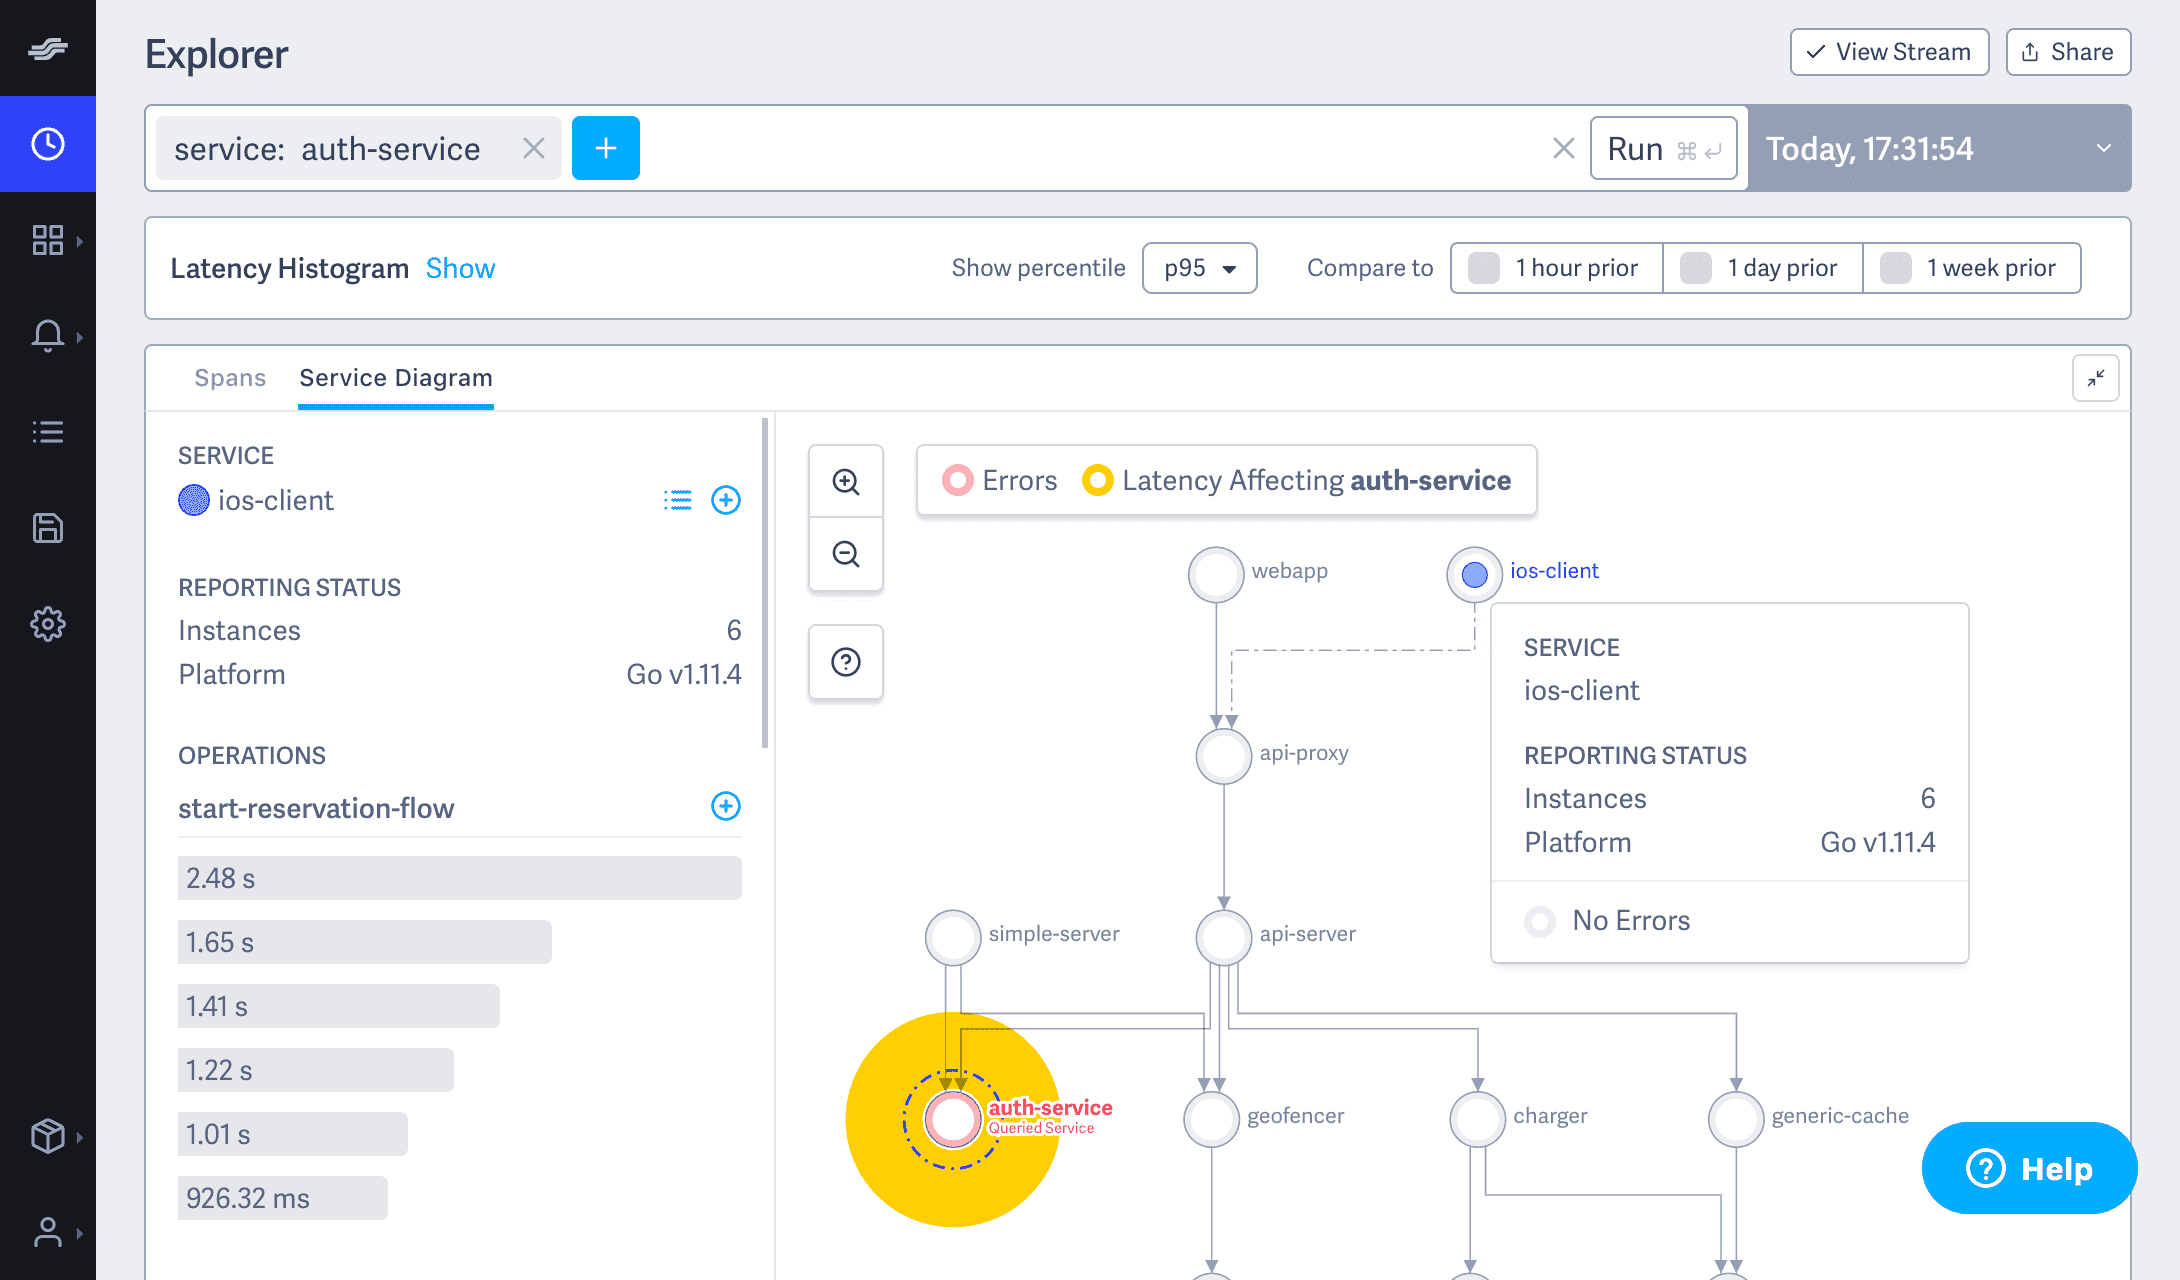
Honeycomb
Honeycomb has built their observability platform around handling high-cardinality data efficiently, making them an excellent match for the rich context provided by OpenTelemetry instrumentation.
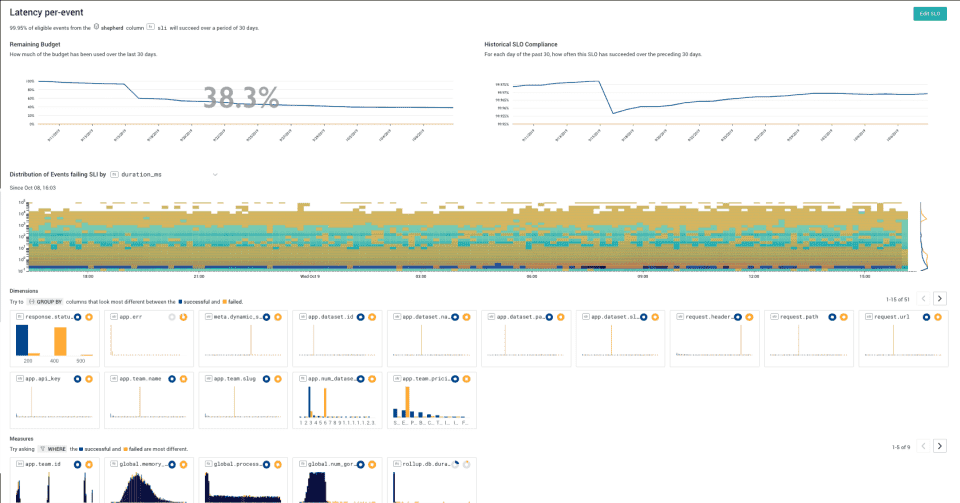
Capabilities:
- BubbleUp feature quickly identifies outlier patterns
- Designed for high-cardinality, high-dimensionality data
- Query builder specifically optimized for debugging workflows
- Strong SLO tracking capabilities
- Team-oriented collaboration features
Potential Drawbacks:
- Learning curve for new observability concepts
- Premium pricing for advanced features
Key Takeaways
✓ Honeycomb excels at high-cardinality analysis of OpenTelemetry telemetry data.
✓ BubbleUp technology finds hidden patterns and outliers in trace data automatically.
✓ Designed for deep system exploration rather than static dashboards.
✓ Team-oriented features streamline collaborative troubleshooting.
✓ Ideal for organizations building complex, distributed systems requiring deep analysis.
Splunk AppDynamics
AppDynamics has integrated OpenTelemetry support into their business-focused APM solution, allowing organizations to connect technical performance data to business outcomes. Now is a part of Splunk observability.
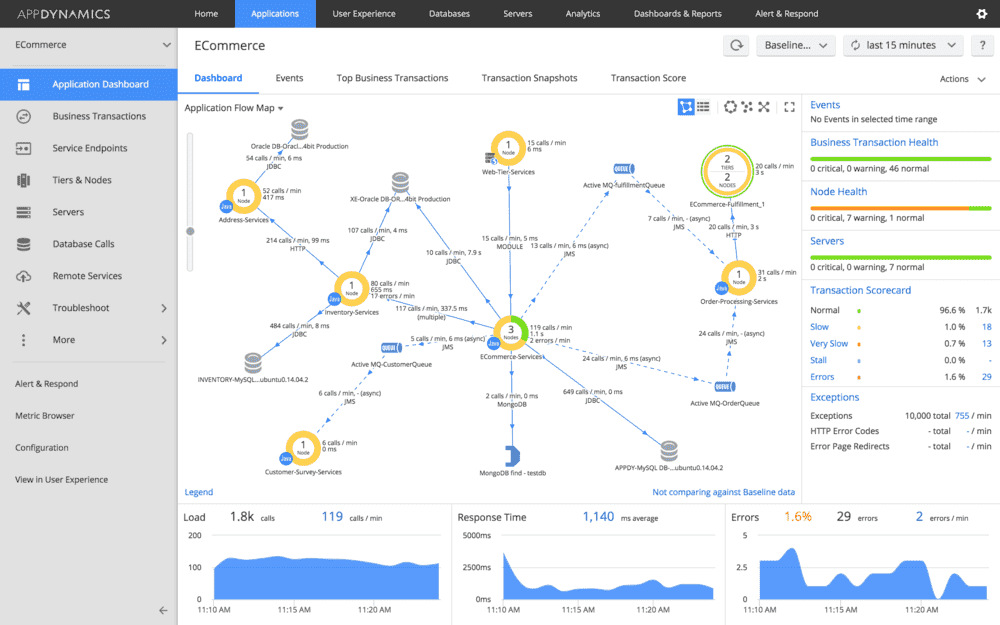
Capabilities:
- Business transaction monitoring with OpenTelemetry context
- Automated application topology mapping
- Enterprise security features
- Deep Cisco ecosystem integration
- Business iQ correlates technical metrics to business impact
Potential Drawbacks:
- Higher price point
- Enterprise focus may be overkill for smaller teams
Key Takeaways
✓ AppDynamics connects OpenTelemetry data to business metrics and outcomes.
✓ Business transaction monitoring provides context beyond technical metrics.
✓ Automated topology mapping visualizes complex service dependencies.
✓ Cisco ecosystem integration offers broader IT operations alignment.
✓ Best suited for enterprises seeking business-centric observability solutions.
Prometheus + OpenTelemetry
The combination of OpenTelemetry for collection and Prometheus for storage and querying has become a popular open source observability stack, especially in Kubernetes environments.
Capabilities:
- OpenTelemetry Prometheus integration is well-established
- PromQL provides powerful metric analysis
- Thanos or Cortex enable long-term storage
- Kubernetes-native monitoring
- Zero licensing costs
Potential Drawbacks:
- Requires significant expertise to deploy and maintain
- Limited native support for traces and logs
Key Takeaways
✓ Prometheus with OpenTelemetry offers a powerful open-source metrics solution.
✓ PromQL provides a robust query language specifically designed for metrics analysis.
✓ Kubernetes-native architecture makes it ideal for container environments.
✓ Thanos extends capabilities with long-term storage and global query views.
✓ Best choice for organizations with technical expertise seeking a cost-effective solution.
Choosing the Right Platform
Selecting the ideal OpenTelemetry platform depends on several factors:
| Factor | Considerations |
|---|---|
| Scale | Data volume, number of services, cardinality needs |
| Team Size | Available expertise, administrative overhead |
| Budget | Open source vs. commercial, pricing models |
| Existing Tools | Integration with current environment |
| Deployment Model | Self-hosted, SaaS, hybrid options |
For startups and small teams, Uptrace and Grafana Cloud offer excellent entry points with straightforward setup and reasonable costs. Mid-sized organizations might consider New Relic or Honeycomb for their balance of capabilities and cost. Enterprises with complex requirements often find Dynatrace or Splunk provide the comprehensive features they need.
Conclusion
This platforms highlighted here represent different approaches to leveraging OpenTelemetry data, from open source solutions to enterprise platforms.
Uptrace stands out as a truly OpenTelemetry-native solution built from the ground up around the standard. Established vendors like Datadog, New Relic, and Dynatrace have made significant investments in OpenTelemetry compatibility. Open source options like the Prometheus/OpenTelemetry combination continue to mature, offering cost-effective alternatives for teams with the expertise to manage them.
As OpenTelemetry adoption accelerates in 2025, these platforms demonstrate that organizations no longer need to choose between open standards and powerful capabilities – they can have both.
You can start with Uptrace in minutes to understand how it works.
FAQ
- What is OpenTelemetry and why is it important?
OpenTelemetry is an open source observability framework for cloud-native software that provides vendor-neutral APIs, libraries, agents, and instrumentation to generate, collect, and export telemetry data. It's important because it eliminates vendor lock-in, reduces agent sprawl, and provides a standardized approach to observability. - How does the OpenTelemetry Collector work?
The OpenTelemetry Collector receives telemetry data from instrumented applications, processes it through a pipeline of components (receivers, processors, and exporters), and forwards it to one or more observability backends. It can be deployed as an agent alongside applications or as a gateway that aggregates data from multiple sources. - Can I use multiple OpenTelemetry-compatible platforms simultaneously?
Yes, one of the key benefits of OpenTelemetry is the ability to send telemetry data to multiple backends simultaneously. The OpenTelemetry Collector can be configured to export data to several platforms without any changes to your application instrumentation. - How difficult is migration from proprietary agents to OpenTelemetry?
Migration complexity varies depending on your current setup. Many platforms offer migration paths that allow gradual transition, starting with the OpenTelemetry Collector as a proxy before moving to native OpenTelemetry instrumentation. Most major languages have auto-instrumentation libraries that simplify the process. - Does OpenTelemetry handle all three pillars of observability?
Yes, OpenTelemetry provides support for metrics, traces, and logs, covering all three pillars of observability. While tracing support matured first, the metrics and logging specifications have reached stability in recent years, making OpenTelemetry a comprehensive solution for all telemetry types. - How do different platforms handle OpenTelemetry data storage?
Storage approaches vary significantly: Uptrace uses a SQL backend for flexibility and performance, Jaeger offers multiple storage options (Elasticsearch, Cassandra), Prometheus uses its time-series database, while vendors like Datadog and New Relic use proprietary storage systems optimized for their query engines. - What's the cost difference between OpenTelemetry-native and traditional platforms?
OpenTelemetry-native platforms often offer more cost-effective pricing models since they're designed specifically for the data format. Traditional platforms that have adapted to support OpenTelemetry may maintain premium pricing, especially if they offer additional proprietary features that leverage the data. - Does OpenTelemetry require specialized skills to implement?
Basic OpenTelemetry implementation requires minimal specialized knowledge, especially with auto-instrumentation libraries. However, advanced configurations, custom instrumentation, and operating the OpenTelemetry Collector at scale benefit from deeper knowledge of observability concepts and distributed systems.
OpenTelemetry offers lightweight, modular solutions for tracing — perfect even for part-time developers working on microservices or client projects. If you're one of them, take a look at the latest part-time .NET developer positions on Jooble.
You may also be interested in: