Instrument Go app with OpenTelemetry Tracing
This tutorial demonstrates how to instrument a basic Go app using OpenTelemetry Go API. You will instrument an example app to measure the timing of each operation along with some execution context. You will also record errors that may happen during program execution.
Uptrace
Uptrace is an open source APM and blazingly fast distributed tracing tool powered by OpenTelemetry and ClickHouse. It is a popular alternative to Jaeger and can be installed by downloading a precompiled binary.
Example application
Let's create a directory and initialize a Go module for our application:
mkdir go-example-app
cd go-example-app
go mod init go-example-app
Our example application makes an HTTP call to download information about user's IP address via ip2c.org API. The main.go file looks like this:
package main

import (
    "fmt"
    "io/ioutil"
    "log"
    "net/http"
    "strings"
)

func main() {
    countryInfo, err := fetchCountryInfo()
    if err != nil {
        log.Print(err)
        return
    }

    countryCode, countryName, err := parseCountryInfo(countryInfo)
    if err != nil {
        log.Print(err)
        return
    }

    fmt.Println(countryCode, countryName)
}

func fetchCountryInfo() (string, error) {
    resp, err := http.Get("https://ip2c.org/self")
    if err != nil {
        return "", err
    }
    defer resp.Body.Close()

    b, err := ioutil.ReadAll(resp.Body)
    if err != nil {
        return "", err
    }
    return string(b), nil
}

func parseCountryInfo(s string) (code, country string, _ error) {
    parts := strings.Split(s, ";")
    if len(parts) < 4 {
        return "", "", fmt.Errorf("ip2c: can't parse response: %q", s)
    }
    return parts[1], parts[3], nil
}
Adding context.Context
Go uses context.Context to pass the active span from one function to another. Let's create a default context and accept it as a first arg in our functions:
diff --git a/main.go b/main.go
index 8cc2c64..1408398 100644
--- a/main.go
+++ b/main.go
@@ -1,6 +1,7 @@
 package main

 import (
+       "context"
        "fmt"
        "io/ioutil"
        "log"
@@ -9,13 +10,15 @@ import (
 )

 func main() {
-       countryInfo, err := fetchCountryInfo()
+       ctx := context.Background()
+
+       countryInfo, err := fetchCountryInfo(ctx)
        if err != nil {
                log.Print(err)
                return
        }

-       countryCode, countryName, err := parseCountryInfo(countryInfo)
+       countryCode, countryName, err := parseCountryInfo(ctx, countryInfo)
        if err != nil {
                log.Print(err)
                return
@@ -24,7 +27,7 @@ func main() {
        fmt.Println(countryCode, countryName)
 }

-func fetchCountryInfo() (string, error) {
+func fetchCountryInfo(ctx context.Context) (string, error) {
        resp, err := http.Get("https://ip2c.org/self")
        if err != nil {
                return "", err
@@ -38,7 +41,7 @@ func fetchCountryInfo() (string, error) {
        return string(b), nil
 }

-func parseCountryInfo(s string) (code, country string, _ error) {
+func parseCountryInfo(ctx context.Context, s string) (code, country string, _ error) {
        parts := strings.Split(s, ";")
        if len(parts) < 4 {
                return "", "", fmt.Errorf("ip2c: can't parse response: %q", s)
Creating a tracer
To monitor our program, we need to wrap (instrument) potentially interesting operations with spans. You create spans with a tracer, so we will need one. But first let's install Uptrace which comes with OpenTelemetry as a dependency:
go get github.com/uptrace/uptrace-go
Now we can create a named tracer go-example-app:
import "go.opentelemetry.io/otel"

var tracer = otel.Tracer("go-example-app")
Instrumenting code with spans
You instrument code by creating a span at the start of each operation and calling span.End at the end. To save the active span, API accepts and returns context.Context that we should propagate to other spans.
ctx, span := tracer.Start(ctx, "operation-name")

// operation body

span.End()
Let's use that knowledge to instrument fetchCountryInfo function and record execution context using span.SetAttributes API:
diff --git a/main.go b/main.go
index ff4d7c8..930a90f 100644
--- a/main.go
+++ b/main.go
@@ -9,6 +9,7 @@ import (
        "strings"

        "go.opentelemetry.io/otel"
+       "go.opentelemetry.io/otel/attribute"
 )

 var tracer = otel.Tracer("go-example-app")
@@ -32,6 +33,9 @@ func main() {
 }

 func fetchCountryInfo(ctx context.Context) (string, error) {
+       ctx, span := tracer.Start(ctx, "fetchCountryInfo")
+       defer span.End()
+
        resp, err := http.Get("https://ip2c.org/self")
        if err != nil {
                return "", err
@@ -43,6 +47,11 @@ func fetchCountryInfo(ctx context.Context) (string, error) {
                return "", err
        }

+       span.SetAttributes(
+               attribute.String("ip", "self"),
+               attribute.Int("resp_len", len(b)),
+       )
+
        return string(b), nil
 }
Monitoring errors
To record errors, OpenTelemetry uses span events and provides span.RecordError API:
if err != nil {
    span.RecordError(ctx, err)
    return err
}
You can also use some logging library like logrus and integrate it with OpenTelemetry:
if err != nil {
    logrus.WithContext(ctx).WithError(err).Error("http.Get failed")
    return err
}
Root span
After successfully instrumenting our 2 functions we need to tie them together into a single trace. You do that by creating a root span for them. While at it, let's also record the errors.
diff --git a/main.go b/main.go
index 3973b46..2db8354 100644
--- a/main.go
+++ b/main.go
@@ -24,15 +23,18 @@ func main() {

        ctx := context.Background()

+       ctx, span := tracer.Start(ctx, "fetchCountry")
+       defer span.End()
+
        countryInfo, err := fetchCountryInfo(ctx)
        if err != nil {
-               log.Print(err)
+               span.RecordError(ctx, err)
                return
        }

        countryCode, countryName, err := parseCountryInfo(ctx, countryInfo)
        if err != nil {
-               log.Print(err)
+               span.RecordError(ctx, err)
                return
        }
Configuring OpenTelemetry
As the last step we need to configure OpenTelemetry to export spans to Uptrace. You can do that using a DSN from the project settings page:
import "github.com/uptrace/uptrace-go/uptrace"

uptrace.ConfigureOpentelemetry(&uptrace.Config{
    // copy your project DSN here or use UPTRACE_DSN env var
    DSN: "<FIXME>",
})
Putting all together
The resulting program is available at GitHub.
package main

import (
    "context"
    "fmt"
    "io/ioutil"
    "net/http"
    "strings"

    "go.opentelemetry.io/otel"
    "go.opentelemetry.io/otel/attribute"

    "github.com/uptrace/uptrace-go/uptrace"
)

var tracer = otel.Tracer("app_or_package_name")

func main() {
    ctx := context.Background()

    uptrace.ConfigureOpentelemetry(&uptrace.Config{
        // copy your project DSN here or use UPTRACE_DSN env var
        DSN: "<FIXME>",
    })
    defer uptrace.Shutdown(ctx)

    ctx, span := tracer.Start(ctx, "fetchCountry")
    defer span.End()

    countryInfo, err := fetchCountryInfo(ctx)
    if err != nil {
        span.RecordError(err)
        return
    }

    countryCode, countryName, err := parseCountryInfo(ctx, countryInfo)
    if err != nil {
        span.RecordError(err)
        return
    }

    span.SetAttributes(
        attribute.String("country.code", countryCode),
        attribute.String("country.name", countryName),
    )

    fmt.Println("trace URL", uptrace.TraceURL(span))
}

func fetchCountryInfo(ctx context.Context) (string, error) {
    ctx, span := tracer.Start(ctx, "fetchCountryInfo")
    defer span.End()

    resp, err := http.Get("https://ip2c.org/self")
    if err != nil {
        span.RecordError(err)
        return "", err
    }
    defer resp.Body.Close()

    b, err := ioutil.ReadAll(resp.Body)
    if err != nil {
        span.RecordError(err)
        return "", err
    }

    span.SetAttributes(
        attribute.String("ip", "self"),
        attribute.Int("resp_len", len(b)),
    )

    return string(b), nil
}

func parseCountryInfo(ctx context.Context, s string) (code, country string, _ error) {
    ctx, span := tracer.Start(ctx, "parseCountryInfo")
    defer span.End()

    parts := strings.Split(s, ";")
    if len(parts) < 4 {
        err := fmt.Errorf("ip2c: can't parse response: %q", s)
        span.RecordError(err)
        return "", "", err
    }
    return parts[1], parts[3], nil
}
You can run it passing the DSN as an environment variable:
UPTRACE_DSN=<FIXME> go run main.go
trace: https://app.uptrace.dev/search/<project_id>?q=<trace_id>
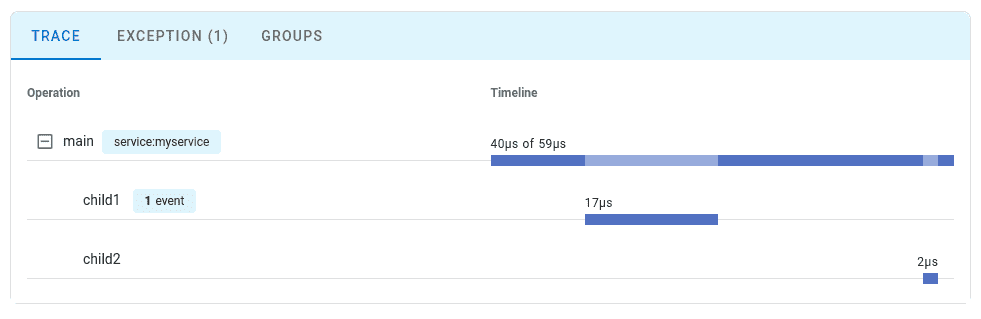
By following the trace link, you should see the trace that demonstrates that the app spends the majority of time in fetchCountryInfo function
Conclusion
By using context.Context and OpenTelemetry Go API we were able to instrument our simple program. Curious to try it yourself? Check out Getting started guide for Go.
For production applications, you don't need to manually instrument every function. OpenTelemetry provides ready-to-use instrumentation libraries for popular Go frameworks and libraries. For example, you can use OpenTelemetry Gin for Gin web framework, OpenTelemetry Echo for Echo, OpenTelemetry GORM for database operations, and OpenTelemetry gRPC for gRPC services. These libraries automatically create spans for HTTP requests, database queries, and RPC calls, significantly reducing the instrumentation effort.