Monitoring cache stats using OpenTelemetry Go Metrics
This article explains how to use opentelemetry-go Metrics API to collect metrics, for example, go-redis/cache stats.
Getting started with OpenTelemetry Metrics
To get started with metrics, you need a MeterProvider which provides access to Meters:
import "go.opentelemetry.io/otel"

// Meter can be a global/package variable.
var Meter = otel.Meter("app_or_package_name")
Using the meter, you can create instruments and use them to measure operations. The simplest Counter instrument looks like this:
import (
    "go.opentelemetry.io/otel/attribute"
    "go.opentelemetry.io/otel/metric"
)

counter, err := Meter.Int64Counter(
    "test.my_counter",
    metric.WithUnit("1"),
    metric.WithDescription("Just a test counter"),
)

// Increment the counter.
counter.Add(ctx, 1, metric.WithAttributes(attribute.String("foo", "bar")))
counter.Add(ctx, 10, metric.WithAttributes(attribute.String("hello", "world")))
You can find more examples at GitHub.
Cache stats
Our Redis-based cache keeps stats about hits and misses in the following struct:
type Stats struct {
    Hits   uint64
    Misses uint64
}
You can get the current stats with:
stats := cache.Stats()
fmt.Println("hits", stats.Hits)
fmt.Println("misses", stats.Misses)
Monitoring cache stats
To monitor our cache, we need to decide between synchronous and observable instruments:
- Synchronous instruments (e.g.
Int64Counter) are updated in-line when an event happens — you callcounter.Add(ctx, 1)on each cache hit. - Observable instruments (e.g.
Int64ObservableCounter) are read periodically by the SDK via a callback — ideal when stats are already tracked elsewhere (like ourcache.Stats()struct).
Since the cache library already tracks hits and misses internally, we use observable counters with a callback. This avoids double-counting and keeps the instrumentation code simple.
import (
    "go.opentelemetry.io/otel/metric"
)

func MonitorCache(cache *cache.Cache, meter metric.Meter) {
    hits, _ := meter.Int64ObservableCounter("cache.hits")
    misses, _ := meter.Int64ObservableCounter("cache.misses")

    // SDK periodically calls this function to collect data.
    if _, err := meter.RegisterCallback(
        func(ctx context.Context, observer metric.Observer) error {
            stats := cache.Stats()

            observer.ObserveInt64(hits, int64(stats.Hits))
            observer.ObserveInt64(misses, int64(stats.Misses))
            return nil
        },
        hits,
        misses,
    ); err != nil {
        panic(err)
    }
}
Using the instruments above we get access to the following metrics:
cache.hits- number of cache hits.cache.misses- number of cache misses.cache.hits + cache.misses- number of cache requests.cache.hits / (cache.hits + cache.misses)- cache hit rate.
Metric attributes
The code above works well enough, but what if we want to add another metric:
type Stats struct {
    Hits   uint64
    Misses uint64
+    Errors uint64
}
We could add another instrument to observe Errors field, but then we also need to update our math:
cache.hits + cache.misses + cache.errors- number of cache requests.cache.hits / (cache.hits + cache.misses + cache.errors)- cache hit rate.
Can we do better? Yes, using a single instrument and metric attributes:
import (
    "go.opentelemetry.io/otel/attribute"
    "go.opentelemetry.io/otel/metric"
)

func MonitorCache(cache *cache.Cache, meter metric.Meter) {
    cacheCounter, _ := meter.Int64ObservableCounter("cache.stats")

    hitsAttr := metric.WithAttributes(attribute.String("type", "hits"))
    missesAttr := metric.WithAttributes(attribute.String("type", "misses"))
    errorsAttr := metric.WithAttributes(attribute.String("type", "errors"))

    // SDK periodically calls this function to collect data.
    if _, err := meter.RegisterCallback(
        func(ctx context.Context, observer metric.Observer) error {
            stats := cache.Stats()

            observer.ObserveInt64(cacheCounter, int64(stats.Hits), hitsAttr)
            observer.ObserveInt64(cacheCounter, int64(stats.Misses), missesAttr)
            observer.ObserveInt64(cacheCounter, int64(stats.Errors), errorsAttr)
            return nil
        },
        cacheCounter,
    ); err != nil {
        panic(err)
    }
}
Our new math looks like this and does not require changes when you add new stats:
cache.stats- number of cache requests.filter(cache.stats, type = "hits")- number of cache hits.filter(cache.stats, type = "misses")- number of cache misses.filter(cache.stats, type = "hits") / cache.stats- cache hit rate.
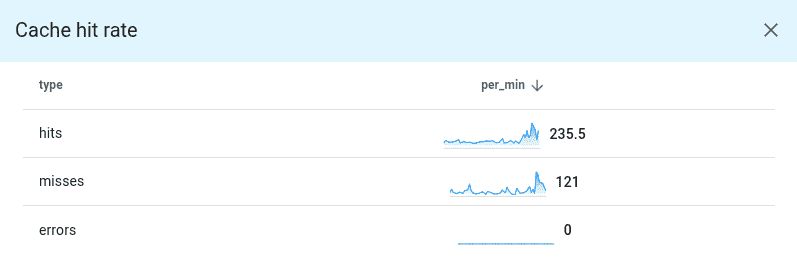
As a bonus, you can easily visualize all available metrics using grouping by type attribute, for example, using Uptrace:
cache.stats | group by type
Metric naming conventions
When choosing metric names, follow the OpenTelemetry naming conventions:
- Use dot-separated namespaces:
cache.hits, notcache_hits. - Use lowercase:
http.server.duration, notHTTP.Server.Duration. - Include the unit in the instrument options, not the name: use
metric.WithUnit("ms")instead of naming itcache.latency_ms.
Prometheus
To export metrics to Prometheus, see Exporting OpenTelemetry Metrics to Prometheus.
What's next
Next, you can learn about the available metric instruments and try to instrument your code. You can also apply the same pattern to monitor other statistics, such as database connection pool metrics, HTTP client latency, or queue depths.
You may also be interested in: