Top 10 PostgreSQL Monitoring Tools for Performance & Security [2026]
PostgreSQL monitoring tools help database administrators track query performance, connection counts, cache hit ratios, and resource usage to optimize database performance. With the right monitoring solution, teams can identify slow queries, troubleshoot replication lag, and prevent performance bottlenecks before they impact applications.
For comprehensive observability, integrate database monitoring with distributed tracing to correlate query performance with application requests.
Quick Comparison
| Tool | Type | Best For | Pricing | OpenTelemetry Support |
|---|---|---|---|---|
| Uptrace | Open Source | Distributed systems | Free / Commercial | Yes — native OTel backend |
| SigNoz | Open Source | Cloud-native apps | Free / Cloud | Yes — native OTel backend |
| Prometheus + Grafana | Open Source | Kubernetes environments | Free | Partial — OTLP receiver |
| Datadog | Commercial | Enterprise monitoring | $85/mo minimum | Partial — OTLP ingest |
| New Relic | Commercial | Full-stack visibility | Usage-based | Partial — OTLP ingest |
| pganalyze | Commercial | Query optimization | $149/mo | No |
| pgAdmin | Open Source | Development & testing | Free | No |
| pgBadger | Open Source | Log analysis | Free | No |
| PMM | Open Source | Open source databases | Free | No |
| Zabbix | Open Source | Large deployments | Free | No |
Top 10 PostgreSQL Monitoring Tools
OpenTelemetry-Based Solutions
Uptrace
Uptrace is an OpenTelemetry-native APM that provides PostgreSQL monitoring through the OpenTelemetry PostgreSQL receiver. It collects database metrics, traces, and logs to provide unified visibility across databases, APIs, and application code.
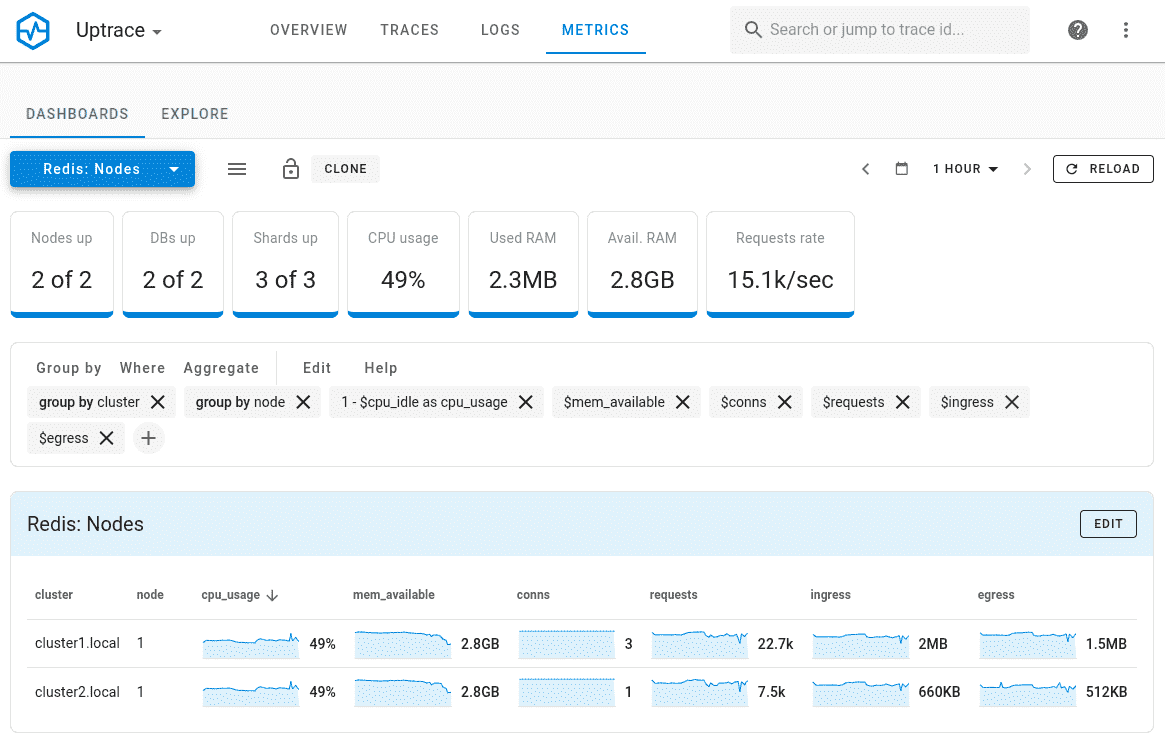
Uptrace collects PostgreSQL metrics via the OpenTelemetry Collector and correlates them with application traces — so you can pinpoint exactly which database queries are slowing down specific API endpoints. Built on ClickHouse, it stores billions of spans and metrics on a single server at a fraction of SaaS costs, with configurable retention and full SQL access to your telemetry data. You can self-host with Docker or use the managed cloud; either way, dashboards, alerts, and trace-to-log correlation are included out of the box.
Features:
- OpenTelemetry-native architecture with intuitive query builder
- Rich dashboards and automatic alerts
- Unified visibility across databases, APIs, and application code
- Integration with OpenTelemetry Collector for PostgreSQL metrics
Best for: Teams using OpenTelemetry for distributed systems monitoring
Pricing: Free open source; commercial licenses available
SigNoz
SigNoz is an open-source OpenTelemetry-native APM that provides PostgreSQL monitoring through distributed tracing and metrics collection.
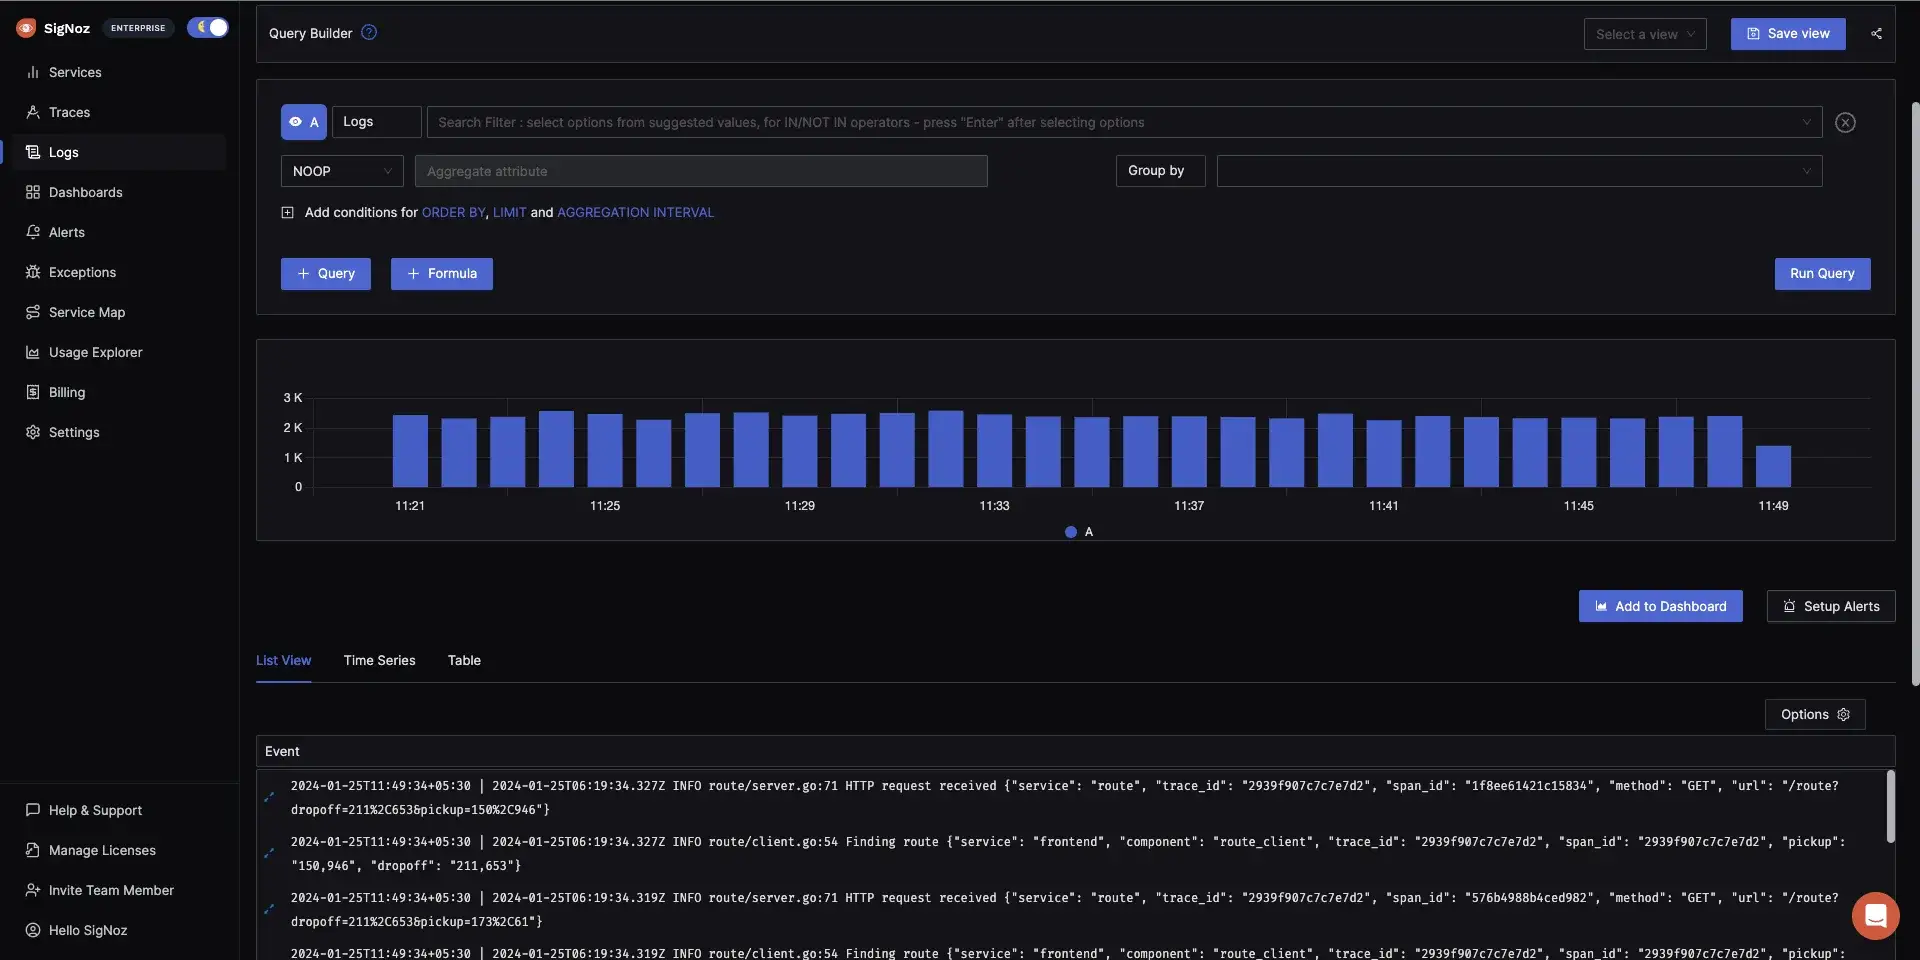
SigNoz collects PostgreSQL metrics through the OpenTelemetry Collector and links them to distributed traces, helping you see how slow queries affect response times across services. Pre-built dashboards cover connection counts, transaction rates, and cache hit ratios without additional configuration.
Features:
- OpenTelemetry-native architecture
- Distributed tracing with database query correlation
- Pre-built PostgreSQL dashboards
- Query performance analysis
Best for: Teams adopting OpenTelemetry standards for cloud-native PostgreSQL monitoring
Pricing: Free open source; cloud version available
PostgreSQL-Specific Tools
pganalyze
pganalyze specializes in PostgreSQL performance monitoring and query optimization, providing detailed insights into query execution and index usage.

pganalyze automatically collects query statistics from pg_stat_statements and system catalogs to identify slow queries, missing indexes, and inefficient query patterns. The platform provides explain plan visualization and index recommendations to optimize database performance.
Features:
- Automatic query performance tracking
- Index recommendations based on workload analysis
- Explain plan visualization
- Historical query performance trends
- Vacuum and bloat monitoring
Best for: Database administrators focused on PostgreSQL query optimization and performance tuning
Pricing: Production tier starts at $149/month per database server
Open-Source Administration Tools
pgAdmin
pgAdmin is a tool for designing and managing PostgreSQL databases. It has a graphical interface for administering databases and features for monitoring server activity, query performance, and database objects.
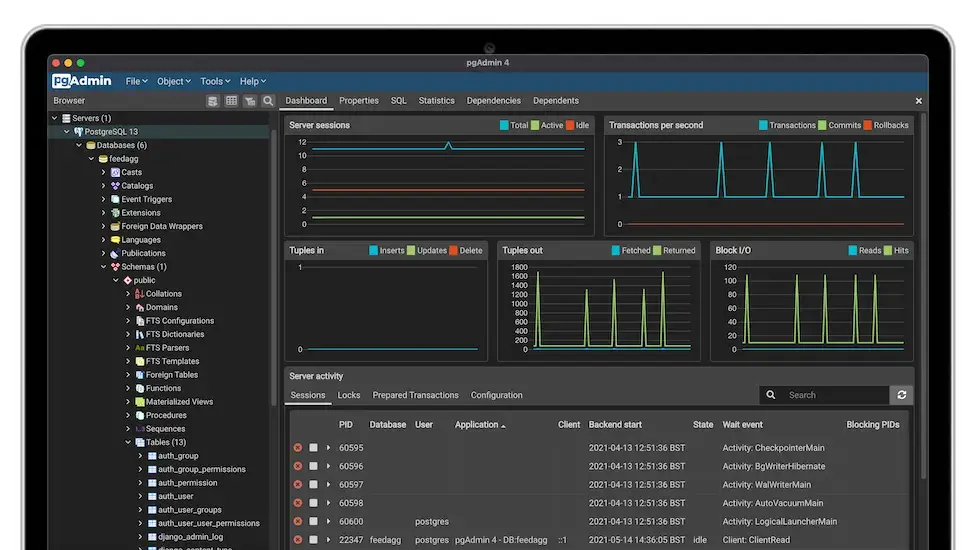
The server dashboard in pgAdmin offers an overview of important metrics, including CPU usage, memory usage, disk space, and active connections. This dashboard provides a quick snapshot of your PostgreSQL server's health and performance.
pgAdmin has a log file viewer that enables you to view and search PostgreSQL log files directly from the graphical interface. This feature can be used to monitor database activity, identify errors, and troubleshoot issues.
Although not as comprehensive as specialized monitoring solutions, pgAdmin offers basic alerting and notification capabilities. You can set up alerts for particular events, such as database connection failures or high CPU usage, and receive email notifications.
Features:
- Graphical interface for database administration
- Server dashboard with CPU, memory, disk space metrics
- Log file viewer for searching PostgreSQL logs
- Basic alerting for connection failures and resource usage
Best for: Development environments and basic PostgreSQL administration
Pricing: Free open source
pgBadger
pgBadger is a powerful log analyzer that generates detailed reports from PostgreSQL log files. It can help you identify slow queries, top SQL statements and general database performance issues.
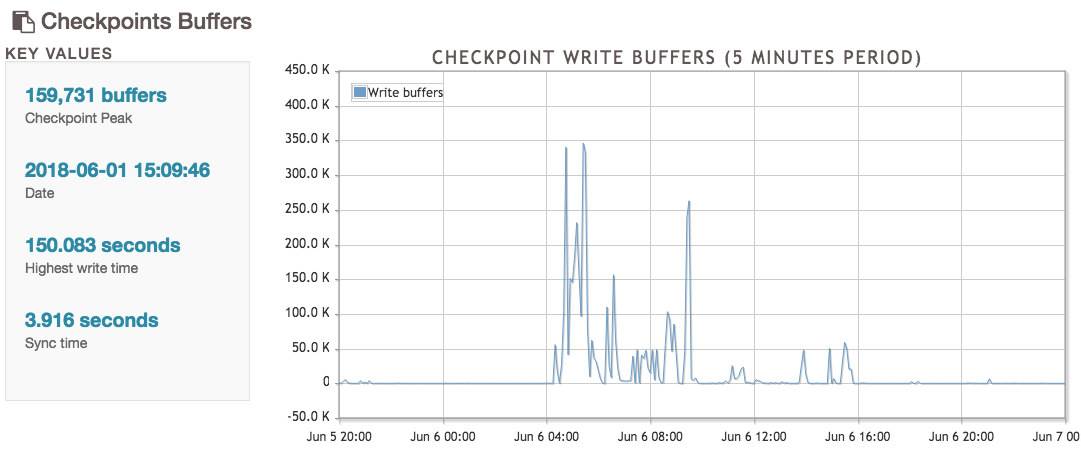
With pgBadger you can identify slow queries, top SQL statements, and resource usage to optimize your PostgreSQL database.
Features:
- Detailed log file analysis and reporting
- Slow query identification with execution statistics
- Top SQL statements ranking
- Resource usage analysis and visualization
- HTML report generation
Best for: Log analysis and identifying slow queries from PostgreSQL log files
Pricing: Free open source
Percona Monitoring and Management
PMM is a free and open source monitoring solution designed specifically for open source databases, including PostgreSQL. It provides a set of dashboards and in-depth performance analysis capabilities.
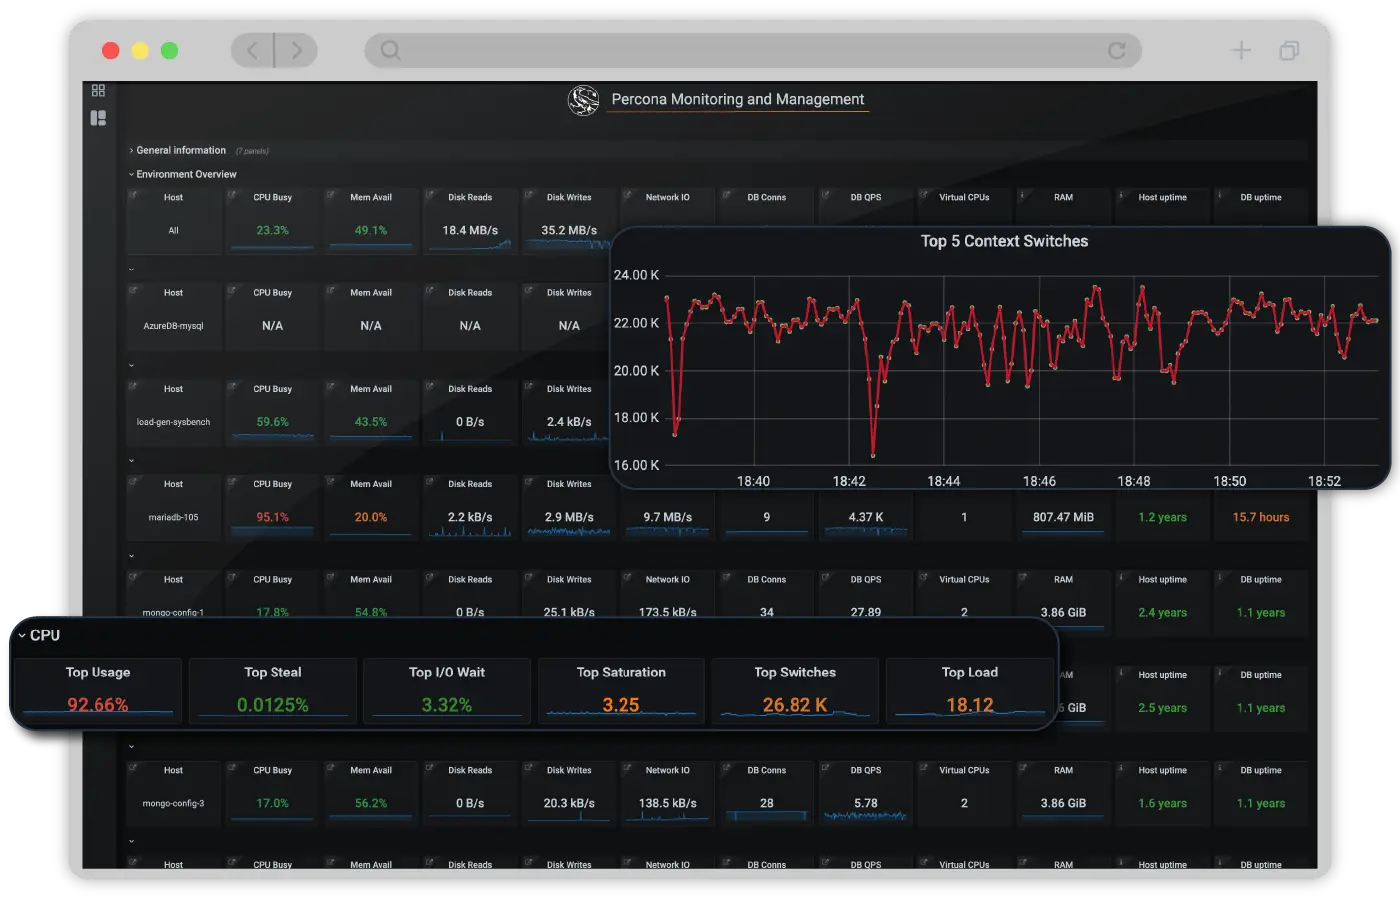
PMM provides real-time monitoring with customizable dashboards across MySQL, PostgreSQL, and MongoDB.
Features:
- Real-time monitoring with frequent metric collection
- Customizable dashboards for performance visualization
- Multi-database support (MySQL, PostgreSQL, MongoDB)
- In-depth performance analysis capabilities
- System resource utilization tracking
Best for: Organizations running multiple open source databases (MySQL, PostgreSQL, MongoDB)
Pricing: Free open source
Time-Series Monitoring Solutions
Prometheus + Grafana
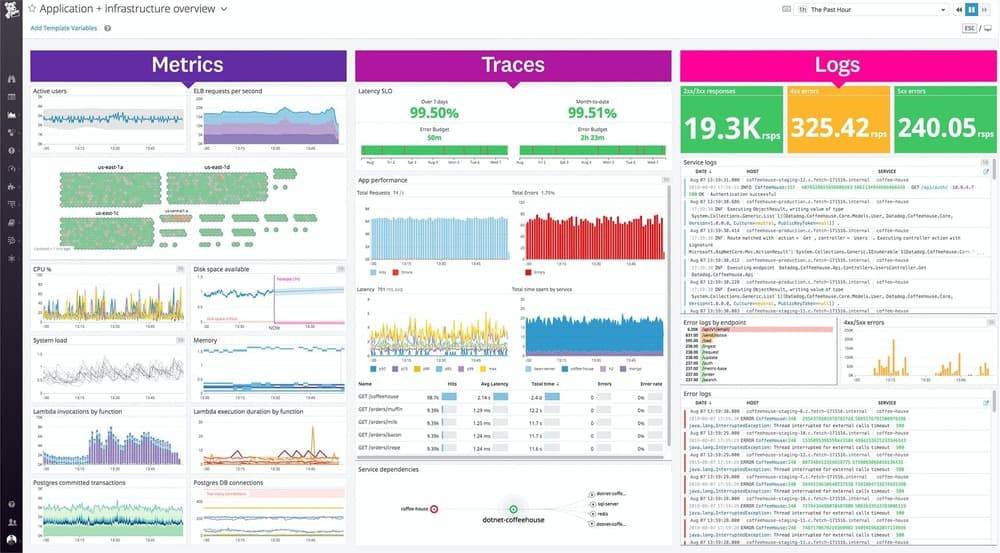
Prometheus is a popular open source monitoring and alerting tool that can be used to monitor PostgreSQL databases.
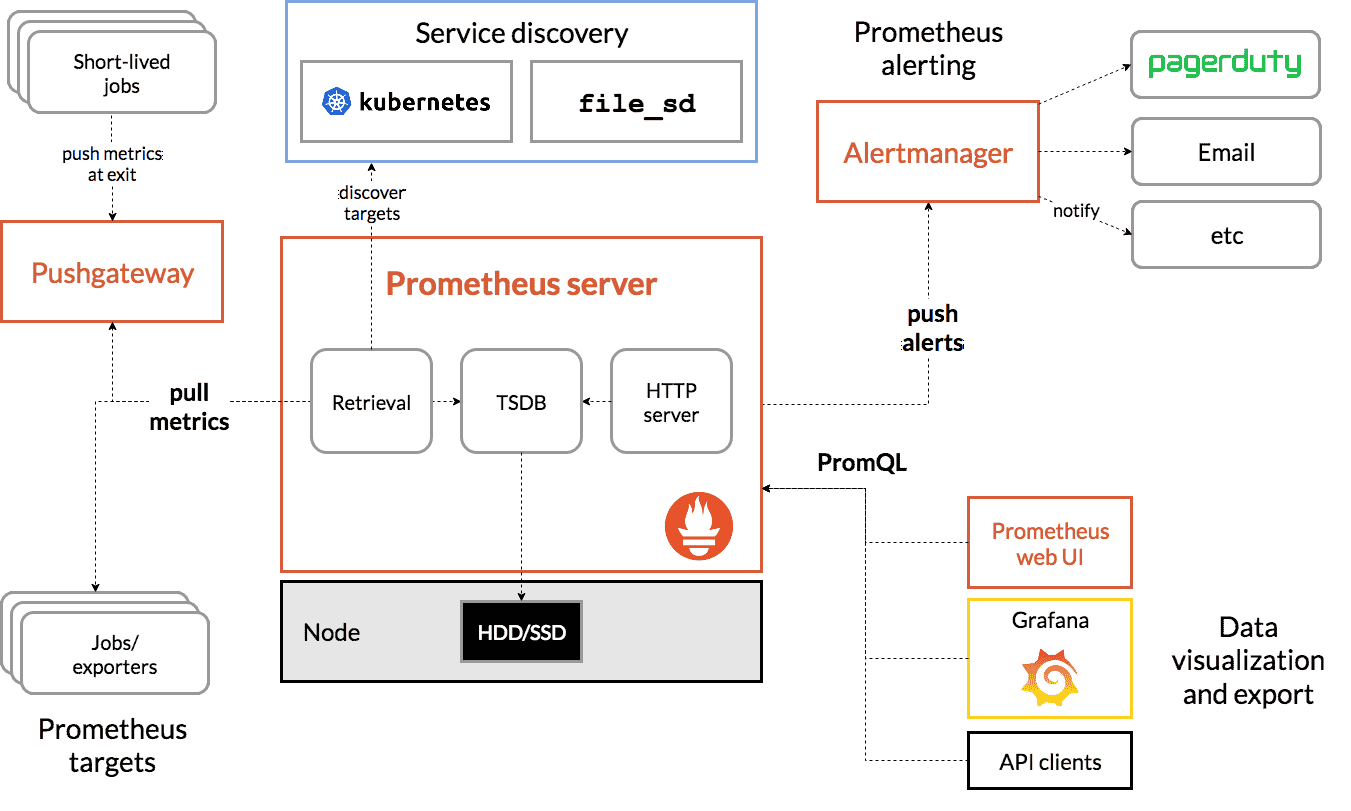
The PostgreSQL Exporter exposes metrics — database size, replication lag, latency, cache usage — which Prometheus scrapes and stores as time-series data. Pair with Grafana for custom dashboards and interactive visualizations.
Features:
- PostgreSQL Exporter for metrics collection
- Time-series data storage and querying
- Comprehensive metric coverage (size, lag, latency, cache)
- Grafana integration for custom dashboards
- Interactive and customizable visualizations
Best for: Kubernetes environments and organizations using Prometheus for infrastructure monitoring
Pricing: Free open source
Commercial Observability Platforms
Datadog
DataDog is a commercial monitoring and analysis platform that provides specialized PostgreSQL integration, allowing you to monitor and analyze PostgreSQL performance metrics. It provides an easy-to-use dashboard and alerting capabilities.
The Datadog Agent collects PostgreSQL metrics — connections, query performance, buffer pool stats, replication status — and surfaces them in customizable dashboards without manual instrumentation.
Features:
- Automatic PostgreSQL metrics collection via DataDog Agent
- Database connections and query performance tracking
- Buffer pool statistics and replication status monitoring
- Custom dashboards with graphs and visualizations
- Easy-to-use interface for monitoring at a glance
Best for: Enterprise environments requiring unified monitoring across infrastructure, applications, and databases
Pricing: Database monitoring from $70/host/month; infrastructure monitoring from $15/host/month (minimum $85/month)
New Relic
New Relic offers full-stack observability including PostgreSQL monitoring integrated with application performance monitoring (APM).
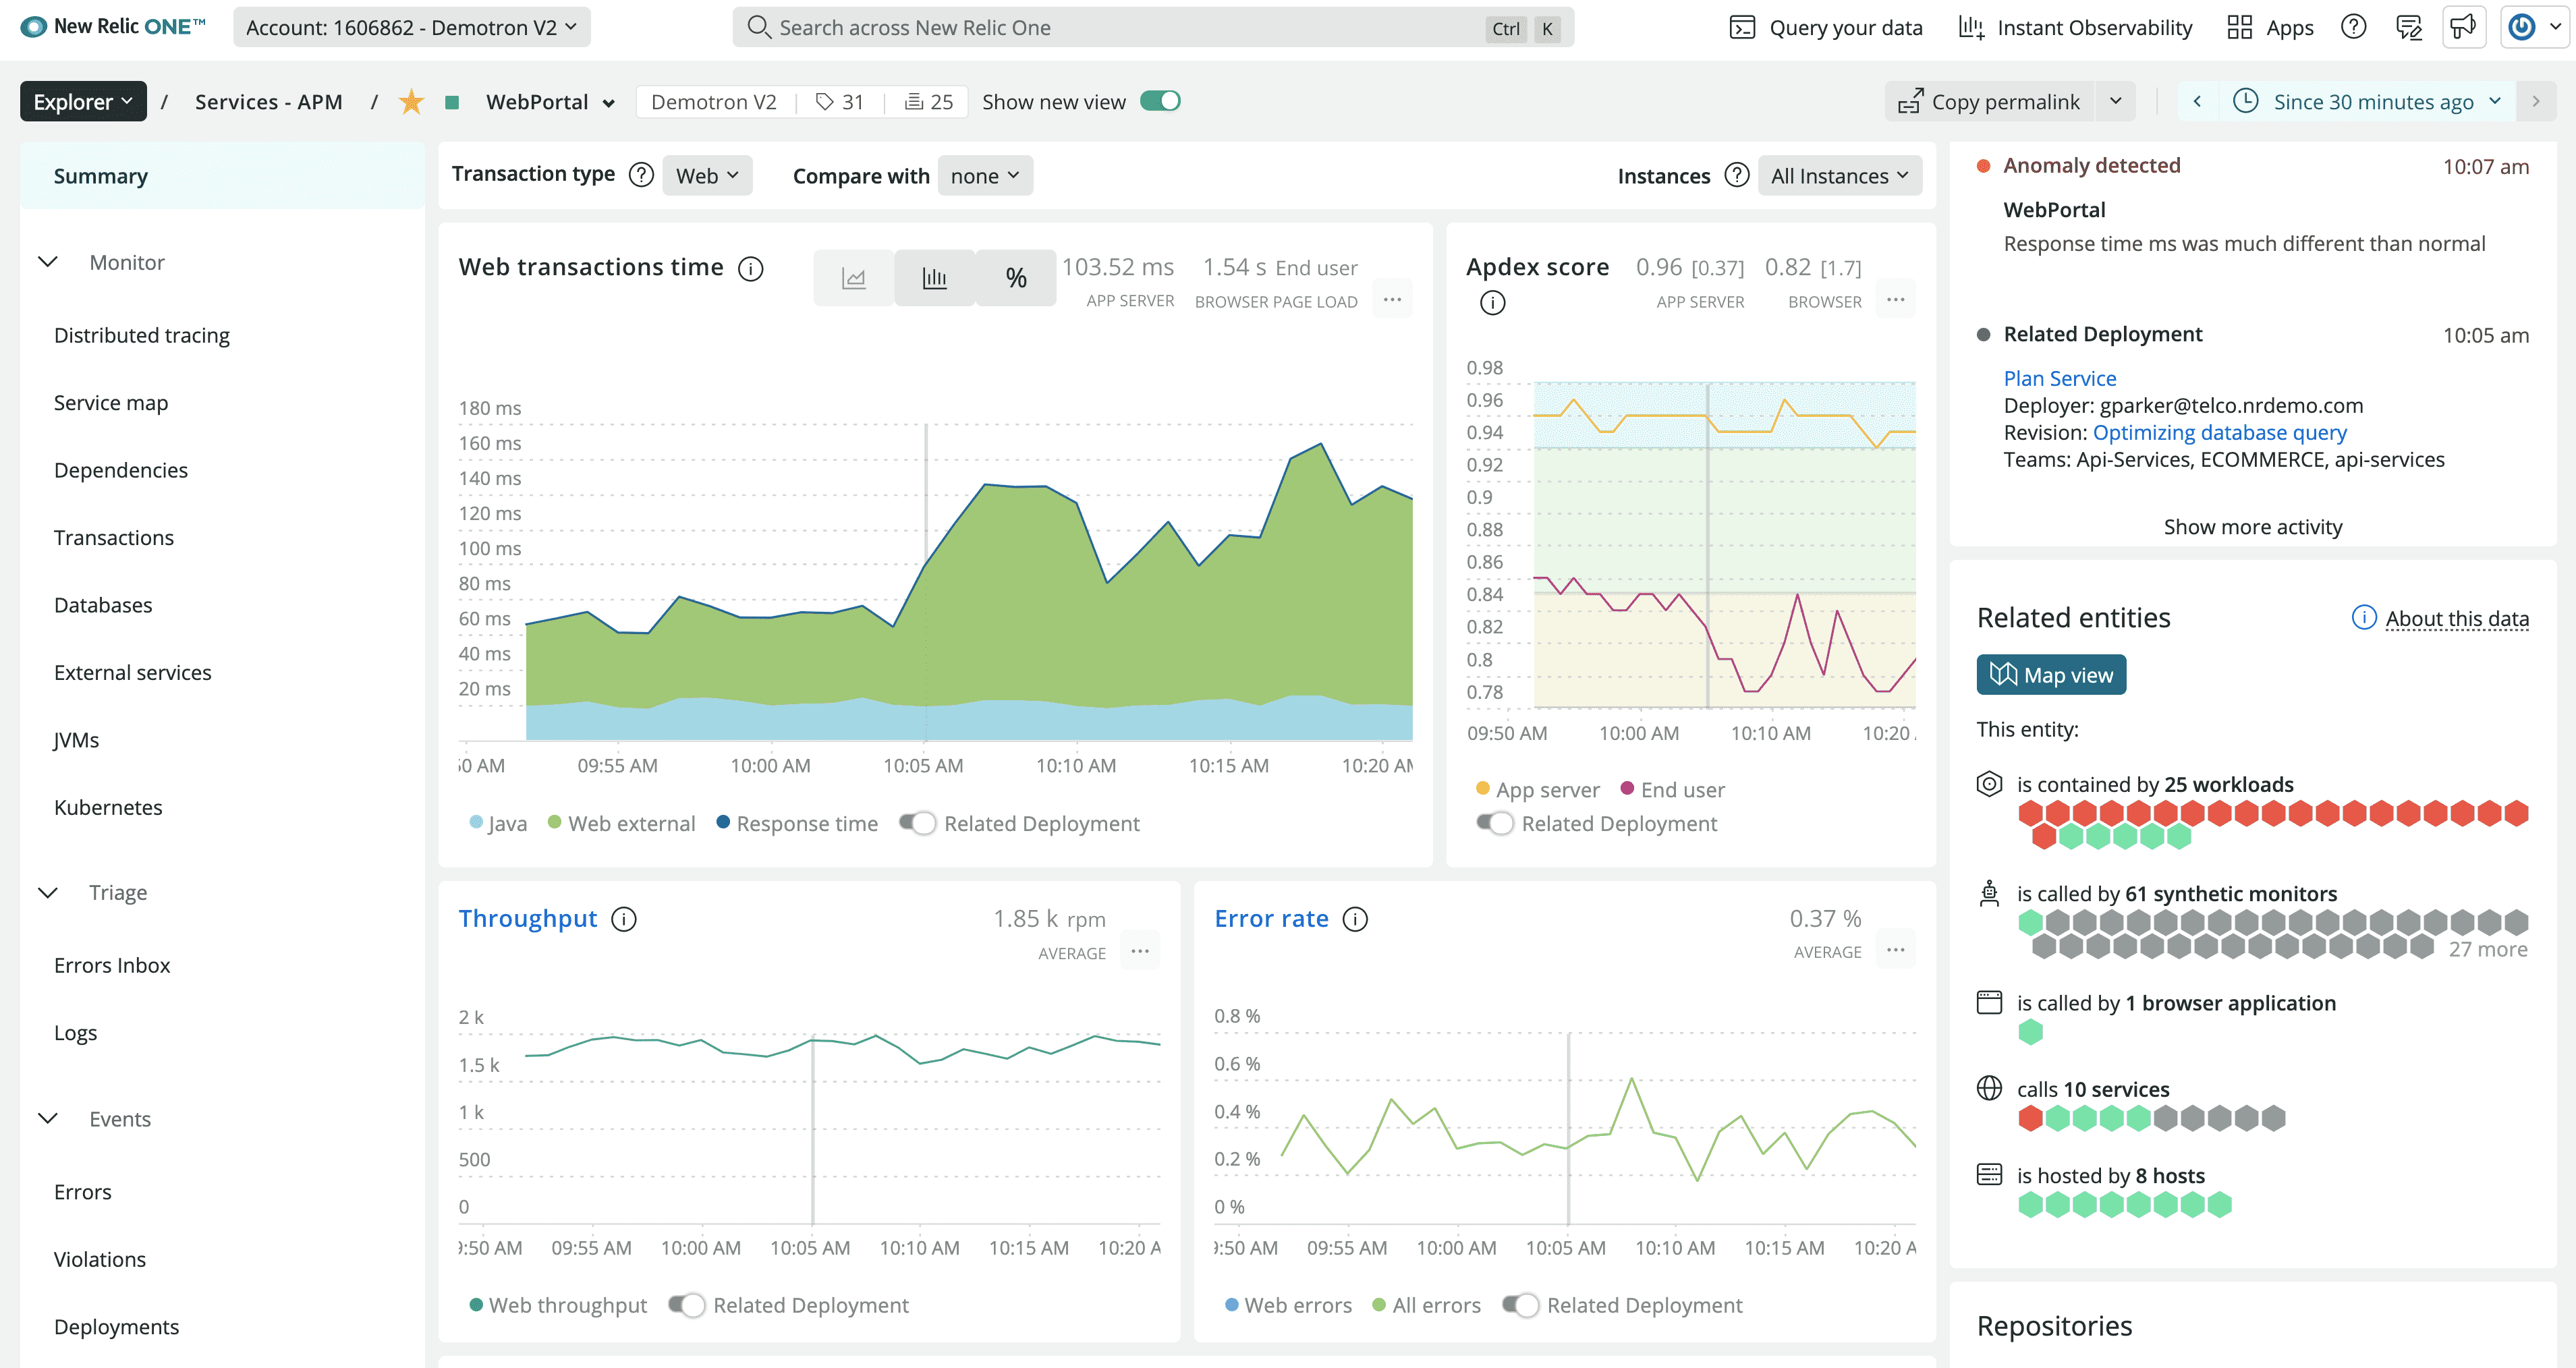
New Relic automatically correlates database query performance with application traces, helping identify how PostgreSQL performance impacts user experience. The platform provides query-level insights, execution plans, and resource utilization metrics within application context.
Features:
- Query-level performance tracking integrated with APM
- Automatic correlation between database and application performance
- Real-time alerting on database anomalies
- Historical performance trending
Best for: Organizations needing PostgreSQL monitoring integrated with full-stack application observability
Pricing: Usage-based pricing; free tier available with 100GB data/month
Zabbix
Zabbix is an open-source monitoring solution that supports PostgreSQL monitoring through its various built-in templates or custom scripts. It can monitor database performance metrics and generate alerts based on predefined thresholds.
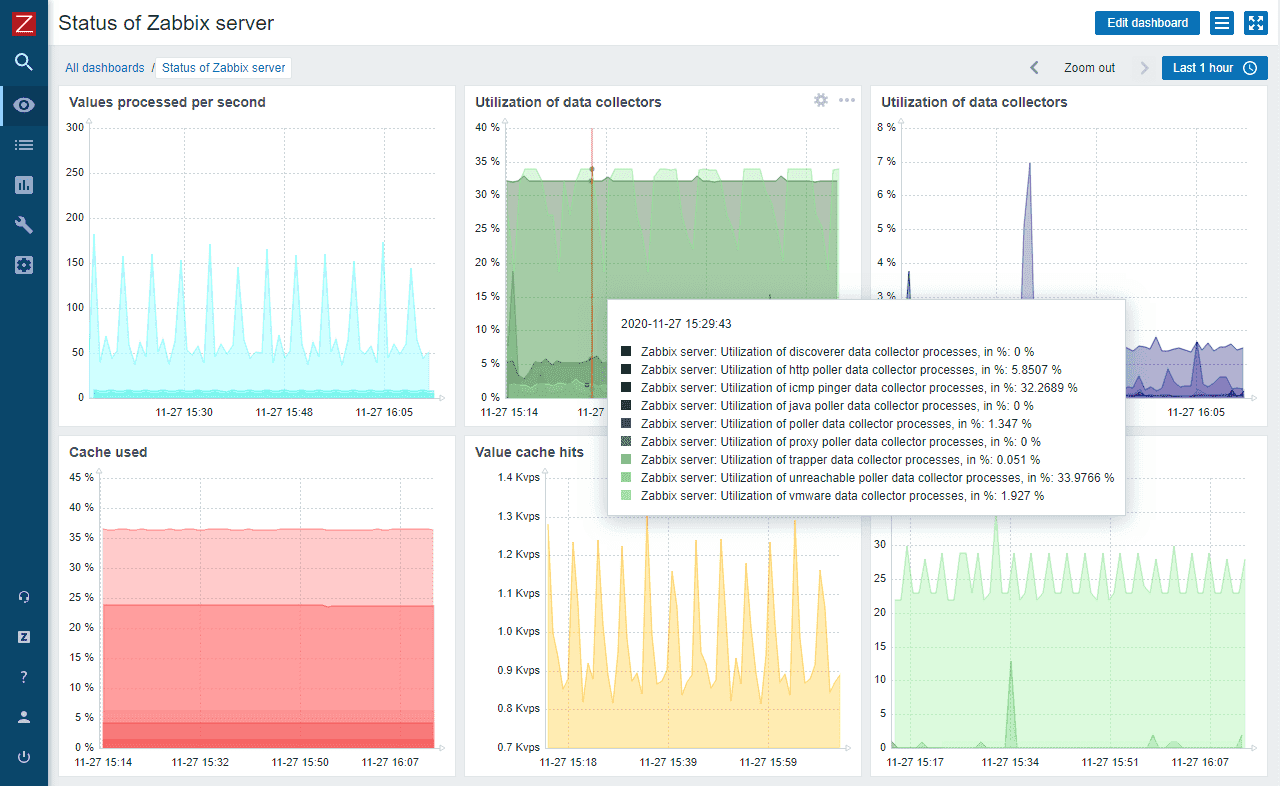
Zabbix relies on agents installed on the target systems to collect data. In the case of PostgreSQL, you need to enable monitoring by setting up the Zabbix agent on the PostgreSQL server.
After importing the PostgreSQL template, Zabbix will automatically collect PostgreSQL metrics such as connection counts, transaction rates, query performance and more. Additionally, you can define triggers to detect anomalies and trigger alerts when certain conditions are met.
Zabbix allows you to create custom charts to visualize PostgreSQL metrics over time. You can group related metrics and display them on a single dashboard for better monitoring.
Features:
- Built-in PostgreSQL templates for quick setup
- Automatic metrics collection (connections, transactions, queries)
- Customizable triggers for anomaly detection
- Custom charts and dashboard creation
- Comprehensive alerting system
Best for: Large-scale deployments requiring comprehensive infrastructure and database monitoring with customizable alerting
Pricing: Free open source
Conclusion
Choose based on your needs: pganalyze for query optimization, Uptrace or SigNoz for OpenTelemetry-native monitoring, Datadog for enterprise observability, or Prometheus + Grafana for self-hosted Kubernetes environments. Verify compatibility with your PostgreSQL version before deploying.
FAQ
What are PostgreSQL monitoring tools? PostgreSQL monitoring tools track database performance metrics including query execution time, connection counts, cache hit ratios, replication lag, and resource utilization. They help identify slow queries, prevent bottlenecks, and optimize database performance through real-time monitoring and alerting.
What is the best PostgreSQL monitoring tool? The best PostgreSQL monitoring tool depends on requirements. pganalyze ($149/month) specializes in query optimization. Datadog ($85/month) offers enterprise observability. Uptrace and SigNoz provide free OpenTelemetry-based monitoring. Prometheus + Grafana works well for Kubernetes environments.
What are the key metrics to monitor in PostgreSQL? Key PostgreSQL metrics include query execution time, cache hit ratio (target >99%), active connections, transaction rate, replication lag, table bloat, vacuum activity, and resource usage (CPU, memory, disk I/O). Monitor pg_stat_statements for query-level insights and pg_stat_database for database-wide statistics.
How do you monitor PostgreSQL performance? Monitor PostgreSQL performance using pg_stat_statements for query metrics, pg_stat_activity for active connections, and monitoring tools like Uptrace, pganalyze, or Datadog. Track cache hit ratios, slow queries, connection pools, and replication lag. Set alerts for performance degradation and analyze trends over time.
Which tools offer query-level monitoring? pganalyze specializes in query-level analysis with explain plans and index recommendations ($149/month). SigNoz correlates queries with application traces. Datadog provides query samples and execution plans. New Relic integrates query performance with APM. pg_stat_statements extension offers free query-level statistics.
Are there free PostgreSQL monitoring tools? Yes, free PostgreSQL monitoring tools include Uptrace (open source), Prometheus + Grafana, pgAdmin, pgBadger, Percona PMM, and Zabbix. These tools require setup but provide comprehensive monitoring without licensing costs. pg_stat_statements extension is built into PostgreSQL for query monitoring. Compare monitoring platforms with Datadog vs Grafana and Datadog vs Prometheus, or explore top APM tools for broader application monitoring needs.