Prometheus Alternatives & Competitors: Open-Source & Commercial Options
Prometheus alternatives include open-source tools like Grafana Mimir and Thanos, commercial platforms like Datadog and Dynatrace, and specialized solutions for network monitoring and APM. Organizations seek alternatives due to Prometheus's scalability limitations with large deployments, lack of native long-term storage, and complexity managing distributed systems.
| Alternative | Type | Best For | Key Advantage |
|---|---|---|---|
| Grafana Mimir | Open-source | Large-scale metrics | Unlimited retention, PromQL compatible |
| Thanos | Open-source | Multi-cluster Prometheus | Global query view, S3 storage |
| VictoriaMetrics | Open-source | High cardinality | 20x compression, low resource usage |
| Uptrace | Open-source | Distributed tracing + APM | OpenTelemetry native, metrics + traces |
| Datadog | Commercial | Cloud-native apps | Full-stack observability, ML insights |
| AWS Managed Prometheus | Managed | Enterprise AWS workloads | Zero ops, auto-scaling, pay-per-use |
Why consider Prometheus alternatives: While Prometheus excels at real-time metrics collection in Kubernetes environments, its limitations become apparent at enterprise scale. Organizations handling hundreds of gigabytes of metrics daily face storage costs, query performance issues, and operational complexity managing multiple Prometheus instances across regions.
Prometheus Strengths and Limitations
Prometheus excels at real-time metrics collection but has scalability constraints that drive organizations toward alternatives.
Key Features of Prometheus
| Feature | Description |
|---|---|
| Pull-Based Collection | Scrapes metrics from instrumented targets at regular intervals |
| PromQL | Powerful query language for aggregating and analyzing time-series data |
| Built-In Alerting | Native alerting rules with Alertmanager integration |
| Service Discovery | Automatic detection of targets in Kubernetes, Consul, EC2, and more |
| Multi-Dimensional Data | Labels enable flexible querying and aggregation across dimensions |
Common Use Cases
Prometheus excels at monitoring containerized environments like Kubernetes clusters, where its service discovery automatically finds pods and services as they scale up or down. The multi-dimensional data model makes it ideal for microservices architectures, where you need to track metrics across hundreds of services, versions, and instances. For cloud-native applications built with dynamic infrastructure, Prometheus's pull-based model and powerful querying capabilities provide real-time visibility into application performance.
Challenges and Limitations
Scalability Limitations: Prometheus stores all data locally on disk, making it difficult to scale beyond a single server. Organizations with hundreds of thousands of metrics per second often hit storage and query performance limits, requiring complex federation setups or third-party solutions like Thanos.
No Long-Term Storage: By default, Prometheus retains data for 15 days. While you can increase retention, local disk storage becomes expensive and unreliable for months or years of historical data. This limitation forces many organizations to seek alternatives with better long-term retention capabilities.
Single Point of Failure: Standard Prometheus deployments lack native high availability. If your Prometheus server goes down, you lose monitoring visibility and potentially lose metrics data. Building redundancy requires running multiple Prometheus instances and managing data consistency.
Steep Learning Curve: PromQL's powerful query language requires significant time to master. Complex queries involving rate calculations, aggregations, and multi-level grouping often confuse newcomers, increasing the time needed to extract valuable insights from metrics data.
Is Prometheus Open Source?
Yes, Prometheus is completely open-source and free to use. Released under the Apache 2.0 license, Prometheus is a Cloud Native Computing Foundation (CNCF) graduated project, which means it meets the highest standards for production-ready open-source software. The entire codebase is publicly available on GitHub, and you can deploy, modify, and distribute it without licensing fees.
What "open source" means for Prometheus users:
| Aspect | Details |
|---|---|
| License | Apache 2.0 - permissive, commercial-friendly |
| Cost | Free to download, deploy, and use |
| Source Code | Publicly available on GitHub |
| Community | Active development, 1,000+ contributors |
| Commercial Support | Available from third-party vendors |
| Modifications | Fully permitted, can fork and customize |
Managed Prometheus alternatives: While Prometheus itself is free, many organizations opt for managed services that handle the operational complexity. Cloud providers offer managed Prometheus-compatible services like Amazon Managed Service for Prometheus, Google Cloud Managed Service for Prometheus, and Azure Monitor managed Prometheus. These services charge based on usage but eliminate infrastructure management overhead.
Open-source vs commercial alternatives: Some Prometheus alternatives are also open-source (Thanos, Grafana Mimir, VictoriaMetrics), while others are commercial products (Datadog, Dynatrace). Open-source options provide cost savings but require more operational expertise, while commercial solutions offer support and managed services at a subscription cost.
Choosing Prometheus Alternatives
| Factor | Why It Matters | Questions to Ask |
|---|---|---|
| Scalability | Handle growing metric volumes without performance degradation | Can it handle millions of metrics per second? Does it scale horizontally? |
| Long-Term Storage | Retain historical data for compliance and trend analysis | What's the retention period? Storage costs at scale? |
| Ease of Use | Reduce time to value and training overhead | How complex is initial setup? Learning curve for queries? |
| Integration | Connect with existing tools and workflows | Grafana compatible? OpenTelemetry support? API availability? |
| Alerting | Catch issues before they impact users | Rule configuration complexity? Multi-channel notifications? |
| Cost | Manage monitoring expenses predictably | Open-source vs commercial? Infrastructure costs? Per-metric pricing? |
Top Prometheus Alternatives
Let's explore some of the leading prometheus alternatives in the market. These monitoring tools similar to Prometheus offer various features and capabilities that may better suit your organization's needs.
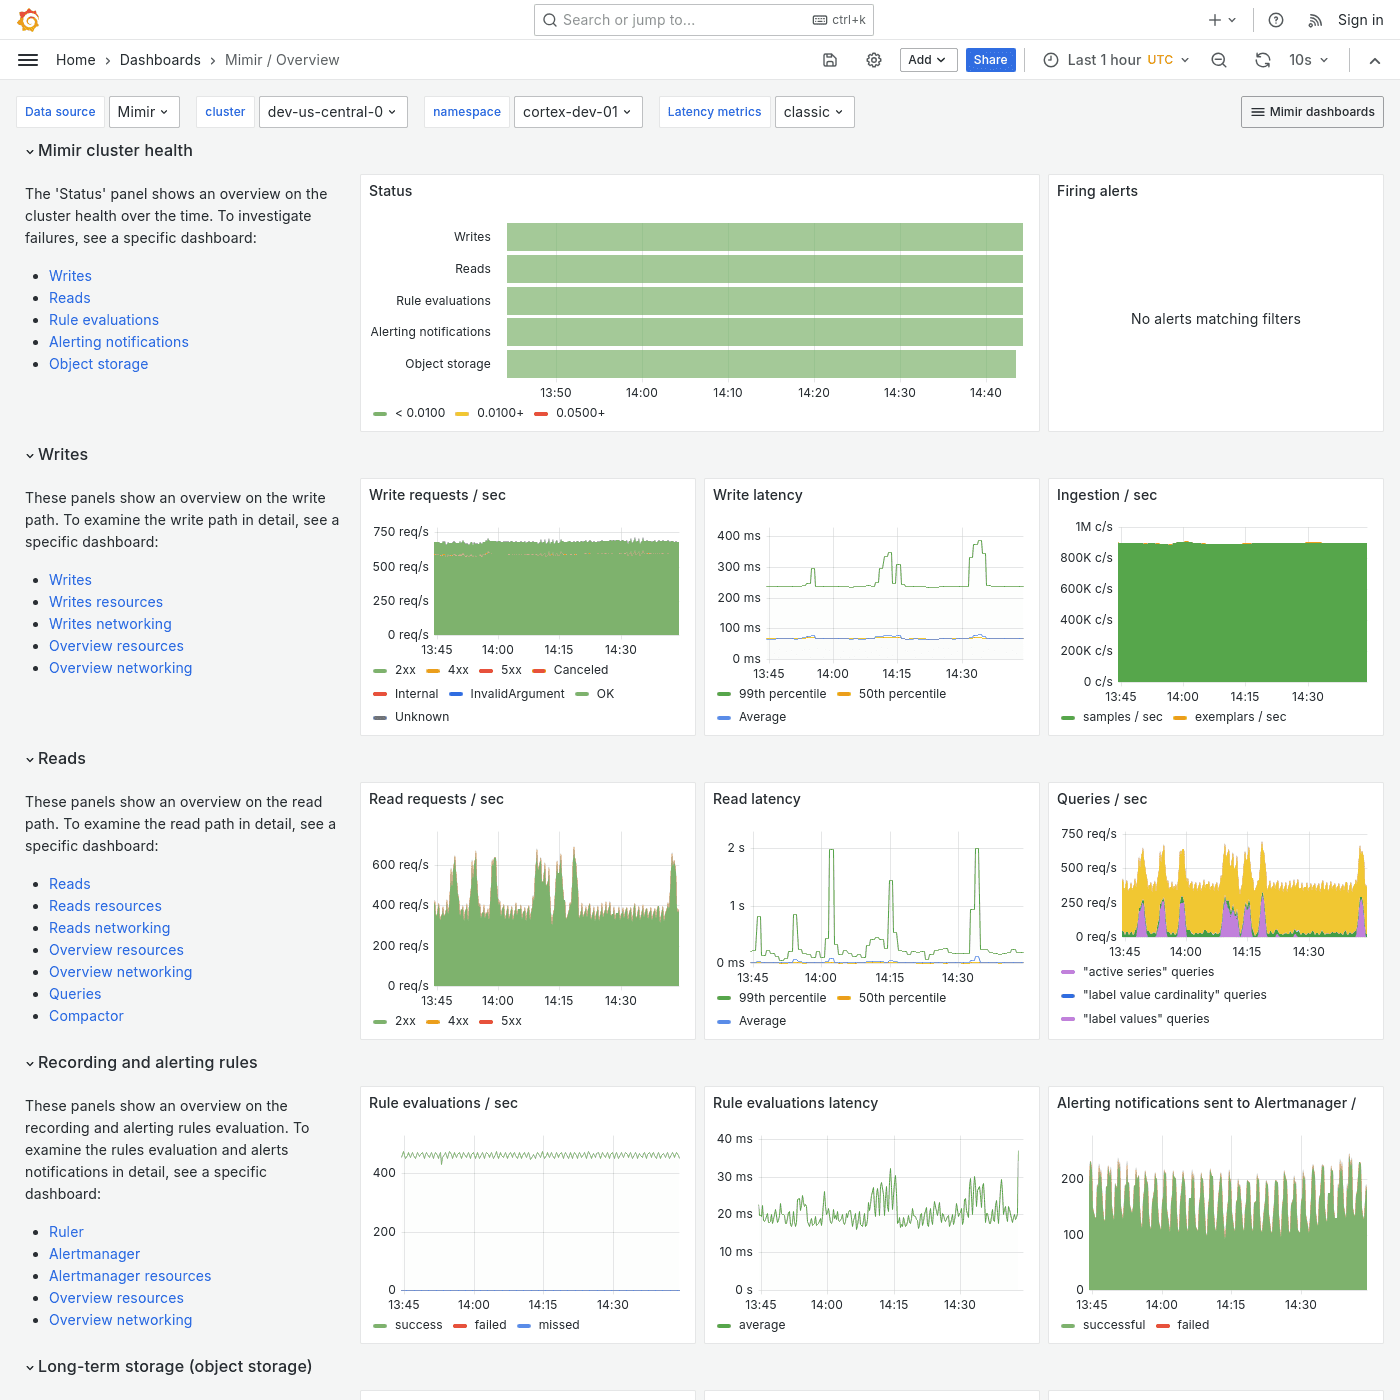
Grafana Mimir
Grafana Mimir is an open-source, horizontally scalable Prometheus alternative designed for long-term storage of metrics at massive scale.
| Aspect | Details |
|---|---|
| Type | Open-source time-series database |
| Scalability | Horizontally scalable to billions of metrics |
| Query Language | PromQL compatible (drop-in replacement) |
| Storage | Unlimited retention with object storage (S3, GCS) |
| Multi-Tenancy | Built-in support for isolated tenants |
| High Availability | Automatic replication and failover |
| Best For | Large enterprises, global deployments, long-term retention |
| Pros | Seamless Grafana integration, backward compatible with Prometheus |
| Cons | Higher resource requirements, newer project still evolving |
InfluxDB
InfluxDB is a purpose-built time-series database that serves as a powerful prometheus alternative.
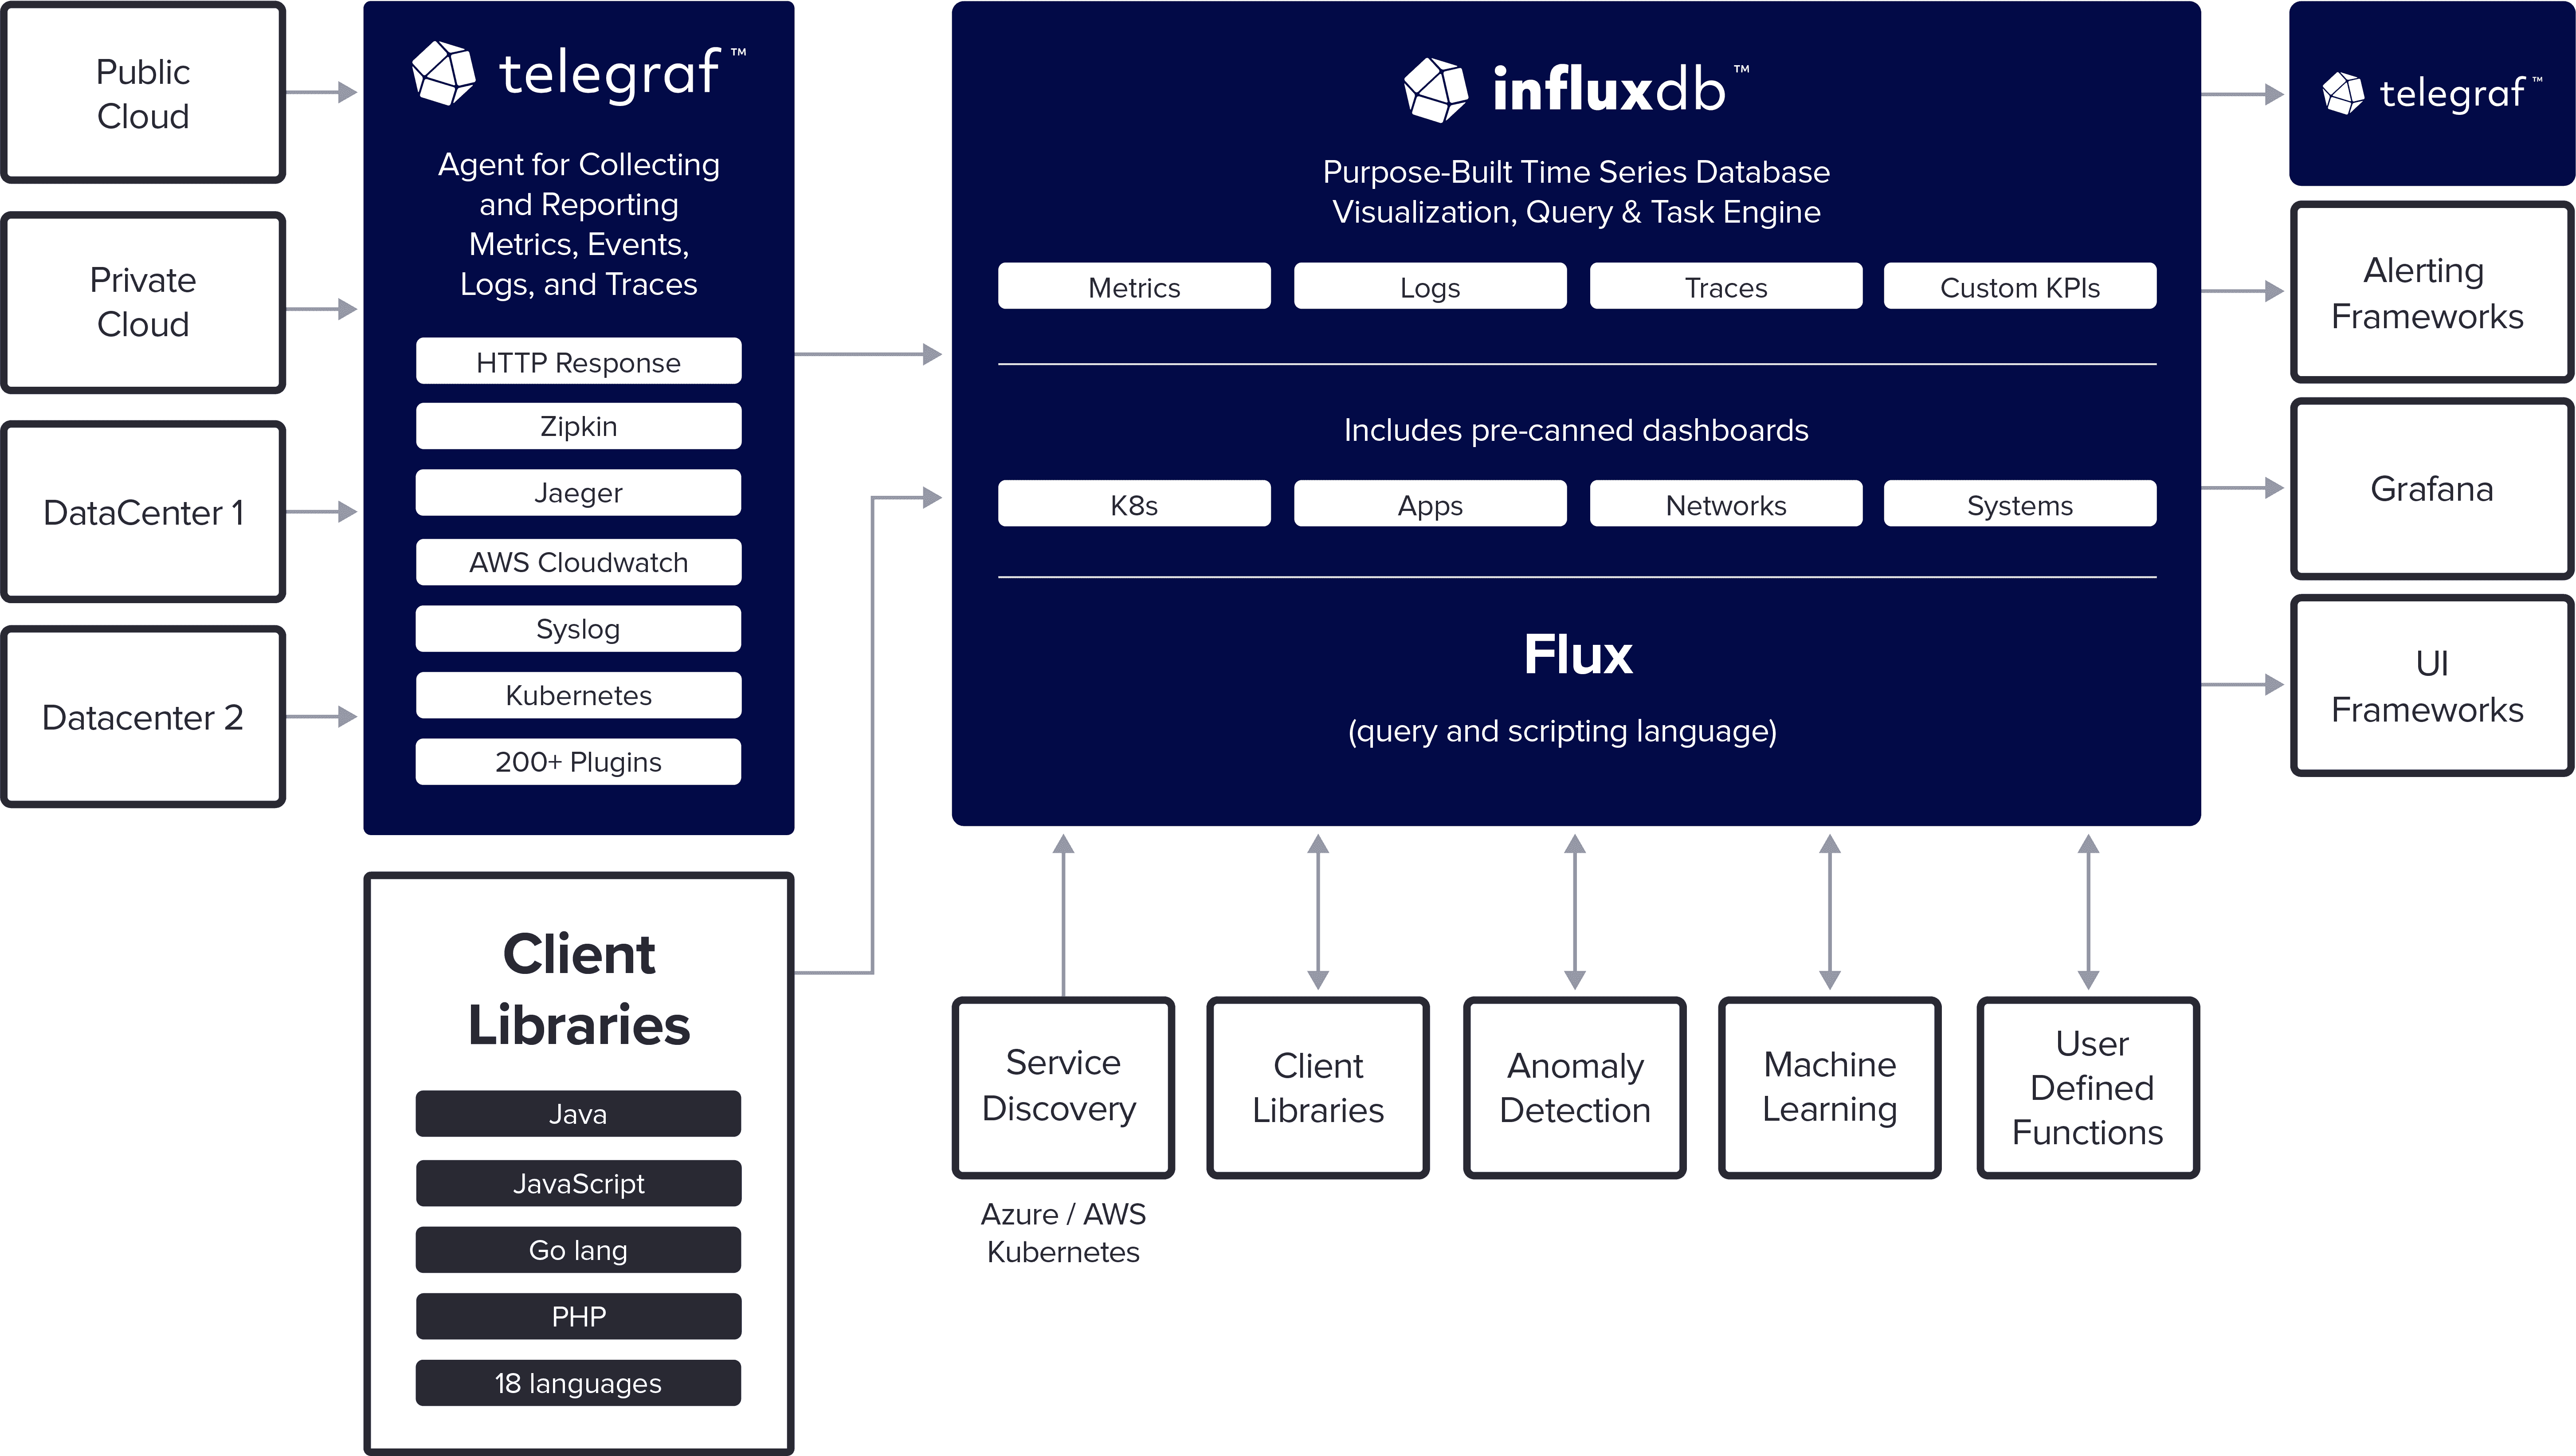
Time-series Database Capabilities:
- High write and query performance
- Flexible data retention policies
- Continuous queries for real-time data processing
Advantages over Prometheus:
- Better long-term storage capabilities
- More robust querying language (Flux)
- Native support for multiple data types (metrics, events, logs)
Potential Drawbacks:
- Steeper learning curve for Flux query language
- Limited free tier features in the cloud offering
Datadog
Datadog is a comprehensive cloud-native monitoring solution that can serve as a full-featured prometheus alternative.
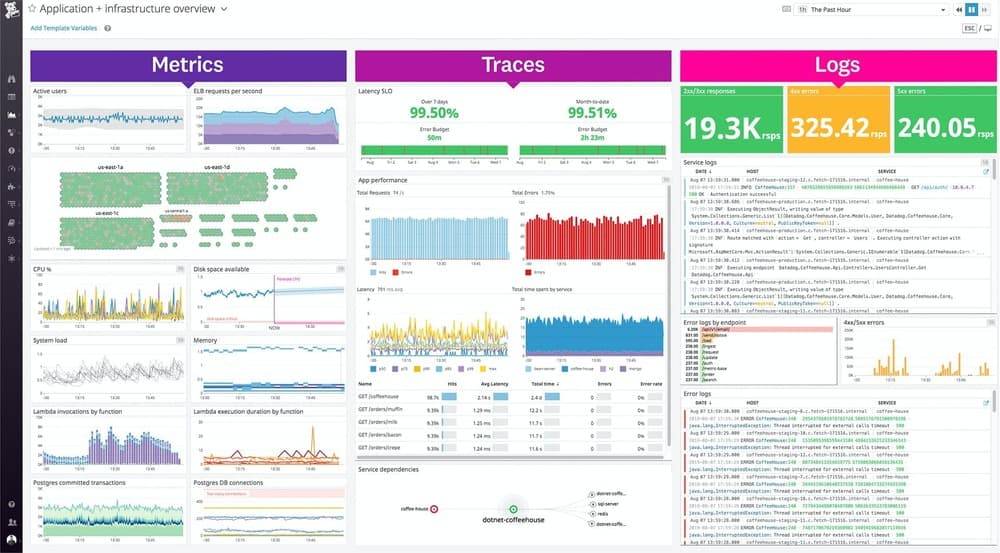
Feature Comparison with Prometheus:
| Feature | Datadog | Prometheus |
|---|---|---|
| Data Collection | Agent-based & cloud integrations | Pull-based scraping |
| Visualization | Built-in dashboards | Requires Grafana or similar |
| Alerting | Advanced alerting & anomaly detection | Basic alerting |
| APM | Integrated | Requires additional tools |
| ML-powered insights | Yes | No |
Pricing Considerations:
- Datadog uses a per-host or per-metric pricing model
- Can be more expensive for large-scale deployments
- Offers a free tier with limited features
Open-Source Prometheus Alternatives
For organizations looking for open-source prometheus alternatives, consider these options:
Thanos
Thanos is a set of components that can be added to an existing Prometheus deployment to enable long-term storage and global query view.
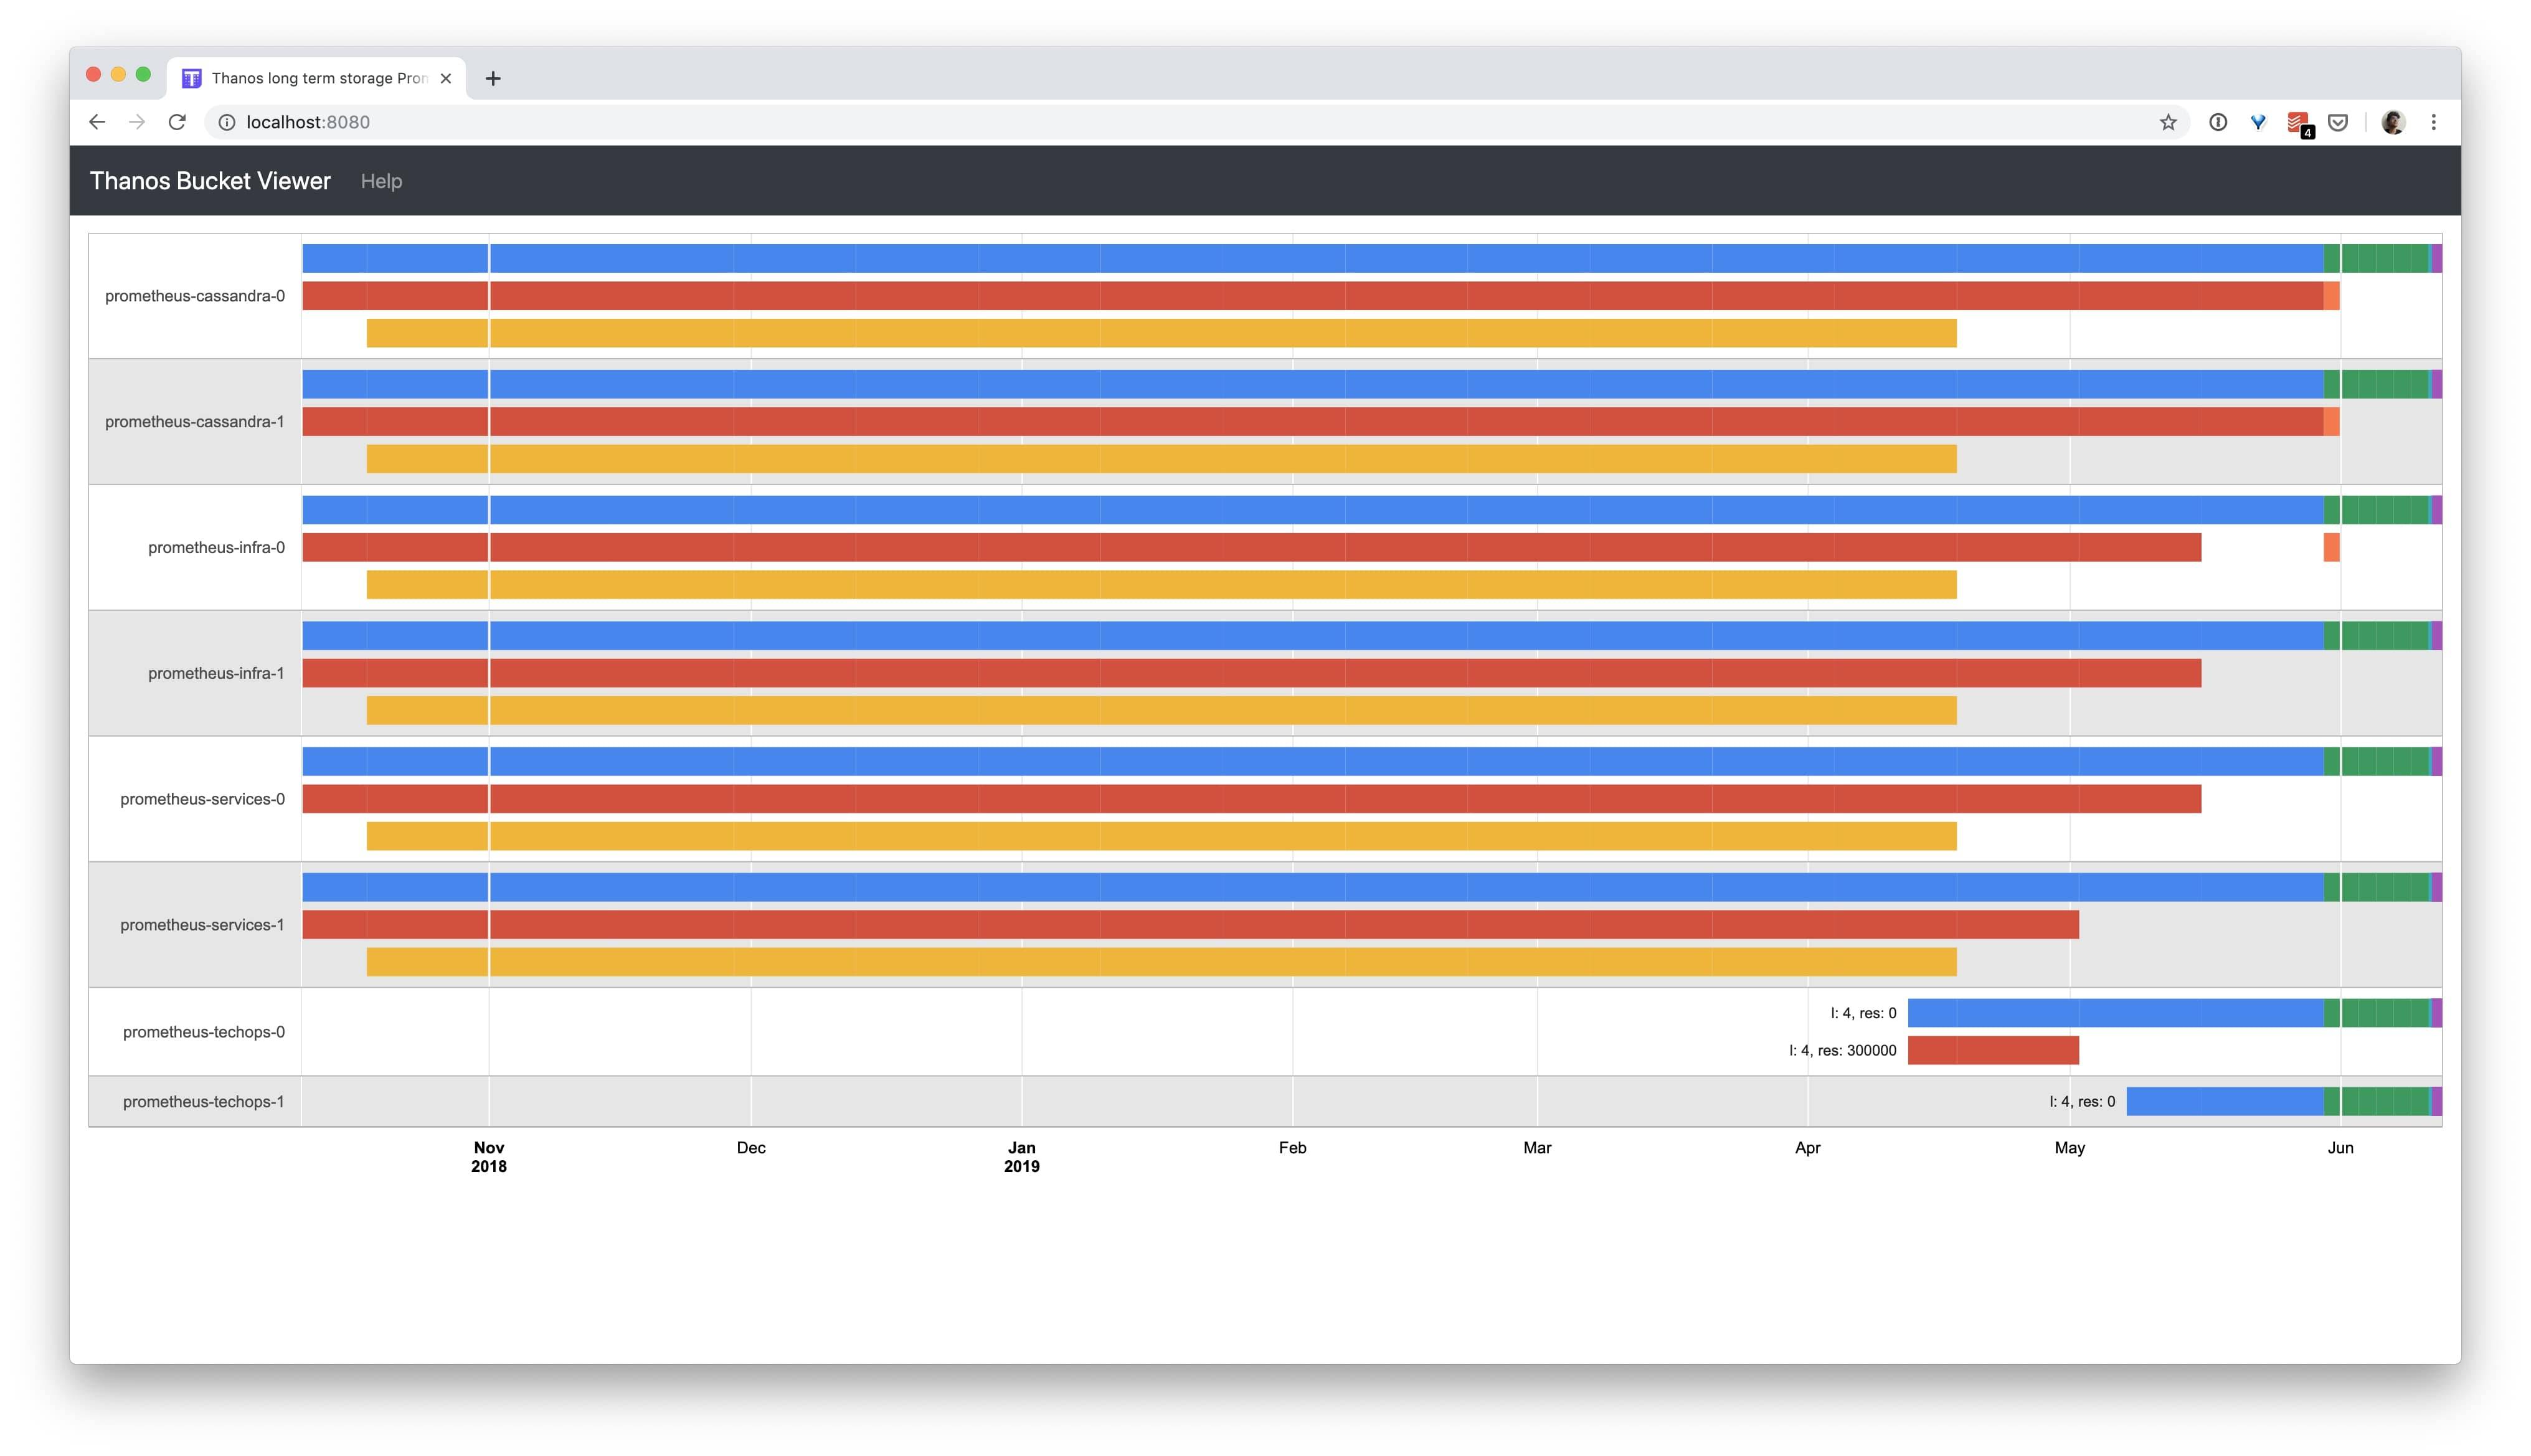
Key Features:
- Global query view across multiple Prometheus instances
- Long-term storage in object storage (e.g., S3, GCS)
- Downsampling and compaction of historical data
Cortex
Cortex is a horizontally scalable, highly available, multi-tenant prometheus alternative.
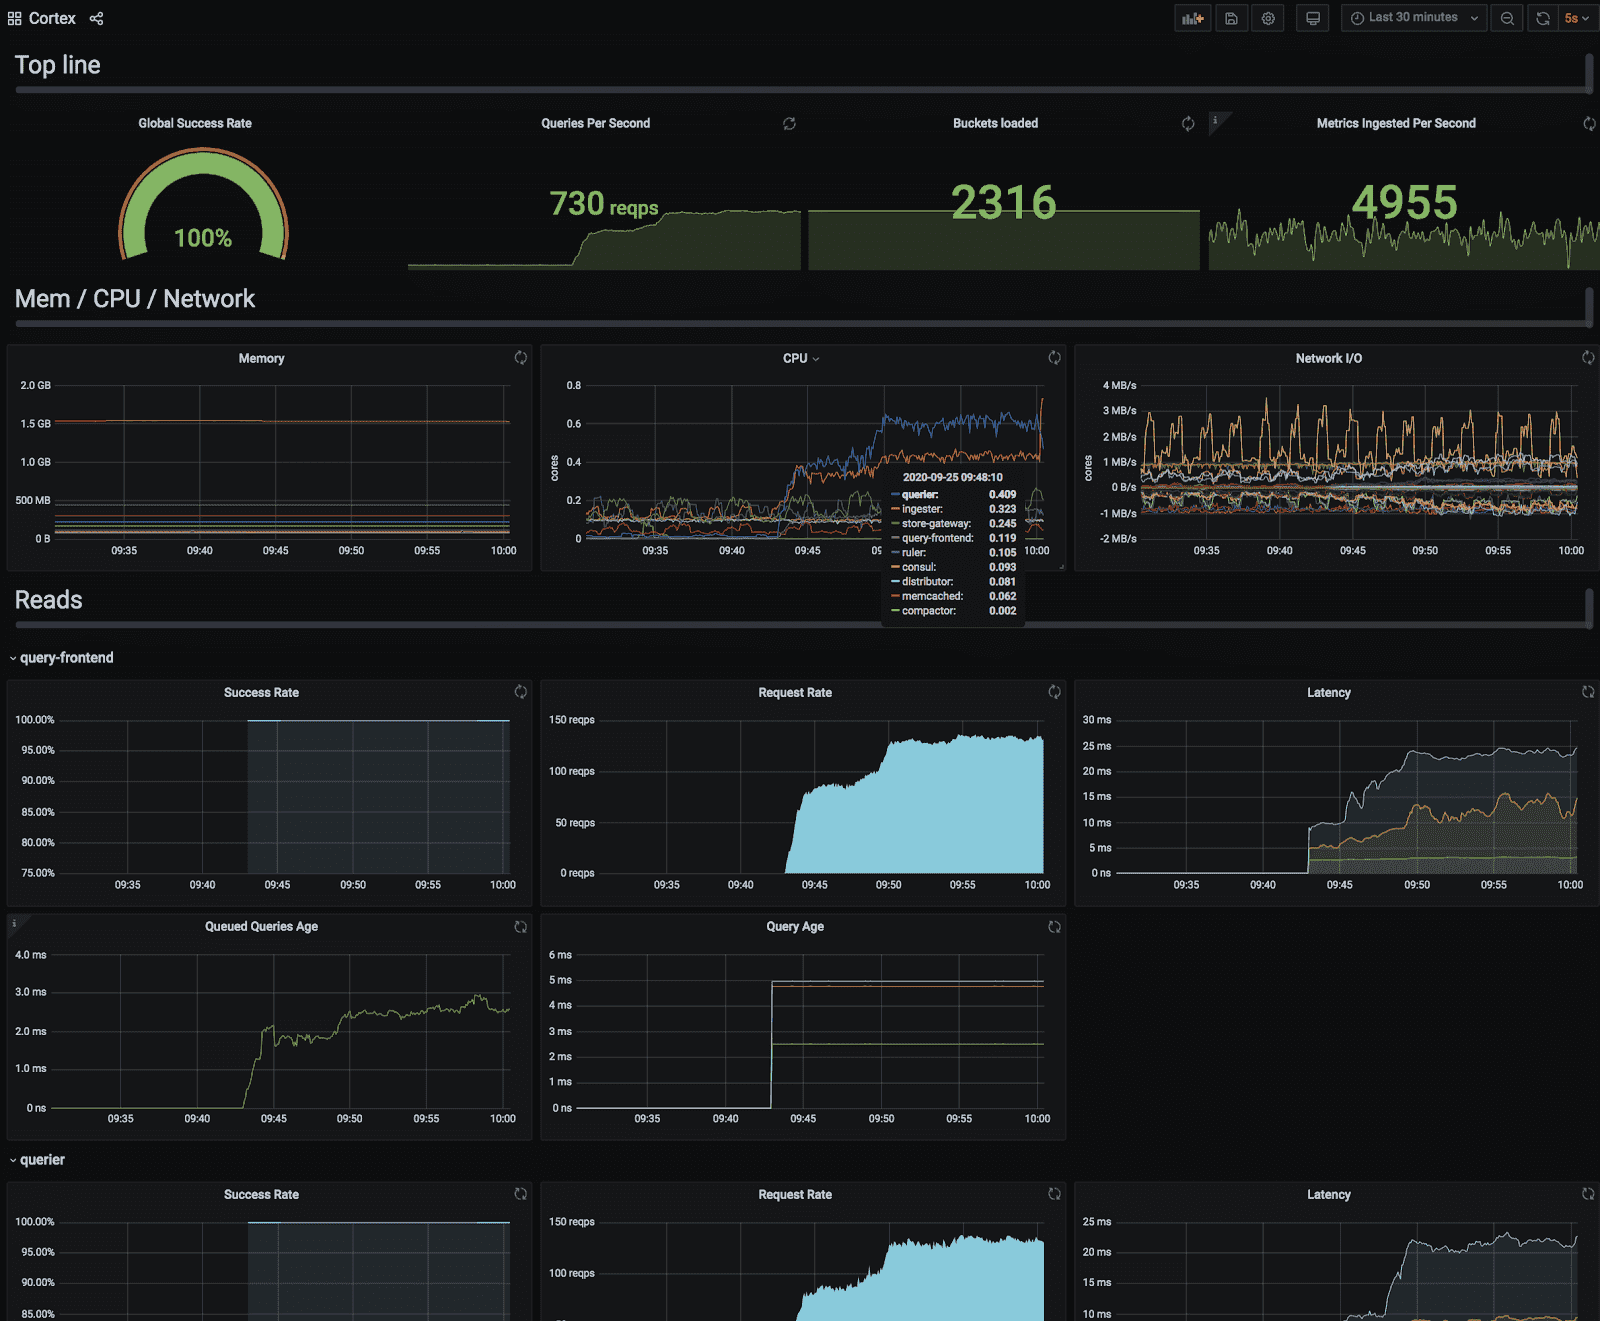
Key Features:
- Multi-tenancy support
- Long-term storage with various backend options
- Compatible with Prometheus ecosystem (PromQL, Grafana)
Uptrace
Uptrace is an open-source APM platform that can serve as a prometheus alternative, especially for distributed tracing and metrics.
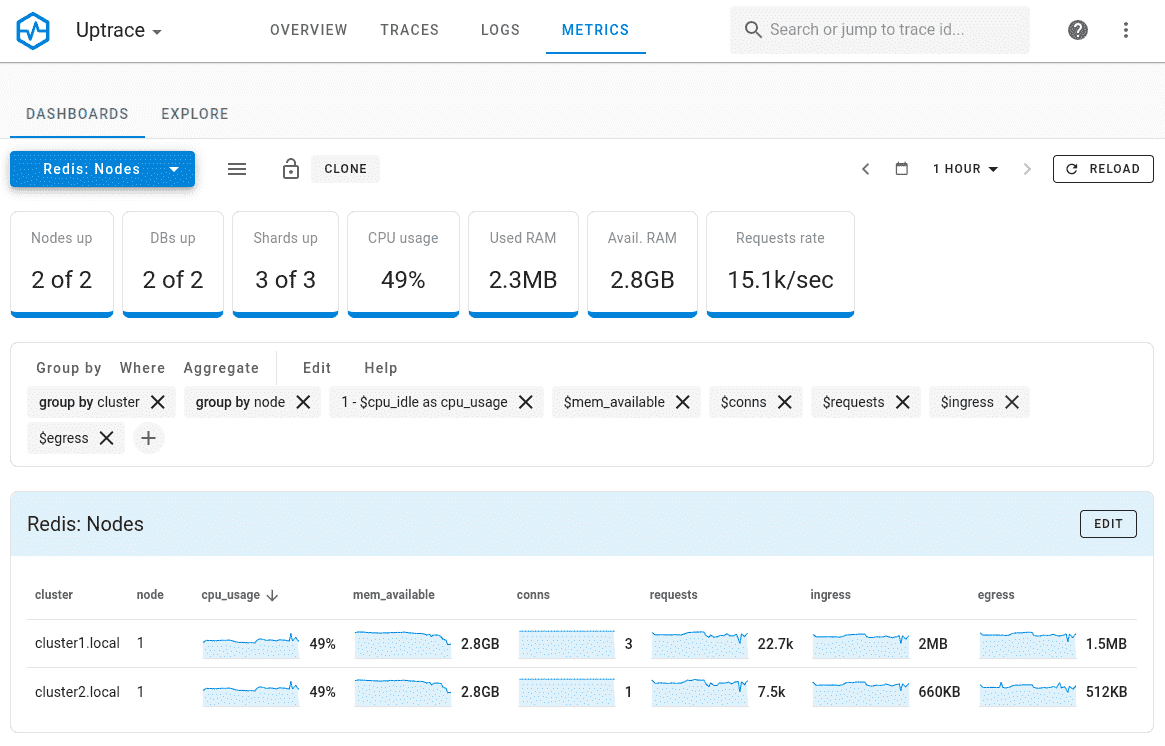
Key Features:
- Distributed tracing with OpenTelemetry
- Metrics collection and visualization
- Logs correlation with traces and metrics
Cloud-Native Monitoring Solutions
For organizations heavily invested in cloud infrastructure, these prometheus alternatives from major cloud providers are worth considering:
These solutions offer deep integration with their respective cloud platforms, providing:
- Native support for cloud resource monitoring
- Integrated logging and metrics
- Built-in alerting and notification systems
Comparison with Prometheus for Cloud Environments:
| Aspect | Prometheus | Cloud-Native Solutions |
|---|---|---|
| Setup | Manual setup required | Often auto-configured |
| Cloud Integration | Requires exporters | Native integration |
| Scalability | Limited without add-ons | Highly scalable |
| Cost | Free, infrastructure costs | Usage-based pricing |
Managed Prometheus Services
Organizations seeking Prometheus-compatible monitoring without operational overhead can choose managed services that provide enterprise-grade support, SLAs, and automatic scaling.
Cloud Provider Managed Services
Amazon Managed Service for Prometheus (AMP)
AWS's fully managed Prometheus-compatible service integrates seamlessly with Amazon EKS, ECS, and Lambda. AMP automatically scales to handle billions of metrics, uses tiered pricing based on samples ingested and queried, and eliminates infrastructure management. Enterprise support includes 24/7 technical assistance, compliance certifications (SOC, PCI-DSS, HIPAA), and integration with AWS security services.
Google Cloud Managed Service for Prometheus
Google's managed offering provides native integration with GKE and Google Cloud monitoring. It uses the same PromQL query language and supports Grafana visualization while handling storage, retention, and high availability automatically. Uses progressive per-sample pricing with volume discounts, and enterprise support includes dedicated technical account managers and custom SLAs.
Azure Monitor managed Prometheus
Microsoft's service integrates tightly with Azure Kubernetes Service and Azure Arc, providing unified monitoring across hybrid environments. It includes built-in Grafana dashboards, automatic workspace management, and compliance with enterprise security standards. Enterprise support encompasses 24/7 incident response and integration with Azure Active Directory for authentication.
Commercial Prometheus-Compatible Platforms
| Provider | Key Features | Enterprise Support | Pricing Model |
|---|---|---|---|
| Grafana Cloud | Hosted Mimir, unlimited retention, global deployment | 24/7 support, SLAs, dedicated success team | From $19/month + usage, Enterprise $25k+/year |
| Chronosphere | Multi-tenant, usage-based pricing, query optimization | Technical account manager, custom SLAs | Custom enterprise pricing |
| Datadog | Full observability stack, ML anomaly detection | Premium support, training, professional services | $15/host/month + metrics costs |
| New Relic | APM + infrastructure, unlimited users | Dedicated support engineer, custom onboarding | From $49/month, usage-based |
Why choose managed alternatives:
- Zero operational overhead: No server management, patching, or scaling required
- Enterprise SLAs: Guaranteed uptime (typically 99.9%+) with financial penalties for violations
- Automatic scaling: Handle traffic spikes without manual intervention
- Security and compliance: SOC 2, ISO 27001, GDPR compliance built-in
- Expert support: 24/7 access to specialists who understand Prometheus internals
Trade-offs to consider:
Managed services cost more than self-hosted Prometheus but eliminate operational complexity. Organizations save on infrastructure costs, engineering time, and reduce risk of data loss. For teams without dedicated monitoring expertise, the premium typically justifies itself through reduced downtime and faster incident resolution.
Prometheus vs PRTG
Prometheus and PRTG serve different monitoring needs, making the choice dependent on your infrastructure type and team expertise.
| Feature | Prometheus | PRTG |
|---|---|---|
| Primary Focus | Application & container metrics | Network devices & infrastructure |
| Architecture | Pull-based, time-series database | Agent-based with central server |
| Setup Complexity | Moderate, requires configuration | Easy, auto-discovery with GUI |
| Best For | Kubernetes, microservices, cloud-native | Routers, switches, traditional IT infrastructure |
| Query Language | PromQL (powerful but complex) | Visual interface, no query language needed |
| Alerting | Basic, requires Alertmanager | Advanced with escalations and dependencies |
| Pricing | Free, open-source | Subscription-based, from $3,200/year (1,000 sensors) |
| Learning Curve | Steep for complex scenarios | Gentle, GUI-driven |
| Network Monitoring | Limited, requires exporters | Native support for SNMP, NetFlow, packet sniffing |
| Container Monitoring | Excellent native support | Limited, requires custom sensors |
When to choose Prometheus:
- Monitoring containerized applications and microservices
- Cloud-native infrastructure with dynamic service discovery
- Teams comfortable with code-based configuration
- Need for custom metrics and complex queries
- Budget constraints (open-source)
When to choose PRTG:
- Traditional network infrastructure (routers, switches, firewalls)
- Teams preferring GUI-based management
- Need comprehensive out-of-box sensors
- Requirement for advanced alerting with escalations
- Windows-centric environments
Hybrid approach: Many organizations use both - Prometheus for application/container metrics and PRTG for network infrastructure monitoring. This combination provides comprehensive visibility across the entire technology stack.
Conclusion
Prometheus alternatives range from open-source solutions like Grafana Mimir and Thanos to commercial platforms like Datadog and managed services from AWS, Google Cloud, and Azure. Choose based on your scalability needs, budget, and operational expertise.
For organizations needing unlimited retention and horizontal scaling, Grafana Mimir or managed Prometheus services eliminate infrastructure complexity. VictoriaMetrics offers the best compression and cost efficiency. For traditional network infrastructure, PRTG provides better out-of-box support than Prometheus.
The right alternative depends on your specific use case: cloud-native applications benefit from managed services, multi-cluster deployments need Thanos or Mimir, and cost-sensitive teams should evaluate VictoriaMetrics or self-hosted Thanos.
FAQ
What are the main limitations of Prometheus that drive users to seek alternatives? Prometheus has several limitations including scalability issues with large deployments (local storage bottleneck), limited long-term data retention (default 15 days), lack of native distributed system support requiring federation, and steep learning curve for complex PromQL queries.
Is Prometheus open source? Yes, Prometheus is completely open-source under the Apache 2.0 license. It's a CNCF graduated project with 1,000+ contributors, publicly available source code on GitHub, and free to download, deploy, and modify without licensing fees.
What are the best Prometheus competitors? Top Prometheus competitors include Grafana Mimir (open-source, unlimited retention), Thanos (multi-cluster support), Datadog (commercial, full observability), InfluxDB (time-series database), VictoriaMetrics (high compression), and managed services like Amazon Managed Prometheus.
Which alternative is best for enterprise-scale deployments? Grafana Mimir and Cortex excel at enterprise scale with horizontal scalability to billions of metrics, multi-tenancy support, and object storage for long-term retention. Managed services like Amazon Managed Prometheus or Grafana Cloud eliminate operational overhead for enterprises.
Prometheus vs PRTG: which is better? Prometheus excels at monitoring cloud-native applications, Kubernetes, and microservices with its pull-based architecture and PromQL queries. PRTG is better for traditional network infrastructure (routers, switches) with GUI-based management, 250+ pre-configured sensors, and easier setup for network-focused teams.
Thanos vs Mimir: which should I choose? Thanos extends existing Prometheus deployments with global query view and S3 storage, ideal for organizations already using Prometheus. Mimir offers better performance and simpler architecture but requires more infrastructure changes. Choose Thanos for gradual migration, Mimir for greenfield deployments.
VictoriaMetrics vs Prometheus comparison? VictoriaMetrics provides 20x better compression, lower resource usage, and better performance at high cardinality compared to Prometheus. It's PromQL-compatible, offers longer retention at lower cost, but requires replacing your entire Prometheus infrastructure rather than extending it.
What are managed Prometheus alternatives with enterprise support? Managed options include Amazon Managed Service for Prometheus (usage-based), Google Cloud Managed Prometheus (tiered pricing), Azure Monitor Prometheus, Grafana Cloud (from $19/month), and commercial platforms like Chronosphere, Datadog ($15/host/month), and New Relic (from $49/month) with 24/7 support and SLAs.
How do open-source alternatives compare to commercial solutions? Open-source alternatives (Thanos, Mimir, VictoriaMetrics) have no licensing costs but require operational expertise for setup and maintenance. Commercial solutions (Datadog, Dynatrace) provide out-of-box functionality, support, and managed services but charge subscription fees typically starting at $15-100/month per host.
Can Prometheus be used for network monitoring? Prometheus can monitor networks using SNMP Exporter and Blackbox Exporter, but it's not optimized for traditional network infrastructure. For comprehensive network monitoring including SNMP, NetFlow, and packet analysis, PRTG is better suited for network-focused teams.
Which alternative is best for cloud-native applications? For single cloud, use native managed services (Amazon Managed Prometheus, Google Cloud Managed Prometheus, Azure Monitor) for tight integration. For multi-cloud, Datadog provides consistent monitoring across providers. For open-source preference, Grafana Mimir with OpenTelemetry integration works across any cloud.
What are Prometheus scalability limitations? Prometheus stores data locally limiting vertical scaling to single server resources. Organizations hitting 100,000+ active time series or retaining data beyond months face storage and query performance issues. Solutions include federation (complex), Thanos/Mimir (horizontal scaling), or switching to purpose-built time-series databases.
Best Prometheus alternative for long-term storage? Grafana Mimir and Thanos specifically solve long-term storage using object storage (S3, GCS) for unlimited retention at low cost. InfluxDB offers 10+ year retention natively. Managed services like Amazon Managed Prometheus handle retention automatically without infrastructure management.