Top 10 Observability Tools in 2025
The observability tools market is projected to reach $62.9 billion by 2025, with Datadog commanding 51.82% market share in data center management and New Relic holding 24% in system administration. But which tool is right for your team?
This guide compares the top 10 observability platforms based on market share, user reviews, pricing, and real-world performance to help you make an informed decision.
What is Observability?
Observability gives you the ability to understand what's happening inside your systems by examining their outputs. Unlike traditional monitoring that tells you when something breaks, observability helps you understand why it broke and how to prevent it from happening again.
Observability platforms collect three types of data: metrics (performance numbers), logs (event records), and traces (request flows), then correlate them to provide complete system visibility. This is essential for teams managing complex, distributed applications where traditional monitoring falls short.
For a comprehensive understanding of observability see our detailed guide to observability.
Observability Tools vs Platforms
Observability Tools focus on specific functions like log analysis or metrics collection. Examples include Prometheus (metrics) or Jaeger (tracing).
Observability Platforms provide comprehensive, integrated solutions that combine multiple data types and analysis capabilities. Most organizations prefer platforms for unified visibility and reduced tool sprawl.
Top 10 Observability Tools Market Analysis
| Tool | Market Share | Customers | Starting Price | Best For |
|---|---|---|---|---|
| Datadog | 51.82% | 47,431+ | $15/host/month | Enterprise |
| New Relic | 24.00% | 175,839+ | $99/month | Mid-market |
| Grafana | 4.03% | 26,550+ | Free/Open Source | Visualization |
| Dynatrace | 3.38% | 10,675+ | Custom pricing | AI-powered |
| Prometheus | 2.43% | 7,528+ | Free/Open Source | Cloud-native |
| Uptrace | Growing | 3,000+ | $30/month | Cost-conscious |
| Splunk | 1.82% | 14,885+ | Custom pricing | Security-focused |
| Elastic | 1.20% | 5,000+ | $95/month | Search-heavy |
| Honeycomb | 0.8% | 2,500+ | $100/month | High-cardinality |
| AppDynamics | 1.46% | 6,500+ | Custom pricing | Business context |
Enterprise Leaders
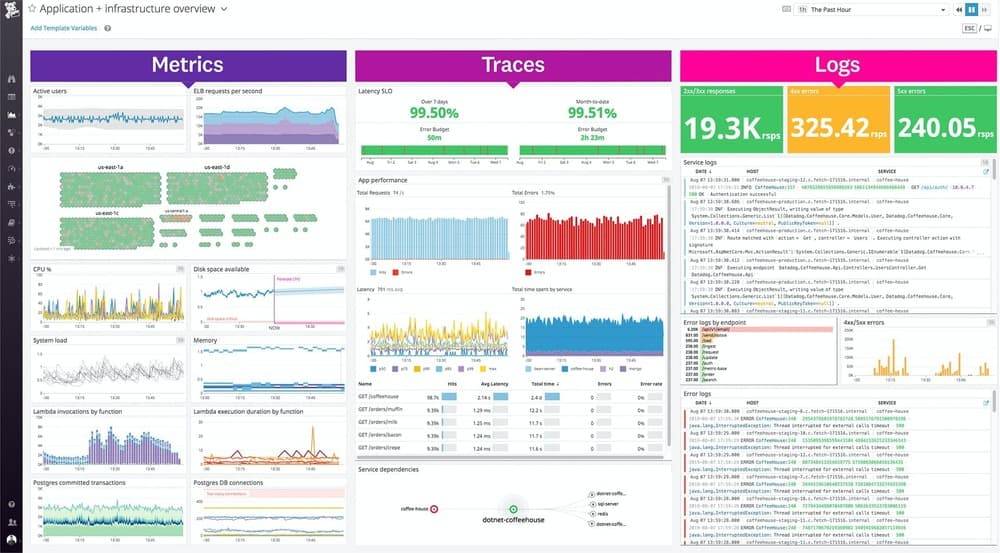
Datadog
Market Position: Dominant market leader with 51.82% share
Strengths:
- Most comprehensive integration ecosystem (450+ technologies)
- Strong AI/ML capabilities for anomaly detection
- Excellent user experience and visualization
- Robust enterprise features and support
Weaknesses:
- High cost at scale (can exceed $50K+ annually for large deployments)
- Complex pricing model with multiple variables
- Vendor lock-in concerns
Best For: Large enterprises with complex, multi-cloud environments
Pricing: $15-$23/host/month, scales significantly with features
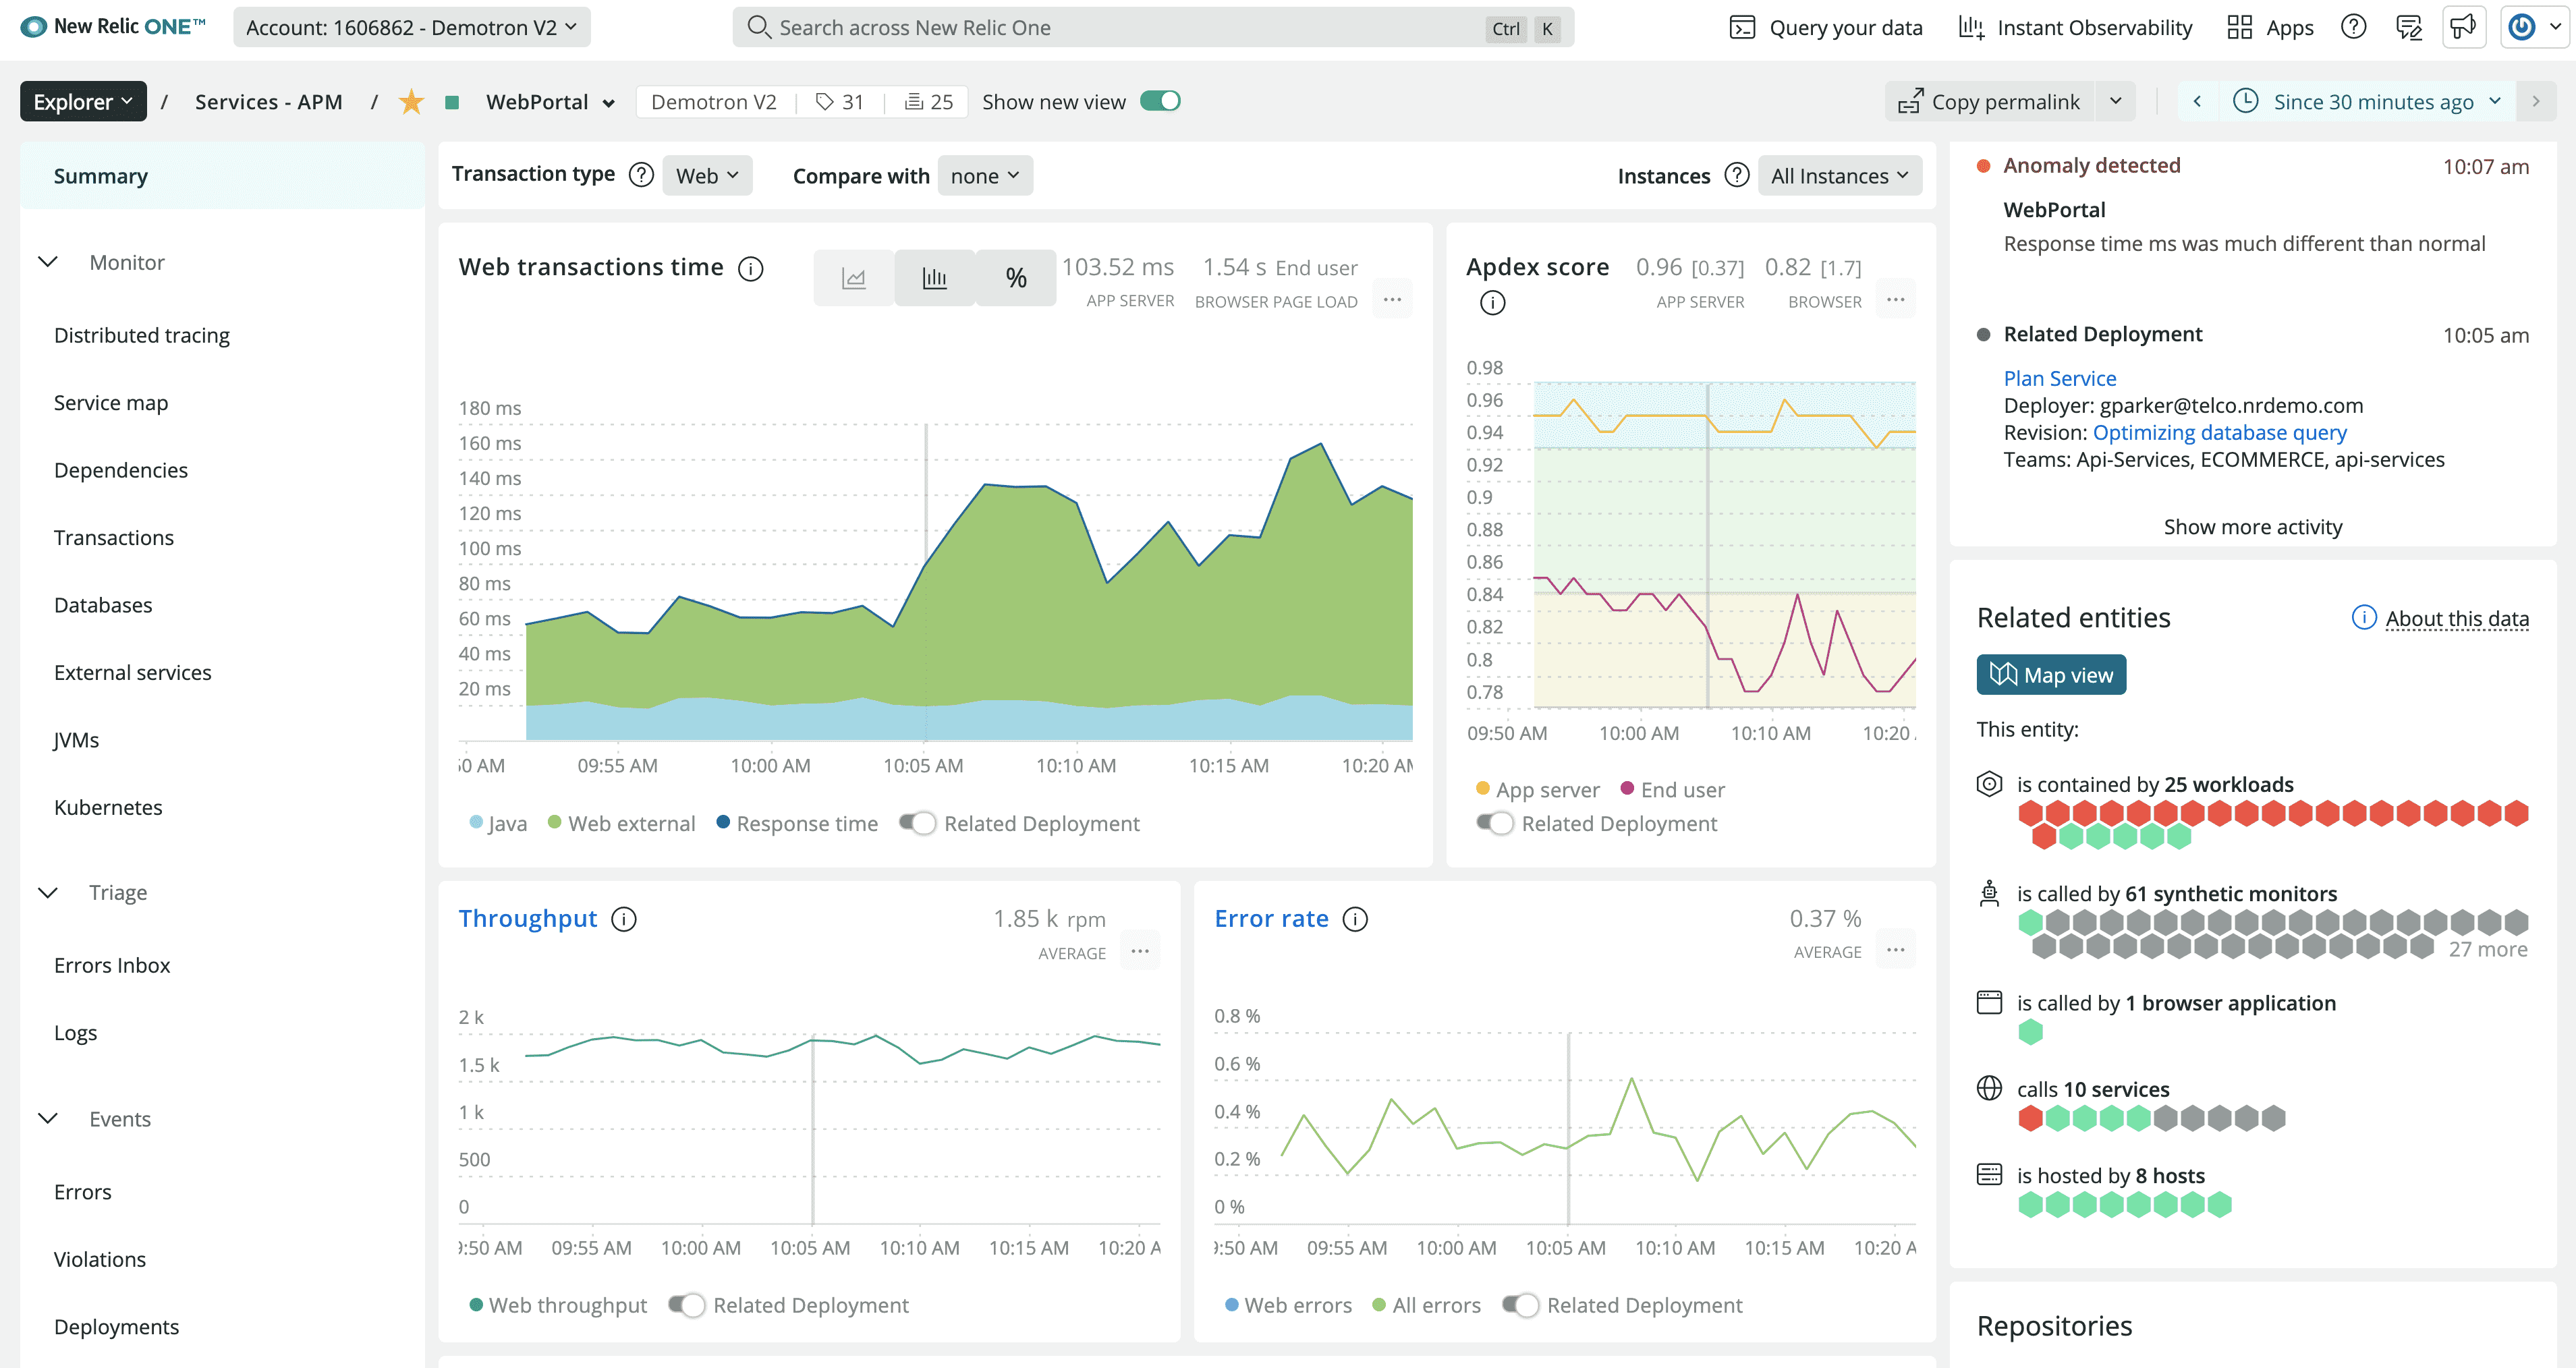
New Relic
Market Position: Strong second with 24% market share, 175,839+ customers
Strengths:
- Generous free tier (100GB/month)
- Strong developer community and documentation
- Good balance of features and usability
- Transparent, usage-based pricing
Weaknesses:
- Can become expensive with high data volumes
- Less comprehensive than Datadog for infrastructure monitoring
- Limited customization options
Best For: Growing companies needing scalable observability
Pricing: Free tier available, paid plans from $99/month
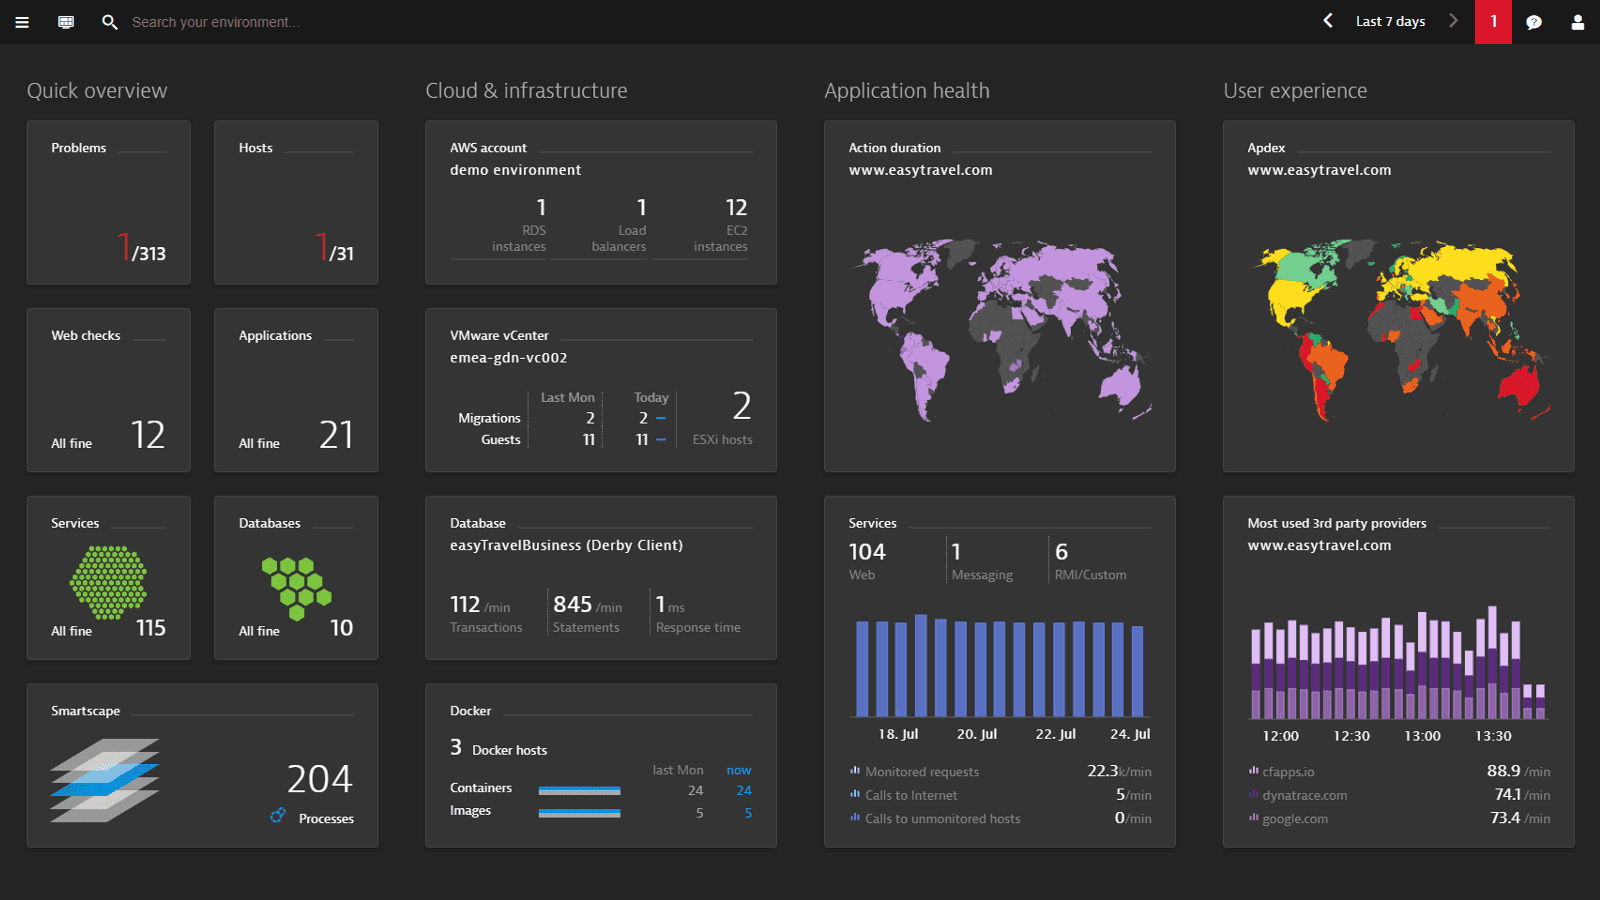
Dynatrace
Market Position: Premium AI-first platform, 3.38% market share
Strengths:
- Industry-leading AI (Davis) for root cause analysis
- Automatic instrumentation with minimal configuration
- Strong enterprise security and compliance features
- Excellent performance in complex environments
Weaknesses:
- Premium pricing (often $100K+ for enterprise deals)
- Steep learning curve for advanced features
- Limited flexibility for custom use cases
Best For: Large enterprises prioritizing automation and AI insights
Pricing: Custom enterprise pricing, typically starts at $69/host/month
Open Source
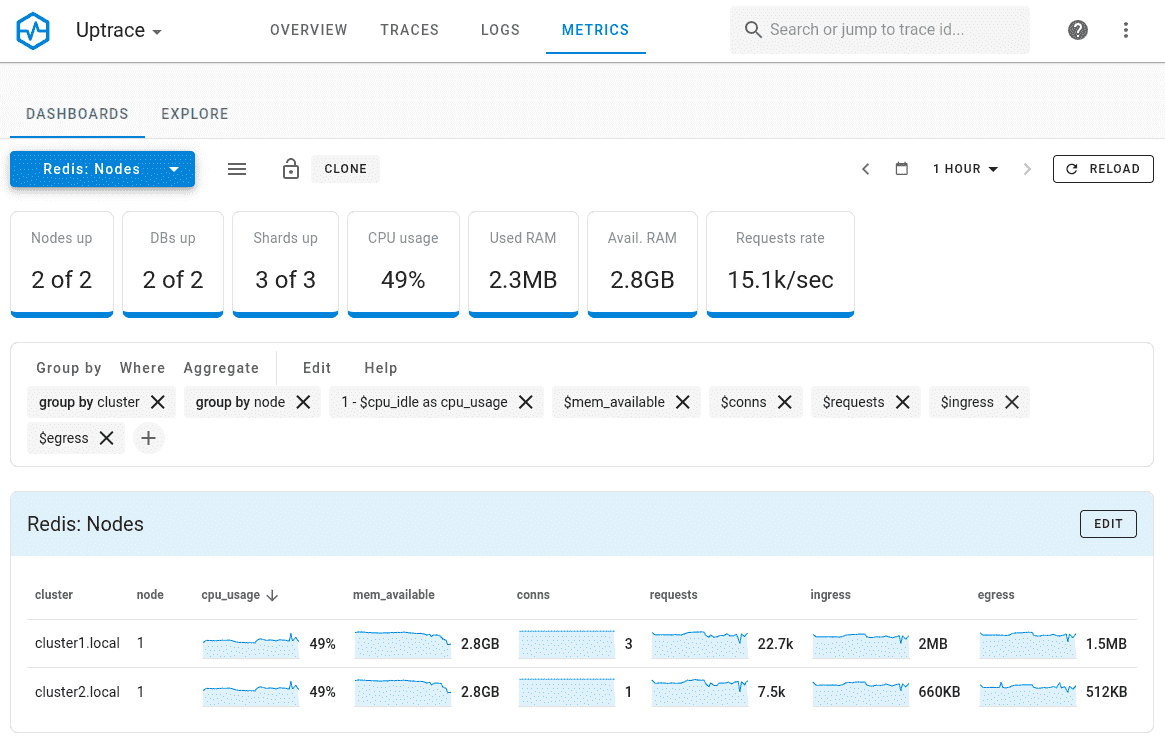
Uptrace
Market Position: Fast-growing open-source alternative with 3,000+ deployments
Strengths:
- OpenTelemetry-native with excellent performance
- 90% cost reduction compared to enterprise platforms
- Unified metrics, logs, and traces in single platform
- Transparent pricing with no hidden fees
Weaknesses:
- Smaller ecosystem compared to established vendors
- Limited enterprise sales support
- Newer in market (though rapidly growing)
Best For: Cost-conscious teams wanting enterprise features without enterprise prices
Pricing: Open source free, cloud hosting from $30/month
Grafana
Market Position: Leading open-source visualization platform, 4.03% market share
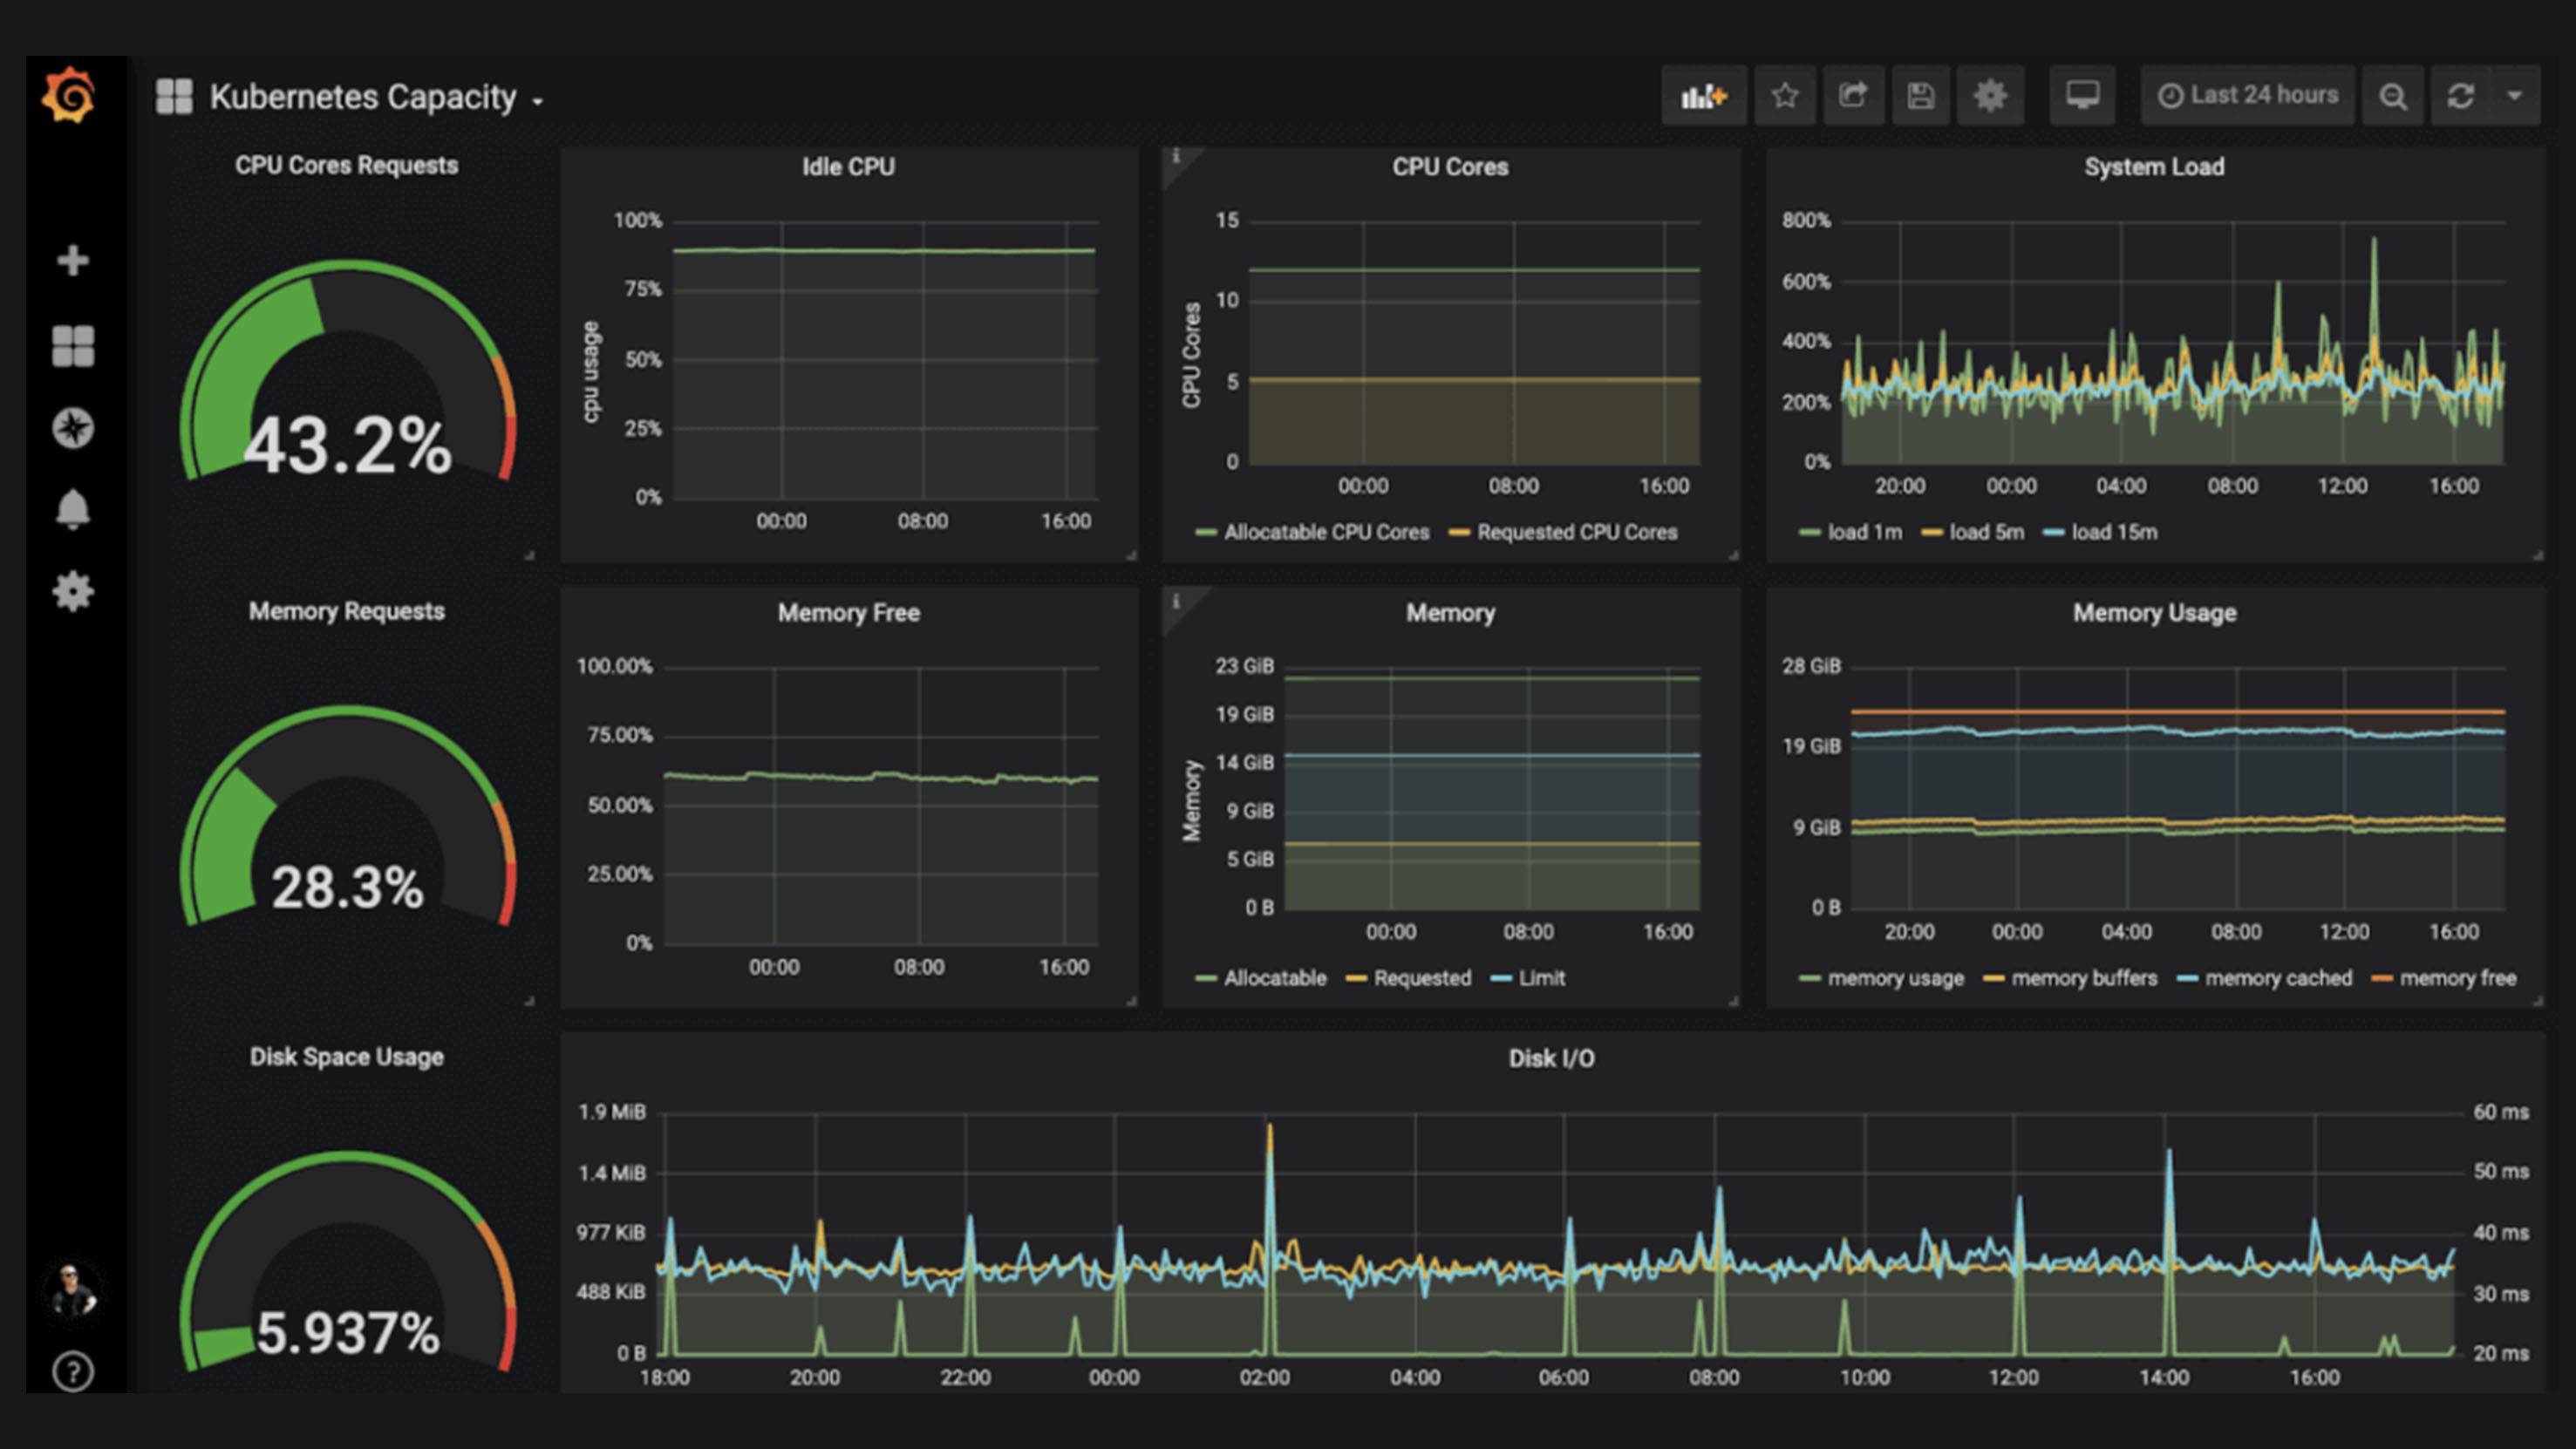
Strengths:
- Best-in-class visualization capabilities
- Massive plugin ecosystem and community
- Flexible and highly customizable
- Strong integration with Prometheus, Loki, Tempo
Weaknesses:
- Requires technical expertise to set up and maintain
- Additional tools needed for complete observability
- No built-in data collection (visualization only)
Best For: Teams with DevOps expertise wanting maximum flexibility
Pricing: Open source free, Grafana Cloud from $49/month
Prometheus + Grafana Stack
Market Position: Standard cloud-native monitoring stack, 2.43% adoption
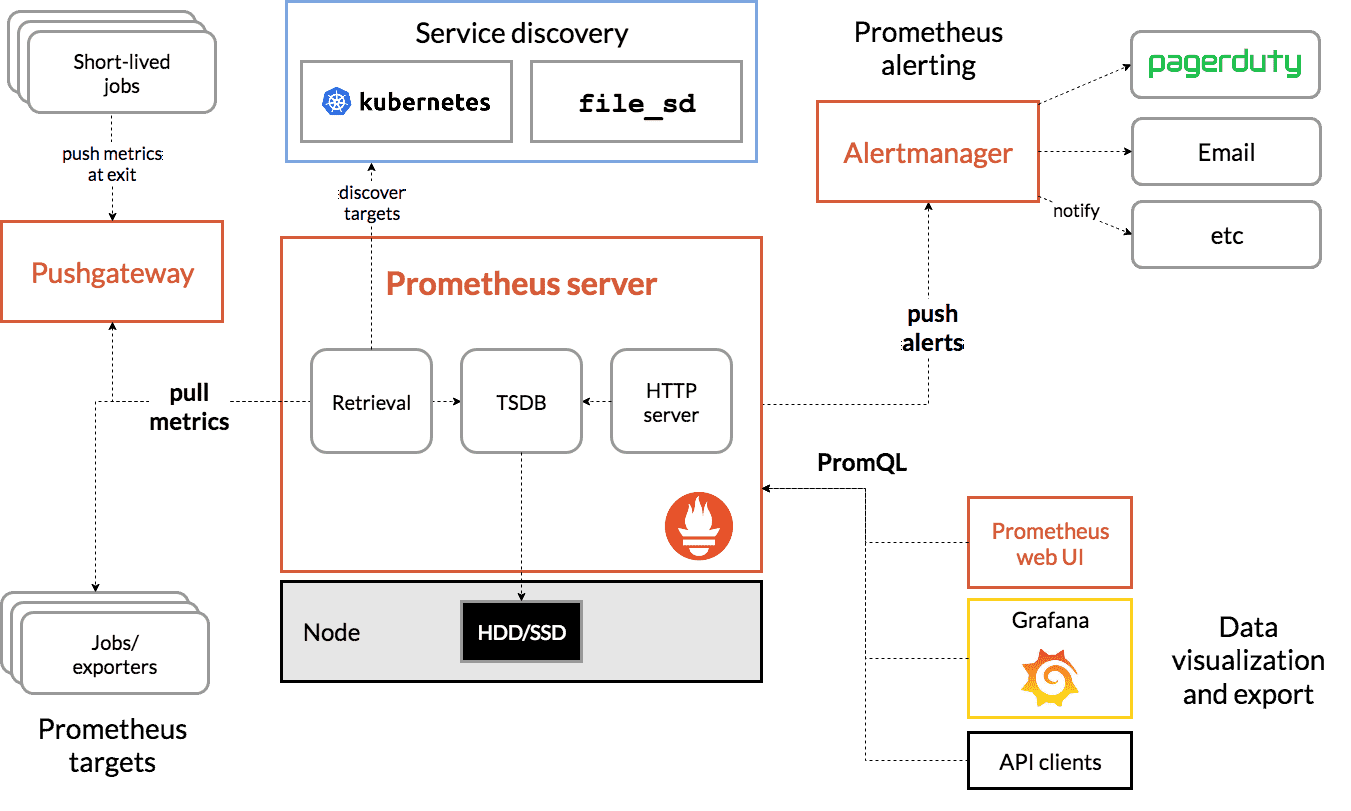
Strengths:
- Industry standard for Kubernetes monitoring
- Completely free and open source
- Excellent for metrics and time-series data
- Active community and extensive documentation
Weaknesses:
- Limited log management capabilities
- Requires significant setup and maintenance
- No distributed tracing without additional tools
- Challenging to scale for high-cardinality data
Best For: Cloud-native teams with strong DevOps capabilities
Pricing: Free (infrastructure costs apply)
Specialized Solutions
Honeycomb
Market Position: High-cardinality data specialist, strong developer mindshare
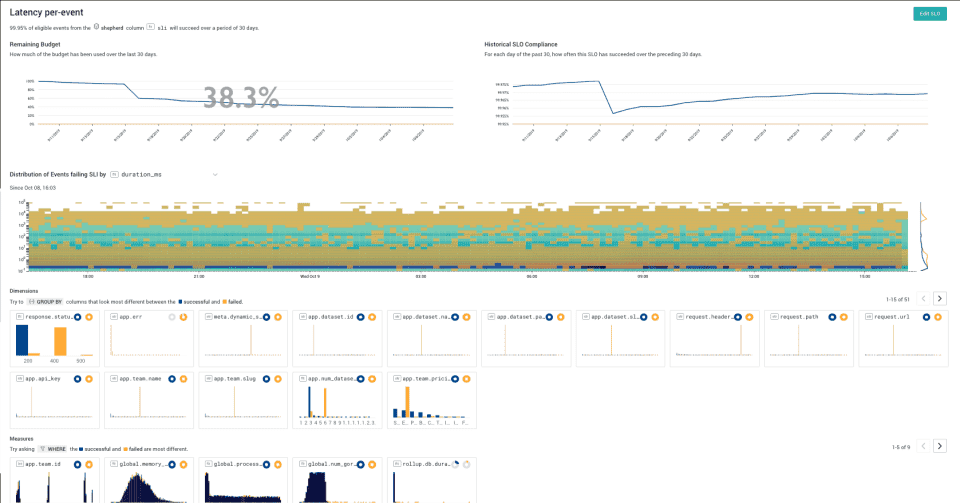
Strengths:
- Exceptional high-cardinality data analysis
- Intuitive query interface for complex investigations
- Strong focus on developer experience
- Excellent for microservices debugging
Weaknesses:
- Higher learning curve for traditional ops teams
- Limited infrastructure monitoring capabilities
- Premium pricing for advanced features
Best For: Engineering teams debugging complex, distributed systems
Pricing: Free tier, paid plans from $100/month
Elastic Observability
Market Position: Strong in log-heavy environments, leverages Elasticsearch ecosystem
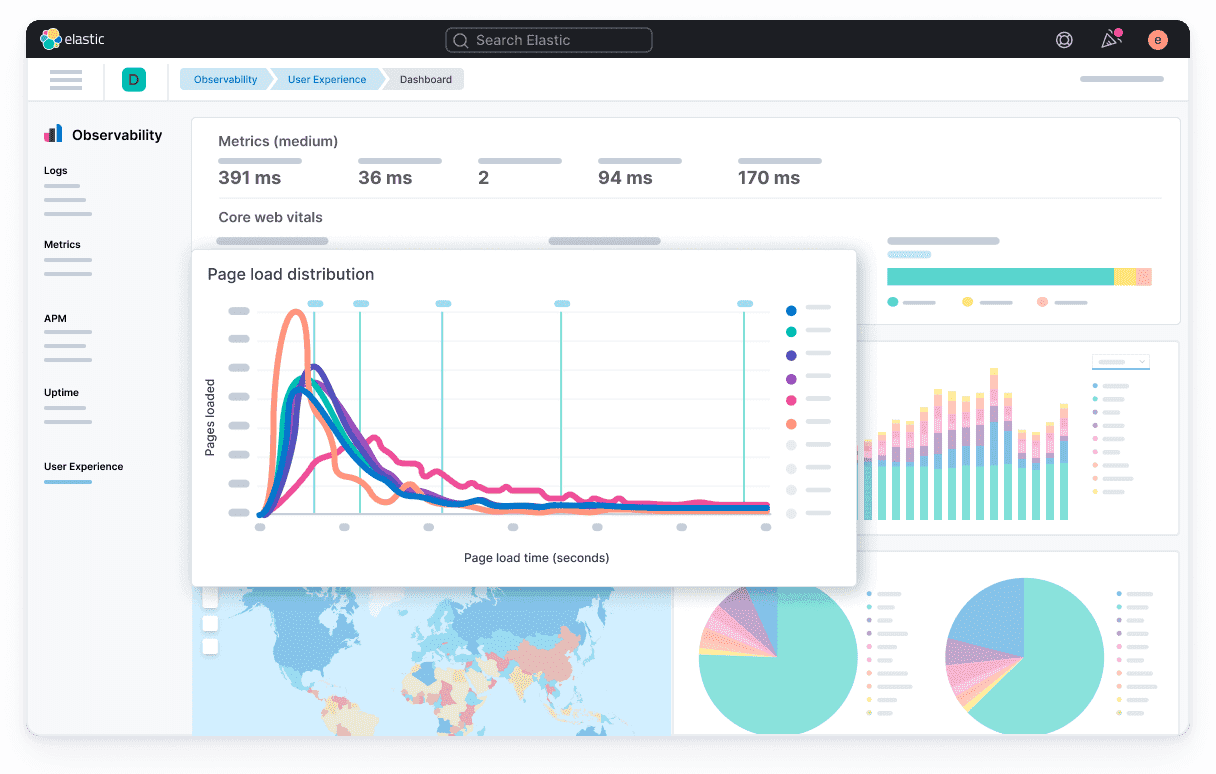
Strengths:
- Powerful search and log analysis capabilities
- Good integration with existing Elastic Stack
- Strong for security and compliance use cases
- Flexible deployment options
Weaknesses:
- Complex to set up and optimize
- High resource requirements
- Can be expensive at scale
Best For: Organizations with heavy logging requirements or existing Elastic investments
Pricing: Open source available, cloud from $95/month
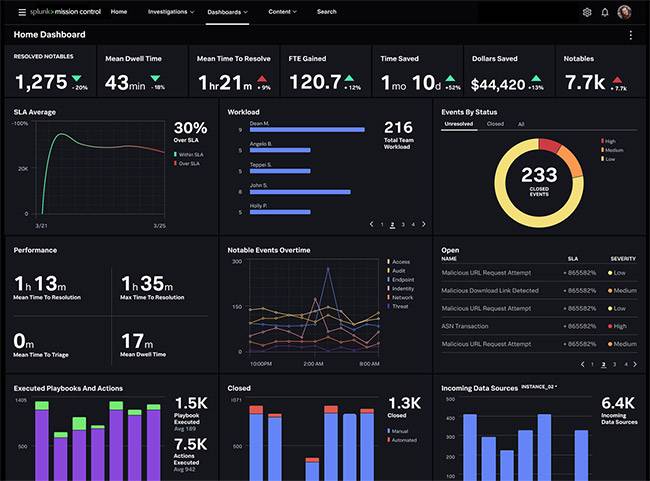
Splunk Observability
Market Position: Strong in security and compliance, 63.56% SIEM market share
Strengths:
- Excellent for security and compliance monitoring
- Powerful data analysis and correlation
- NoSample technology for complete trace capture
- Strong enterprise integration capabilities
Weaknesses:
- Premium pricing model
- Complex licensing structure
- Steep learning curve
Best For: Security-focused organizations with complex data analysis needs
Pricing: Custom enterprise pricing
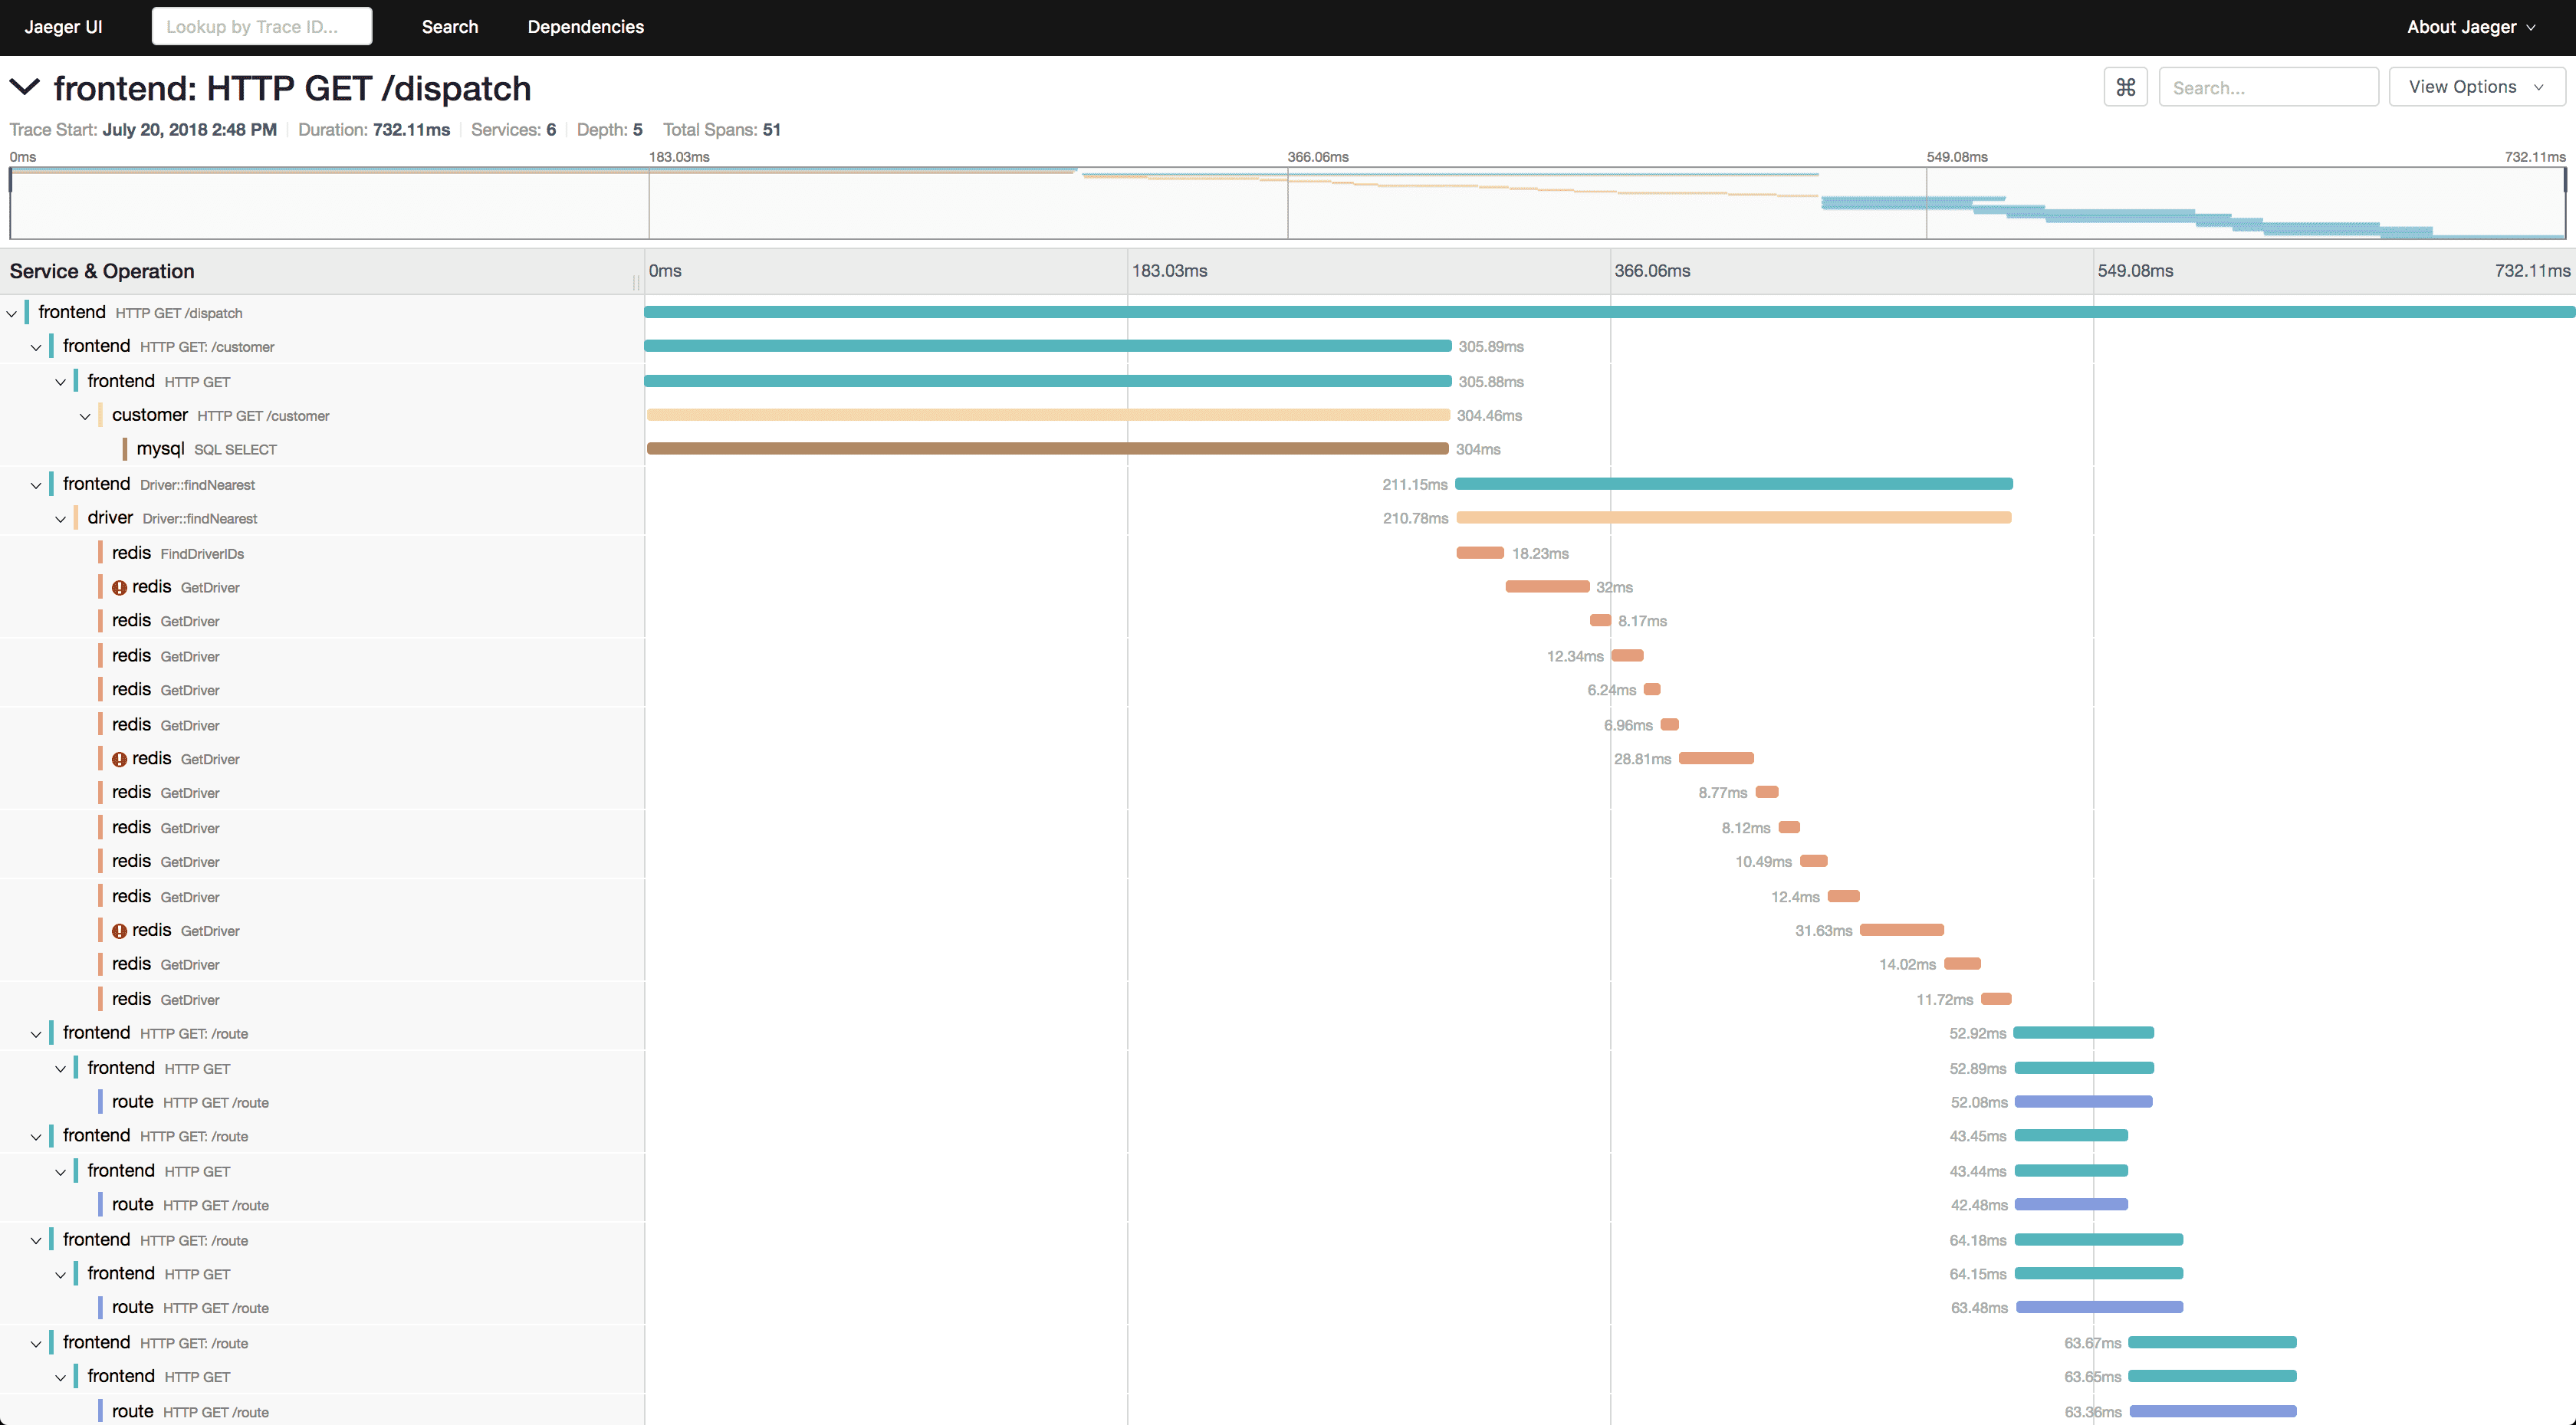
Jaeger
Market Position: Leading open-source distributed tracing solution
Strengths:
- Industry standard for distributed tracing
- Lightweight and high-performance
- Strong OpenTelemetry integration
- Minimal operational overhead
Weaknesses:
- Limited to tracing only (no metrics or logs)
- Requires additional tools for complete observability
- Basic visualization capabilities
Best For: Teams needing specialized distributed tracing
Pricing: Open source, free to use
How to Choose the Right Observability Tool
By Company Size
Startups/Small Teams (< 50 people):
- Uptrace: Best value with enterprise features
- New Relic: Generous free tier
- Grafana + Prometheus: If you have DevOps expertise
Mid-Market (50-500 people):
- New Relic: Balanced features and pricing
- Datadog: If budget allows, most comprehensive
- Uptrace: Cost-effective enterprise alternative
Enterprise (500+ people):
- Datadog: Market leader with full feature set
- Dynatrace: AI-powered automation
- Splunk: Security and compliance focus
By Use Case
Cloud-Native/Kubernetes:
- Prometheus + Grafana (standard)
- Uptrace (modern alternative)
- Datadog (comprehensive)
Microservices Debugging:
- Honeycomb (high-cardinality analysis)
- Jaeger (distributed tracing)
- Uptrace (unified approach)
Cost Optimization:
- Uptrace (transparent pricing)
- Grafana stack (open source)
- New Relic (predictable costs)
Enterprise Compliance:
- Dynatrace (automated compliance)
- Splunk (security focus)
- Datadog (comprehensive auditing)
Quick Decision Guide
Choose Datadog if: Budget isn't a primary concern and you need comprehensive, enterprise-grade features
Choose New Relic if: You want balanced features with predictable pricing and good free tier
Choose Uptrace if: Cost is important but you don't want to sacrifice functionality
Choose Grafana stack if: You have strong DevOps team and want maximum flexibility
Choose Dynatrace if: You prioritize AI-powered automation and have enterprise budget
Choose Honeycomb if: You're debugging complex distributed systems and need advanced querying
Conclusion
The observability tools market offers options for every team size and budget. While Datadog dominates with comprehensive features, alternatives like Uptrace provide enterprise capabilities at startup-friendly pricing. New Relic offers the best balance for most mid-market companies, while open-source solutions like Grafana remain popular for teams with technical expertise.
Consider your team size, technical capabilities, budget constraints, and specific use cases when making your decision. Most platforms offer free trials - test before committing to ensure the tool fits your workflow and requirements.
FAQ
What's the difference between observability and monitoring? Monitoring tells you when something breaks using predefined metrics. Observability helps you understand why it broke by providing deep insights into system behavior and performance patterns.
How much should I budget for observability tools? Small teams: $500-2,000/month. Mid-market: $2,000-15,000/month. Enterprise: $15,000-100,000+/month. Costs vary significantly based on data volume and feature requirements.
Can I use multiple observability tools together? Yes, many organizations use specialized tools for different purposes. However, unified platforms often provide better correlation and reduced complexity.
Which observability tool is best for startups? Uptrace offers the best value with enterprise features at startup pricing. New Relic provides an excellent free tier. Both are more cost-effective than Datadog for smaller teams.
Do I need observability if I have APM tools? APM focuses on application performance while observability provides broader system insights including infrastructure, business metrics, and cross-service dependencies. For complex systems, both complement each other.
How do I calculate ROI for observability tools? Measure reduced mean time to resolution (MTTR), decreased incident frequency, improved system performance, and developer productivity gains. Most teams see positive ROI within 3-12 months.
You may also be interested in: