OpenTelemetry MySQL Monitoring [step by step]
MySQL monitoring with OpenTelemetry captures slow queries, connection counts, buffer pool metrics, and replication lag — integrated into the same OpenTelemetry APM pipeline as your application traces.
This guide covers two complementary approaches:
- Collector receiver — pull infrastructure metrics (connections, buffer pool, replication lag) with zero application changes
- SDK instrumentation — trace individual queries from your Node.js or Python application code
Vendor-neutral: Examples use Uptrace as the backend. OpenTelemetry is vendor-neutral — replace the OTLP endpoint to send data to any compatible backend (Grafana Cloud, Datadog, New Relic, etc.).
Quick Start
| Step | Action | Detail |
|---|---|---|
| 1. Create user | Grant monitoring privileges | GRANT PROCESS, REPLICATION CLIENT, SELECT ON *.* TO 'otel'@'localhost'; |
| 2. Configure | Add mysql receiver to Collector | Point to localhost:3306 |
| 3. Restart | Apply new config | sudo systemctl restart otelcol-contrib |
| 4. Verify | Check for metrics | Look for mysql.threads in your backend |
Prerequisites
Before you begin, make sure you have:
- A running MySQL 8.0+ or MariaDB 10.11+ instance
- OpenTelemetry Collector Contrib installed on a host that can reach your MySQL server
- An Uptrace DSN in the format
https://<secret>@api.uptrace.dev?grpc=4317
Create a dedicated MySQL user for monitoring with the necessary permissions:
CREATE USER 'otel'@'localhost' IDENTIFIED BY 'your_secure_password';
GRANT PROCESS, REPLICATION CLIENT, SELECT ON *.* TO 'otel'@'localhost';
FLUSH PRIVILEGES;
The PROCESS privilege allows access to server status variables, REPLICATION CLIENT enables replication lag monitoring, and SELECT is needed for performance_schema queries.
What is OpenTelemetry Collector?
OpenTelemetry Collector is a vendor-agnostic agent that collects telemetry and exports it to an OpenTelemetry backend. Its pipeline of receivers, processors, and exporters lets you collect MySQL metrics alongside application traces and logs in a single agent.
OpenTelemetry MySQL Receiver
The MySQL receiver connects to your MySQL instance and periodically queries server status variables, InnoDB metrics, and performance_schema statement digests.
To start monitoring MySQL, configure the receiver in /etc/otelcol-contrib/config.yaml using your Uptrace DSN:
receivers:
  otlp:
    protocols:
      grpc:
      http:
  mysql:
    endpoint: localhost:3306
    username: otel
    password: ${env:MYSQL_PASSWORD}
    database: otel
    collection_interval: 10s
    statement_events:
      digest_text_limit: 120
      time_limit: 24h
      limit: 250
    metrics:
      mysql.commands:
        enabled: true
      mysql.connection.errors:
        enabled: true
      mysql.replica.sql_delay:
        enabled: true
      mysql.replica.time_behind_source:
        enabled: true
      mysql.statement_event.count:
        enabled: true
      mysql.statement_event.wait.time:
        enabled: true

exporters:
  otlp/uptrace:
    endpoint: api.uptrace.dev:4317
    headers:
      uptrace-dsn: 'https://<secret>@api.uptrace.dev?grpc=4317'

processors:
  resourcedetection:
    detectors: [env, system]
  cumulativetodelta:
  batch:
    timeout: 10s

service:
  pipelines:
    traces:
      receivers: [otlp]
      processors: [batch]
      exporters: [otlp/uptrace]
    metrics:
      receivers: [otlp, mysql]
      processors: [cumulativetodelta, batch, resourcedetection]
      exporters: [otlp/uptrace]
Key configuration options:
| Option | Description |
|---|---|
collection_interval | How often to collect metrics (default: 10s) |
metrics.*.enabled | Enables optional MySQL receiver metrics |
statement_events.digest_text_limit | Max length of SQL digest text |
statement_events.time_limit | Only include statements executed within this period |
statement_events.limit | Max number of statement digests to collect |
Restart OpenTelemetry Collector to apply the configuration:
sudo systemctl restart otelcol-contrib
Check the logs to verify the receiver started successfully:
sudo journalctl -u otelcol-contrib -f
You should see a line like Receiver started with name=mysql in the output.
Key MySQL Metrics
The MySQL receiver collects metrics that fall into several categories:
Connection metrics track how many clients are connected and whether you're approaching the max_connections limit:
mysql.threadswithkind=connected— current open connectionsmysql.threadswithkind=running— threads actively executing workmysql.connection.errors— connection errors by type (optional, enabled above)
Query performance metrics help identify slow queries and throughput issues:
mysql.statement_event.count— statement executions by digest (optional, enabled above)mysql.statement_event.wait.time— total wait time per statement digest (optional, enabled above)mysql.commands— command counts (SELECT, INSERT, UPDATE, DELETE; optional, enabled above)
Buffer pool metrics reveal how effectively InnoDB is caching data:
mysql.buffer_pool.pages— pages by kind (data, free, misc, total)mysql.buffer_pool.operations— read requests vs disk reads (cache hit ratio)mysql.buffer_pool.data_pages— clean and dirty data pages in the buffer pool
Replication metrics (when applicable) help monitor replica lag:
mysql.replica.time_behind_source— seconds the replica is behind the sourcemysql.replica.sql_delay— configured replication delay
Semantic Conventions
OpenTelemetry defines standard semantic conventions for MySQL spans produced by SDK instrumentation. Key attributes:
| Attribute | Value | Description |
|---|---|---|
db.system.name | "mysql" | Always set for MySQL |
db.namespace | "mydb" | Database name |
db.query.text | "SELECT * FROM orders WHERE id = ?" | SQL text (parameterized) |
db.operation.name | "SELECT" | SQL verb |
db.collection.name | "orders" | Primary table, when known |
server.address | "localhost" | MySQL host |
server.port | 3306 | MySQL port |
Backends like Uptrace use these attributes to power query-level flamegraphs and slow-query detection.
Node.js SDK Instrumentation
To trace individual MySQL queries from your Node.js application, use @opentelemetry/instrumentation-mysql2.
Installation
npm install @opentelemetry/sdk-node \
            @opentelemetry/exporter-trace-otlp-grpc \
            @opentelemetry/instrumentation-mysql2 \
            mysql2
Setup
// tracing.js — require this before any other module
const { NodeSDK } = require('@opentelemetry/sdk-node');
const { OTLPTraceExporter } = require('@opentelemetry/exporter-trace-otlp-grpc');
const { MySQL2Instrumentation } = require('@opentelemetry/instrumentation-mysql2');

const sdk = new NodeSDK({
  traceExporter: new OTLPTraceExporter({
    url: 'https://api.uptrace.dev:4317',
    headers: { 'uptrace-dsn': process.env.UPTRACE_DSN },
  }),
  instrumentations: [
    new MySQL2Instrumentation({
      maskStatement: true, // redact literals from raw SQL before span attributes
    }),
  ],
  serviceName: 'my-api',
});

sdk.start();
process.on('SIGTERM', () => sdk.shutdown());
Query Example
// app.js
require('./tracing');  // must be first

const mysql = require('mysql2/promise');

async function getUser(id) {
  const pool = mysql.createPool({
    host: 'localhost',
    user: 'app',
    password: process.env.DB_PASSWORD,
    database: 'myapp',
  });

  // This query is automatically traced with database span attributes
  const [rows] = await pool.query('SELECT id, email FROM users WHERE id = ?', [id]);
  return rows[0];
}
Each query produces a client span with MySQL database attributes and the full execution duration including network round-trip.
Python SDK Instrumentation
To trace MySQL queries from Python, use opentelemetry-instrumentation-mysql (latest: 0.62b1).
Installation
pip install opentelemetry-sdk \
            opentelemetry-exporter-otlp-proto-grpc \
            opentelemetry-instrumentation-mysql==0.62b1 \
            mysql-connector-python
Setup
from opentelemetry import trace
from opentelemetry.sdk.trace import TracerProvider
from opentelemetry.sdk.trace.export import BatchSpanProcessor
from opentelemetry.exporter.otlp.proto.grpc.trace_exporter import OTLPSpanExporter
from opentelemetry.instrumentation.mysql import MySQLInstrumentor
import os

# Configure tracer
provider = TracerProvider()
provider.add_span_processor(
    BatchSpanProcessor(
        OTLPSpanExporter(
            endpoint="https://api.uptrace.dev:4317",
            headers={"uptrace-dsn": os.environ["UPTRACE_DSN"]},
        )
    )
)
trace.set_tracer_provider(provider)

# Instrument MySQL — must be called before any connection is opened
MySQLInstrumentor().instrument()
Query Example
import mysql.connector

conn = mysql.connector.connect(
    host="localhost",
    user="app",
    password=os.environ["DB_PASSWORD"],
    database="myapp",
)

cursor = conn.cursor()
# This query is automatically traced with MySQL database span attributes
cursor.execute("SELECT id, email FROM users WHERE id = %s", (user_id,))
user = cursor.fetchone()
cursor.close()
Alerting
Set up monitors for the conditions most likely to cause incidents:
| Condition | Metric | Threshold | Action |
|---|---|---|---|
| Connection saturation | mysql.threads (kind=connected) | > 80 % of max_connections | Scale app pool or increase limit |
| Replication lag | mysql.replica.time_behind_source | > 30 s | Check replica I/O, network |
| Low buffer pool hit ratio | mysql.buffer_pool.operations (reads/hits) | < 95 % | Increase innodb_buffer_pool_size |
| Slow statement surge | mysql.statement_event.wait.time | sudden increase | Check EXPLAIN for missing indexes |
Troubleshooting
"Access denied" errors: Verify the monitoring user has the correct privileges. Run SHOW GRANTS FOR 'otel'@'localhost'; to check.
No statement events data: Ensure performance_schema is enabled in your MySQL configuration (performance_schema = ON in my.cnf). This is enabled by default in MySQL 8.0+.
High collection overhead: If the receiver adds noticeable load, increase collection_interval to 30s or 60s, and reduce the statement_events.limit.
Connection refused: Check that the Collector host can reach MySQL on port 3306. Test with mysql -h localhost -u otel -p from the Collector host.
No spans from Node.js: Confirm require('./tracing') is the very first require in your entry file — instrumentation hooks must register before mysql2 is loaded. Verify with OTEL_LOG_LEVEL=debug node app.js.
Python spans missing: Call MySQLInstrumentor().instrument() before opening any connection. Calling it after mysql.connector.connect() has no effect on already-open connections.
DSN header rejected: The uptrace-dsn header value must be the full DSN in the format https://<secret>@api.uptrace.dev?grpc=4317. Verify by checking the Uptrace project settings page.
What is Uptrace?
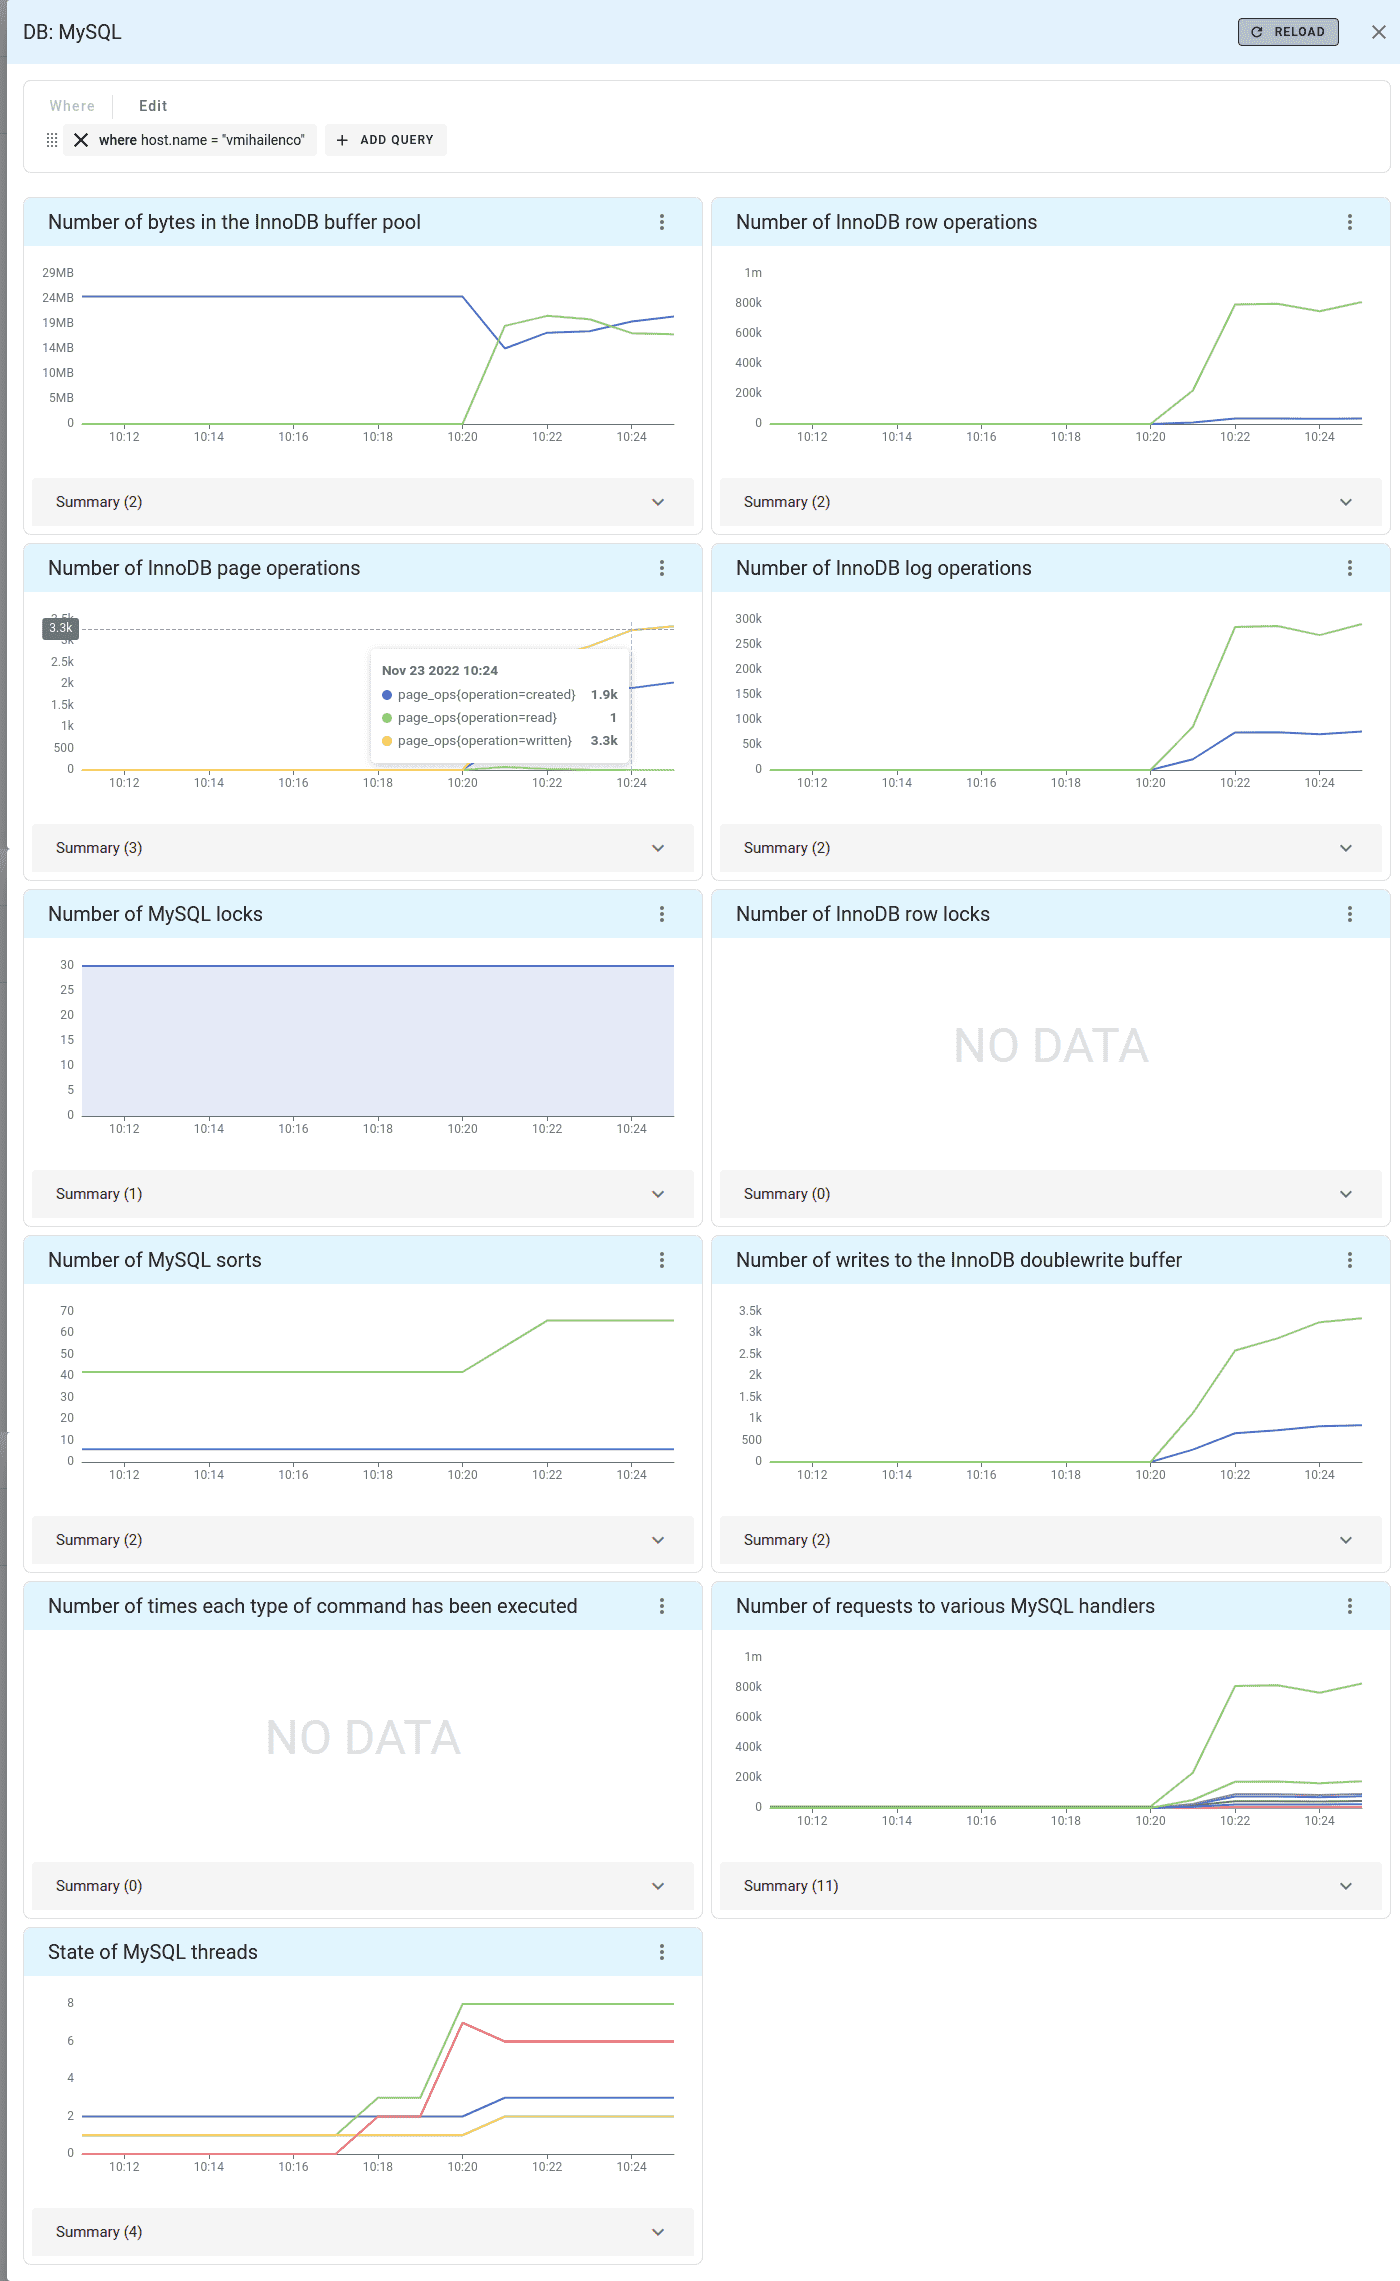
Uptrace is an OpenTelemetry-native APM — open-source, self-hostable, and built for high-volume telemetry data. Once metrics are collected by the Collector, Uptrace automatically creates a MySQL dashboard:
Uptrace comes with an intuitive query builder, rich dashboards, alerting rules with notifications, and integrations for most languages and frameworks. It can process billions of spans and metrics on a single server at 10x lower cost.
Try it via the cloud demo or run locally with Docker. Source code on GitHub.
FAQ
Does the Collector receiver work without the SDK? Yes. The receiver collects metrics from MySQL status variables and performance_schema independently — no application code changes required.
Should I use the receiver or the SDK? Use both. The receiver gives you infrastructure metrics (connection counts, buffer pool, replication lag). The SDK gives you per-query traces visible in your application's distributed trace. They complement each other.
Does this work with MariaDB? Yes. The MySQL receiver supports MariaDB 10.11+. Some metrics (e.g. mysql.replica.time_behind_source) map to MariaDB's equivalent status variables automatically.
Is db.query.text safe to enable in production? Parameterized queries are safe — parameter values are not captured, only the SQL template. Avoid enabling it if raw queries contain embedded credentials or PII.
What's next?
- Monitor other databases with PostgreSQL monitoring or Redis monitoring
- Add host-level metrics with the host metrics receiver
- Explore OpenTelemetry APM for end-to-end application monitoring
- Learn more about OpenTelemetry Collector configuration options