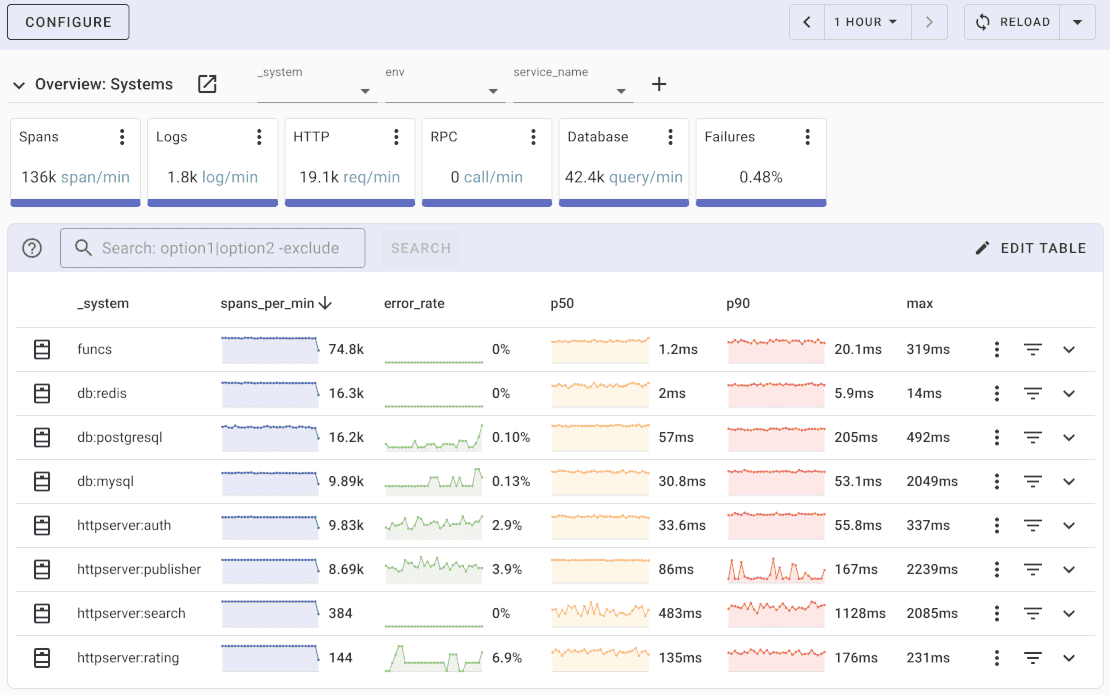
OpenTelemetry SQLAlchemy monitoring
OpenTelemetry SQLAlchemy instrumentation allows developers to monitor database operations, track query performance, and identify slow queries in their Python applications.
What is SQLAlchemy?
SQLAlchemy is the most popular Object Relational Mapper (ORM) for Python. It provides application developers with the full power and flexibility of SQL while maintaining a Pythonic interface.
Key features of SQLAlchemy include:
- Full ORM with Unit of Work pattern
- SQL Expression Language for programmatic query construction
- Connection pooling and engine management
- Support for multiple database backends (PostgreSQL, MySQL, SQLite, etc.)
- Async support with SQLAlchemy 2.0
What is OpenTelemetry?
OpenTelemetry is an open-source observability framework that aims to standardize and simplify the collection, processing, and export of telemetry data from applications and systems.
OpenTelemetry supports multiple programming languages and platforms, making it suitable for a wide range of applications and environments. For comprehensive Python instrumentation, see the OpenTelemetry Python guide.
OpenTelemetry enables developers to instrument their code and collect telemetry data, which can then be exported to various OpenTelemetry backends or observability platforms for analysis and visualization.
SQLAlchemy instrumentation
OpenTelemetry SQLAlchemy instrumentation automatically traces database queries, capturing SQL statements, execution time, and connection information.
To install the instrumentation:
pip install opentelemetry-instrumentation-sqlalchemy
Basic usage
Instrument your SQLAlchemy engine to automatically trace all database operations:
from sqlalchemy import create_engine
from opentelemetry.instrumentation.sqlalchemy import SQLAlchemyInstrumentor

# Create your engine
engine = create_engine("postgresql://user:password@localhost/mydb")

# Instrument the engine
SQLAlchemyInstrumentor().instrument(engine=engine)
Once instrumented, all queries executed through this engine will generate spans with detailed information about the database operation.
Global instrumentation
You can also instrument all SQLAlchemy engines globally:
from opentelemetry.instrumentation.sqlalchemy import SQLAlchemyInstrumentor

# Instrument all engines created after this call
SQLAlchemyInstrumentor().instrument()
To uninstrument:
SQLAlchemyInstrumentor().uninstrument()
Configuration options
The SQLAlchemy instrumentation supports several configuration options:
| Option | Description | Default |
|---|---|---|
engine | Specific engine to instrument | None |
enable_commenter | Add SQL comments with trace context | False |
commenter_options | Configure which info to include in SQL comments | {} |
skip_queries | List of SQL patterns to skip from tracing | [] |
Example with options:
from opentelemetry.instrumentation.sqlalchemy import SQLAlchemyInstrumentor

SQLAlchemyInstrumentor().instrument(
    engine=engine,
    enable_commenter=True,
    commenter_options={
        "opentelemetry_values": True,
    },
)
SQL Commenter
Enable SQL Commenter to add trace context as comments in your SQL queries, making it easier to correlate queries in your database logs:
from opentelemetry.instrumentation.sqlalchemy import SQLAlchemyInstrumentor

SQLAlchemyInstrumentor().instrument(
    engine=engine,
    enable_commenter=True,
    commenter_options={
        "opentelemetry_values": True,
        "db_driver": True,
        "route": True,
    },
)
Your queries will include comments like:
SELECT * FROM users WHERE id = 1
/*traceparent='00-abc123-def456-01',db_driver='postgresql'*/
Async SQLAlchemy
For async applications using SQLAlchemy 2.0+, use the async engine:
from sqlalchemy.ext.asyncio import create_async_engine
from opentelemetry.instrumentation.sqlalchemy import SQLAlchemyInstrumentor

# Create async engine
async_engine = create_async_engine(
    "postgresql+asyncpg://user:password@localhost/mydb"
)

# Instrument the async engine
SQLAlchemyInstrumentor().instrument(engine=async_engine.sync_engine)
Usage with async sessions:
from sqlalchemy.ext.asyncio import AsyncSession
from sqlalchemy.orm import sessionmaker

async_session = sessionmaker(
    async_engine, class_=AsyncSession, expire_on_commit=False
)

async with async_session() as session:
    result = await session.execute(select(User).where(User.id == 1))
    user = result.scalar_one_or_none()
Captured span attributes
The SQLAlchemy instrumentation automatically captures:
| Attribute | Description |
|---|---|
db.system | Database system (postgresql, mysql, sqlite, etc.) |
db.name | Database name |
db.statement | SQL statement (may be sanitized) |
db.user | Database user |
db.operation | SQL operation (SELECT, INSERT, UPDATE, DELETE) |
net.peer.name | Database host |
net.peer.port | Database port |
Example with queries
Here's a complete example showing queries and their resulting spans:
from sqlalchemy import create_engine, text, Column, Integer, String
from sqlalchemy.orm import declarative_base, Session
from opentelemetry import trace
from opentelemetry.instrumentation.sqlalchemy import SQLAlchemyInstrumentor

# Setup
Base = declarative_base()

class User(Base):
    __tablename__ = "users"
    id = Column(Integer, primary_key=True)
    name = Column(String)
    email = Column(String)

engine = create_engine("sqlite:///example.db")
SQLAlchemyInstrumentor().instrument(engine=engine)
Base.metadata.create_all(engine)

# Queries - each generates a span
with Session(engine) as session:
    # Span: "INSERT users"
    user = User(name="Alice", email="alice@example.com")
    session.add(user)
    session.commit()

    # Span: "SELECT users"
    users = session.query(User).filter(User.name == "Alice").all()

    # Span: "UPDATE users"
    user.email = "alice.new@example.com"
    session.commit()
Adding custom attributes
Add custom attributes to database spans for better observability:
from opentelemetry import trace
from sqlalchemy.orm import Session

def get_user_orders(user_id: int):
    tracer = trace.get_tracer(__name__)

    with tracer.start_as_current_span("get_user_orders") as span:
        span.set_attribute("user.id", user_id)

        with Session(engine) as session:
            # The SQLAlchemy span will be a child of get_user_orders
            orders = session.query(Order).filter(Order.user_id == user_id).all()

            span.set_attribute("orders.count", len(orders))
            return orders
Error tracking
Database errors are automatically captured in spans. You can add additional error handling:
from opentelemetry import trace
from opentelemetry.trace import Status, StatusCode
from sqlalchemy.exc import SQLAlchemyError
from sqlalchemy.orm import Session

def create_user(name: str, email: str):
    span = trace.get_current_span()

    try:
        with Session(engine) as session:
            user = User(name=name, email=email)
            session.add(user)
            session.commit()
            return user
    except SQLAlchemyError as e:
        span.record_exception(e)
        span.set_status(Status(StatusCode.ERROR, str(e)))
        raise
Integration with web frameworks
SQLAlchemy instrumentation works alongside web framework instrumentation. Here's an example with Flask:
from flask import Flask
from sqlalchemy import create_engine
from opentelemetry.instrumentation.flask import FlaskInstrumentor
from opentelemetry.instrumentation.sqlalchemy import SQLAlchemyInstrumentor

app = Flask(__name__)
engine = create_engine("postgresql://user:password@localhost/mydb")

# Instrument both Flask and SQLAlchemy
FlaskInstrumentor().instrument_app(app)
SQLAlchemyInstrumentor().instrument(engine=engine)

@app.route("/users/<int:user_id>")
def get_user(user_id):
    # Both the HTTP request and database query are traced
    # with proper parent-child relationships
    with Session(engine) as session:
        user = session.get(User, user_id)
        return {"name": user.name, "email": user.email}
What is Uptrace?
Uptrace is an OpenTelemetry APM that supports distributed tracing, metrics, and logs. You can use it to monitor applications and troubleshoot issues.

Uptrace comes with an intuitive query builder, rich dashboards, alerting rules with notifications, and integrations for most languages and frameworks.
Uptrace can process billions of spans and metrics on a single server and allows you to monitor your applications at 10x lower cost.
In just a few minutes, you can try Uptrace by visiting the cloud demo (no login required) or running it locally with Docker. The source code is available on GitHub.
What's next?
SQLAlchemy instrumentation provides detailed insights into your database operations, including query execution times, connection usage, and error tracking.
Next steps to enhance your observability:
- Instrument your web framework with Flask, Django, or FastAPI
- Create custom spans using the OpenTelemetry Python Tracing API
- Set up the OpenTelemetry Collector for production deployments
- Learn about context propagation for distributed tracing