OpenTelemetry Go net/http Instrumentation [otelhttp]
Learn how to instrument Go HTTP applications using otelhttp - OpenTelemetry's official HTTP instrumentation package.
otelhttp provides automatic distributed tracing and metrics for net/http servers and clients with minimal code changes.
Prerequisites
Before instrumenting your Go HTTP applications:
- Go 1.21+ installed
- Basic understanding of Go net/http package
- Existing Go HTTP server or client application
Verify your Go version:
go version
What is OpenTelemetry?
OpenTelemetry is an open-source observability framework that aims to standardize and simplify the collection, processing, and export of telemetry data from applications and systems.
OpenTelemetry supports multiple programming languages and platforms, making it suitable for a wide range of applications and environments.
OpenTelemetry enables developers to instrument their code and collect telemetry data, which can then be exported to various OpenTelemetry backends or observability platforms for analysis and visualization.
net/http instrumentation
To install otelhttp instrumentation:
go get go.opentelemetry.io/contrib/instrumentation/net/http/otelhttp
otelhttp vs Manual Instrumentation
otelhttp provides significant advantages over manual HTTP span creation:
| Feature | otelhttp | Manual Instrumentation |
|---|---|---|
| Setup complexity | Single wrapper call | Multiple API calls per handler |
| HTTP semantics | Automatic HTTP attributes | Manual attribute setting |
| Error handling | Built-in HTTP error detection | Custom error logic required |
| Context propagation | Automatic header handling | Manual propagator integration |
| Metrics collection | Automatic HTTP metrics | Manual metric creation |
| Maintenance | Framework updates included | Custom code maintenance |
Using otelhttp eliminates boilerplate code while ensuring compliance with OpenTelemetry semantic conventions for HTTP instrumentation.
Instrumenting http.Server
You can instrument HTTP server by wrapping all your handlers:
handler := http.Handler(http.DefaultServeMux) // or use your router
handler = otelhttp.NewHandler(handler, "")

httpServer := &http.Server{
    Addr:         ":8888",
    ReadTimeout:  5 * time.Second,
    WriteTimeout: 10 * time.Second,
    IdleTimeout:  60 * time.Second,
    Handler:      handler,
}

err := httpServer.ListenAndServe()
Filtering requests
You can exclude some requests from being traced using otelhttp.WithFilter:
handler = otelhttp.NewHandler(handler, "", otelhttp.WithFilter(otelReqFilter))

func otelReqFilter(req *http.Request) bool {
    return req.URL.Path != "/ping"
}
Span name
You can customize span name formatting using otelhttp.WithSpanNameFormatter:
handler = otelhttp.NewHandler(handler, "", otelhttp.WithSpanNameFormatter(httpSpanName))

func spanName(operation string, req *http.Request) string {
    return operation
}
Route attribute
If you are instrumenting individual handlers (not all handlers at once), you can annotate handler spans with http.route attribute. This can be useful when you can't find an instrumentation for your router.
handler = otelhttp.WithRouteTag("/hello/:username", handler)
Advanced otelhttp Configuration
Configure otelhttp for production environments:
handler = otelhttp.NewHandler(handler, "my-service",
    otelhttp.WithMessageEvents(otelhttp.ReadEvents, otelhttp.WriteEvents),
    otelhttp.WithSpanOptions(trace.WithSpanKind(trace.SpanKindServer)),
    otelhttp.WithPublicEndpoint(), // For public APIs
)
Custom attributes for business logic:
handler = otelhttp.NewHandler(handler, "",
    otelhttp.WithSpanNameFormatter(func(operation string, r *http.Request) string {
        return fmt.Sprintf("%s %s", r.Method, r.URL.Path)
    }),
)
otelhttp Middleware Integration
Combine otelhttp with authentication middleware:
func authMiddleware(next http.Handler) http.Handler {
    return http.HandlerFunc(func(w http.ResponseWriter, r *http.Request) {
        // Add user info to span
        span := trace.SpanFromContext(r.Context())
        span.SetAttributes(attribute.String("user.id", getUserID(r)))

        next.ServeHTTP(w, r)
    })
}

// Chain middleware
handler = authMiddleware(otelhttp.NewHandler(myHandler, ""))
Instrumenting http.Client
otelhttp provides a HTTP transport to instrument http.Client:
client := http.Client{
    Transport: otelhttp.NewTransport(http.DefaultTransport),
}
You can also use the following shortcuts to make HTTP requets:
import "go.opentelemetry.io/contrib/instrumentation/net/http/otelhttp"

resp, err := otelhttp.Get(ctx, "https://google.com/")
HTTP Metrics Collection
otelhttp automatically collects key HTTP metrics:
Server Metrics:
http.server.duration- Request processing timehttp.server.request.size- Request payload sizehttp.server.response.size- Response payload size
Client Metrics:
http.client.duration- Total request durationhttp.client.request.size- Outbound request sizehttp.client.response.size- Response payload size
All metrics include labels like http.method, http.status_code, and http.route.
otelhttp Troubleshooting
Common otelhttp issues and solutions:
Missing HTTP spans - check handler wrapping:
// Wrong: forgot to wrap handler
http.HandleFunc("/api", apiHandler)

// Correct: wrap with otelhttp
http.Handle("/api", otelhttp.NewHandler(http.HandlerFunc(apiHandler), ""))
Client spans missing - ensure transport usage:
client := &http.Client{
    Transport: otelhttp.NewTransport(http.DefaultTransport), // Don't forget this
}
Missing traces in distributed requests:
// Ensure context propagation in HTTP clients
req := req.WithContext(ctx) // Pass parent context
resp, err := client.Do(req)
What is Uptrace?
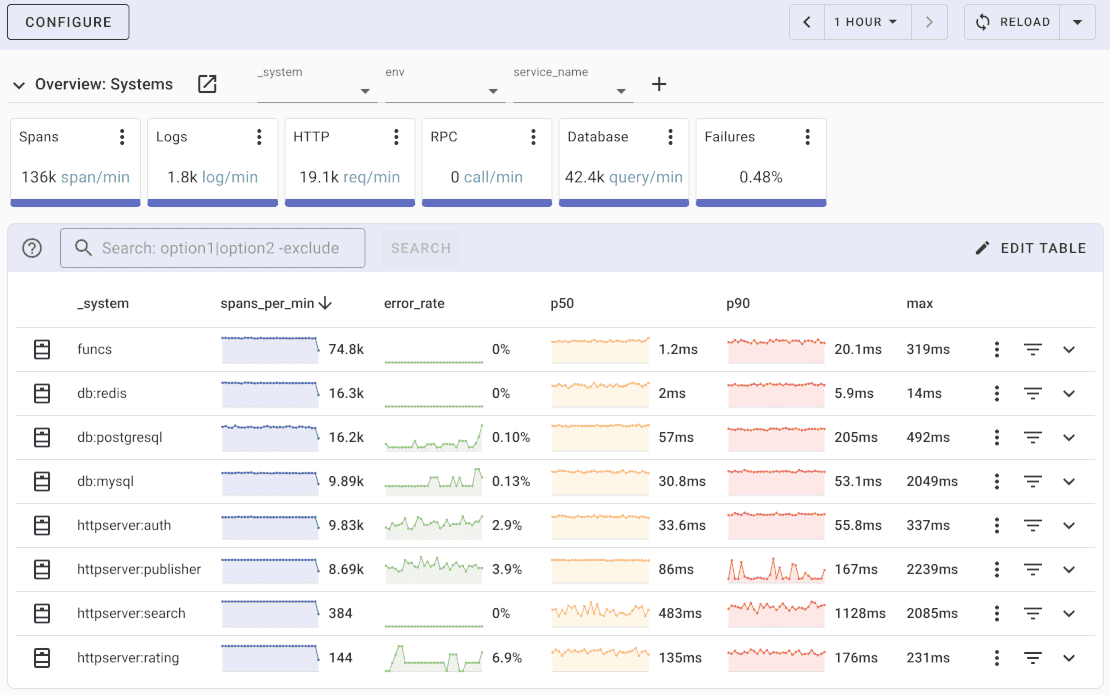
Uptrace is a OpenTelemetry APM that supports distributed tracing, metrics, and logs. You can use it to monitor applications and troubleshoot issues.

Uptrace comes with an intuitive query builder, rich dashboards, alerting rules with notifications, and integrations for most languages and frameworks.
Uptrace can process billions of spans and metrics on a single server and allows you to monitor your applications at 10x lower cost.
In just a few minutes, you can try Uptrace by visiting the cloud demo (no login required) or running it locally with Docker. The source code is available on GitHub.
FAQ
What's the difference between otelhttp handler name parameter? The operation name parameter helps identify different handlers in traces. Use descriptive names like "user-api" or "payment-service".
Can otelhttp work with streaming responses? Yes, otelhttp supports streaming. Spans close when the response writer is closed.
How to disable otelhttp for health checks? Use WithFilter to exclude specific endpoints from instrumentation.
Does otelhttp work with popular Go routers? Yes, otelhttp works with Gorilla Mux, Chi, Gin, Echo, and any router that uses standard http.Handler interface.
What's the performance overhead? Minimal - typically <1ms per request. Use sampling for high-traffic applications.
Can I add custom attributes to spans? Yes, use span.SetAttributes() within your handler to add business-specific data.
What's next?
With net/http instrumentation configured, you have full visibility into your HTTP client and server operations. For higher-level web frameworks, explore Gin, Echo, or Gorilla Mux instrumentation guides.