7 Continuous Profiling Tools to Boost Your Performance Insights
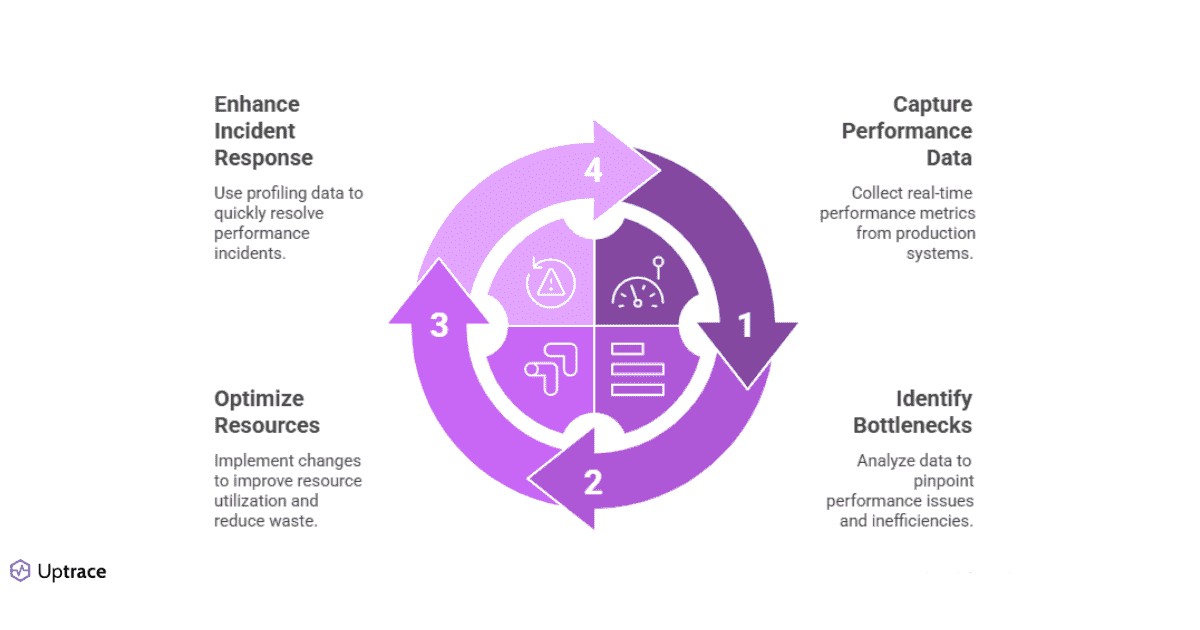
Why Continuous Profiling Matters
When your apps break in production, continuous profiling gives you the data you need to fix them fast. Unlike traditional profiling methods that require running specific tests or capturing snapshots, continuous profiling provides ongoing visibility into how your applications consume resources in real-world conditions.
The production visibility challenge
Traditional profiling requires stopping production environments or recreating problems in staging, where conditions rarely match the complexity of production systems running at scale.
Real-time performance insights
Continuous profiling captures performance data as it happens in production, enabling teams to identify bottlenecks, memory leaks, and performance regressions before they impact users.
Cost optimization opportunities
Many organizations waste 20-30% of their cloud resources on inefficient code paths - continuous profiling reveals exactly where these optimizations can be made.
Improved incident response
When performance issues occur, continuous profiling provides detailed context about exactly what code was executing during the incident, dramatically reducing debugging time.
Best Profiling Tools
Selecting the right continuous profiling tool depends on your specific technology stack, deployment model, and performance objectives. Here's a guide to the most effective tools for different needs:
| Use Case / Environment | Recommended Tools | Key Considerations |
|---|---|---|
| Go Applications | Polar Signals, Pyroscope, Parca | Look for pprof support and low overhead |
| Python Applications | Py-spy, Pyroscope, Google Cloud Profiler | Requires minimal impact on performance |
| Java/.NET Ecosystems | Pyroscope, Google Cloud Profiler, Datadog | Auto-instrumentation and JVM compatibility |
| Multi-language Environments | Datadog, Polar Signals, Pyroscope | Cross-language correlation capabilities |
| Microservices Architecture | Parca, Dynatrace, New Relic | Service dependency and correlation features |
| Kubernetes Clusters | Parca, Polar Signals, Pyroscope | eBPF-based profiling and container awareness |
| Production Environments | Py-spy, Parca, Polar Signals | Extremely low overhead (<1%) |
| Cloud-native Applications | Polar Signals, New Relic, Datadog | Distributed profiling capabilities |
| Budget-conscious Teams | Parca, py-spy, Pyroscope | Open-source options with reasonable costs |
| Enterprise Requirements | Dynatrace, Datadog, Splunk | Full-stack observability and compliance |
| Unified Observability | Uptrace, New Relic, Datadog | Integrated profiling with metrics and traces |
Dedicated Profiling Tools
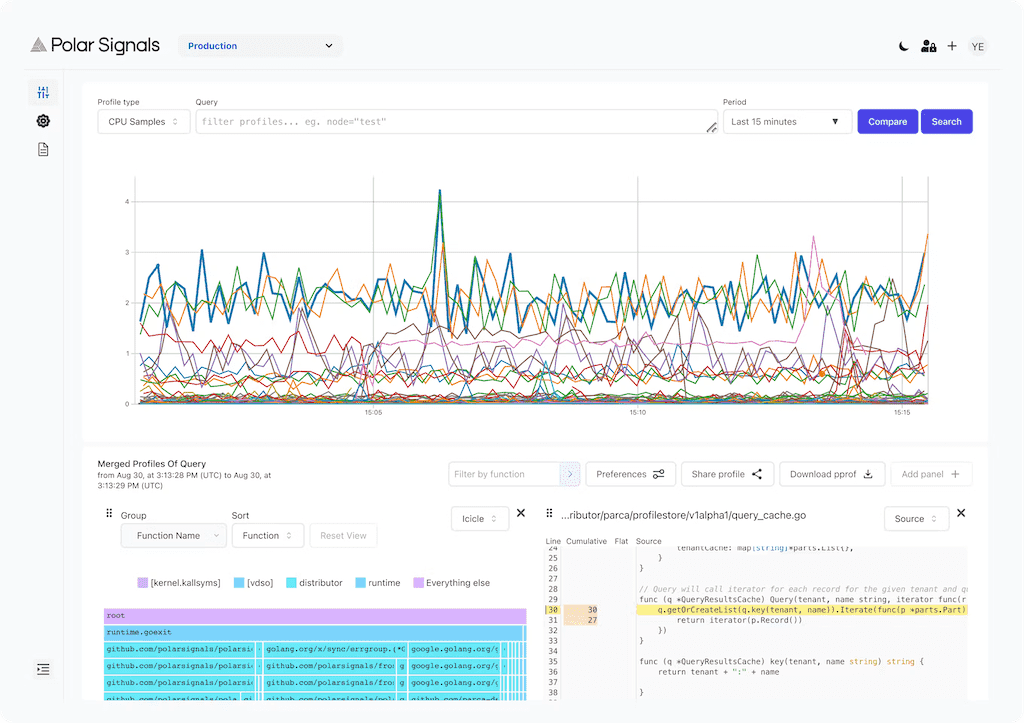
Polar Signals Cloud
Polar Signals Cloud is a zero-instrumentation continuous profiling platform built on eBPF technology. It provides system-wide profiling with extremely low overhead, making it ideal for production environments.
Best For:
- Teams prioritizing zero-instrumentation deployments
- Organizations profiling multiple programming languages
- Production environments requiring minimal overhead
- Companies seeking simple deployment models
- Teams needing system-wide performance visibility
Key Features:
- eBPF-based profiling with <1% overhead
- Support for C, C++, Go, Python, Ruby, Java, Rust, and more
- Zero code changes required
- One-command deployment for Kubernetes clusters
- Time travel capabilities for incident investigation
Potential Drawbacks:
- Commercial-only product with usage-based pricing
- More limited query capabilities compared to open-source alternatives
Key Takeaways
✓ Polar Signals offers the easiest deployment experience with zero instrumentation.
✓ eBPF technology provides system-wide profiling across all application languages.
✓ Purpose-built for production with overhead guaranteed under 1%.
✓ Time-based analysis helps identify performance regressions across deployments.
✓ Ideal for teams wanting immediate value without infrastructure complexity.
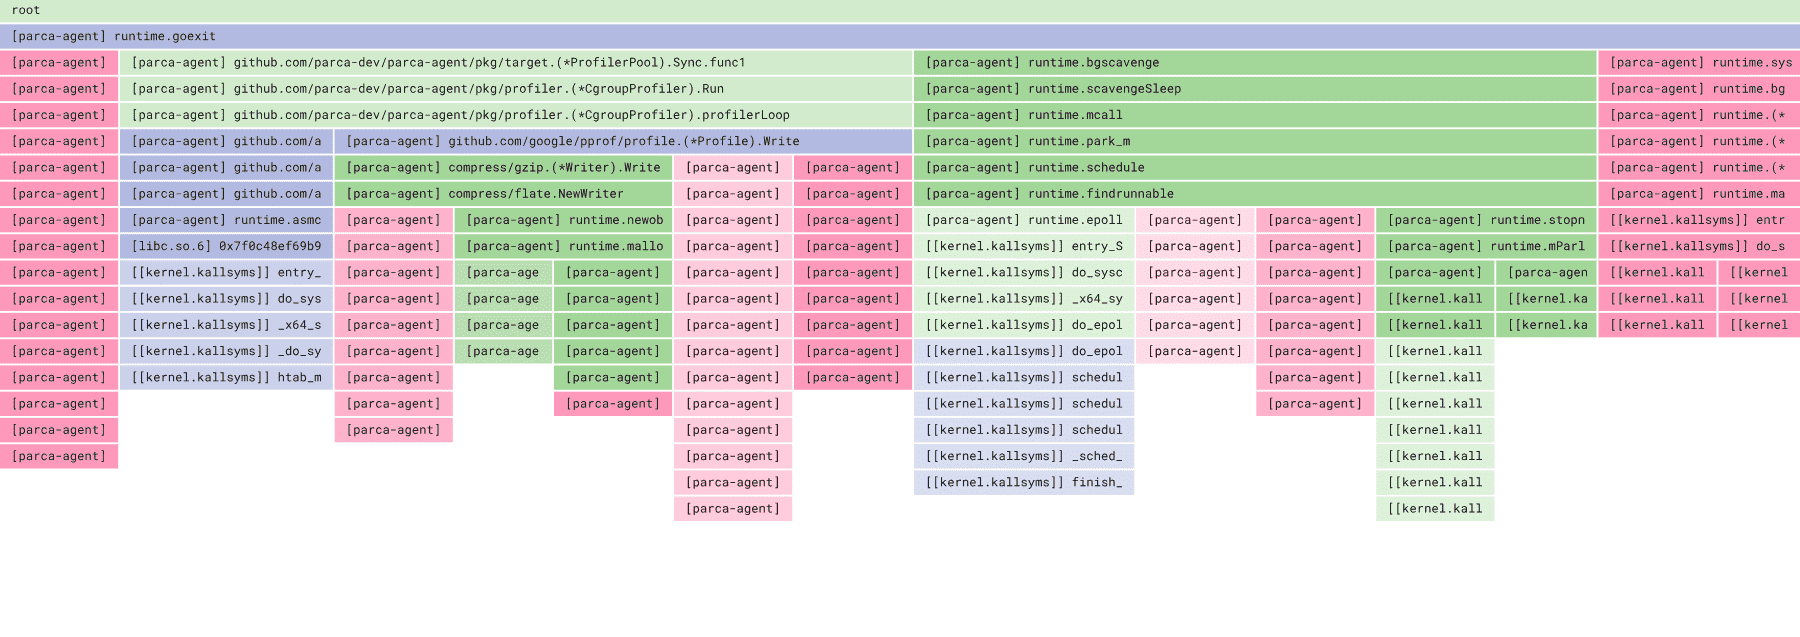
Parca
Parca is an open-source continuous profiling platform built by Polar Signals. It provides eBPF-based profiling with a focus on infrastructure-wide visibility and cost efficiency.
Best For:
- Organizations wanting open-source profiling solutions
- Kubernetes environments requiring cluster-wide profiling
- Teams with expertise to manage their own infrastructure
- Companies seeking cost-efficient profiling at scale
- Development teams needing customizable profiling solutions
Key Features:
- eBPF-based system-wide profiling
- Native Kubernetes integration with metadata enrichment
- Support for pprof format profiles
- Columnar storage for efficient data retrieval
- Open-source with Apache 2.0 license
Potential Drawbacks:
- Requires more setup and management than commercial solutions
- Steeper learning curve for configuration and operations
Key Takeaways
✓ Parca provides enterprise-grade profiling as an open-source solution.
✓ Kubernetes-native design with automatic service discovery and metadata annotation.
✓ Columnar storage enables efficient querying of large-scale profiling data.
✓ eBPF technology ensures minimal performance impact in production.
✓ Best for teams wanting control over their profiling infrastructure.
Pyroscope
Pyroscope is an open-source continuous profiling platform with broad language support and flexible deployment options. Acquired by Grafana Labs, it integrates well with existing observability stacks.
Best For:
- Multi-language environments (Go, Java, Python, Ruby, .NET)
- Organizations using the Grafana observability stack
- Teams needing both language-specific and eBPF profiling
- Companies requiring flexible deployment models
- Developers seeking visualization-rich profiling
Key Features:
- Support for multiple programming languages
- Both language-specific and eBPF profiling options
- Integration with OpenTelemetry for tracing correlation
- Grafana plugin for unified visualization
- Custom storage engine optimized for profiling data
Potential Drawbacks:
- Language-specific agents require more configuration
- Performance overhead varies by profiling method
Key Takeaways
✓ Pyroscope offers the most comprehensive language support among open-source tools.
✓ Flexible profiling methods accommodate different application requirements.
✓ Grafana integration provides seamless workflow for existing users.
✓ OpenTelemetry support enables trace-to-profile correlation.
✓ Ideal for organizations with diverse technology stacks.
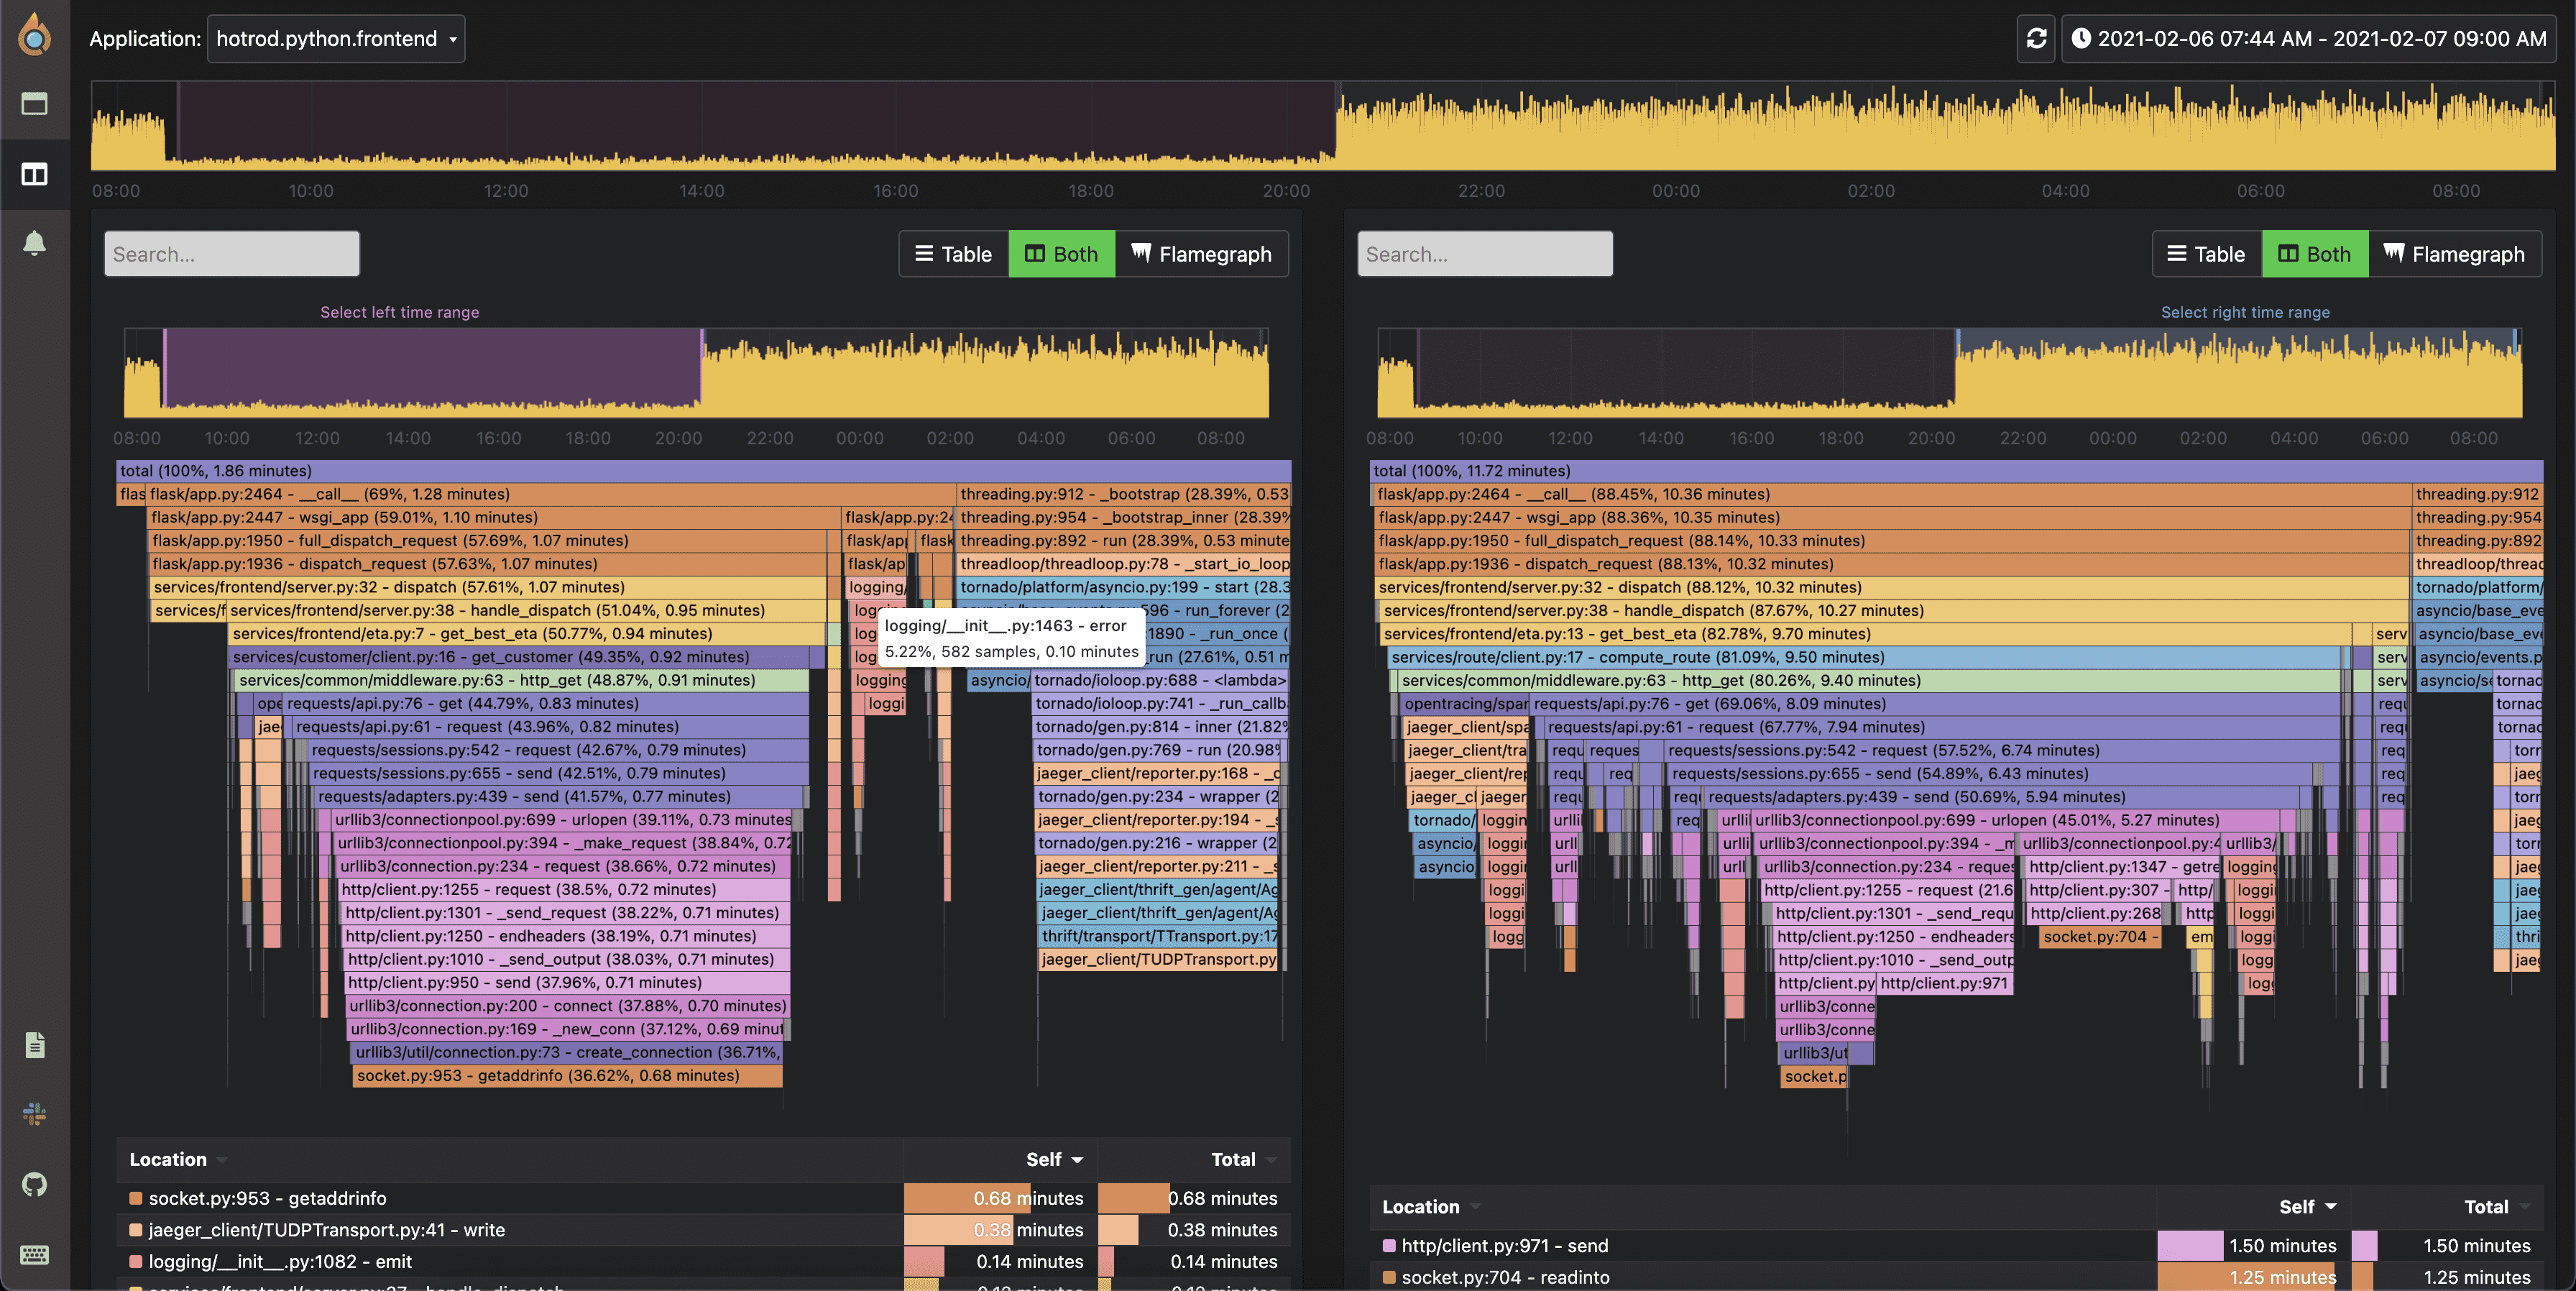
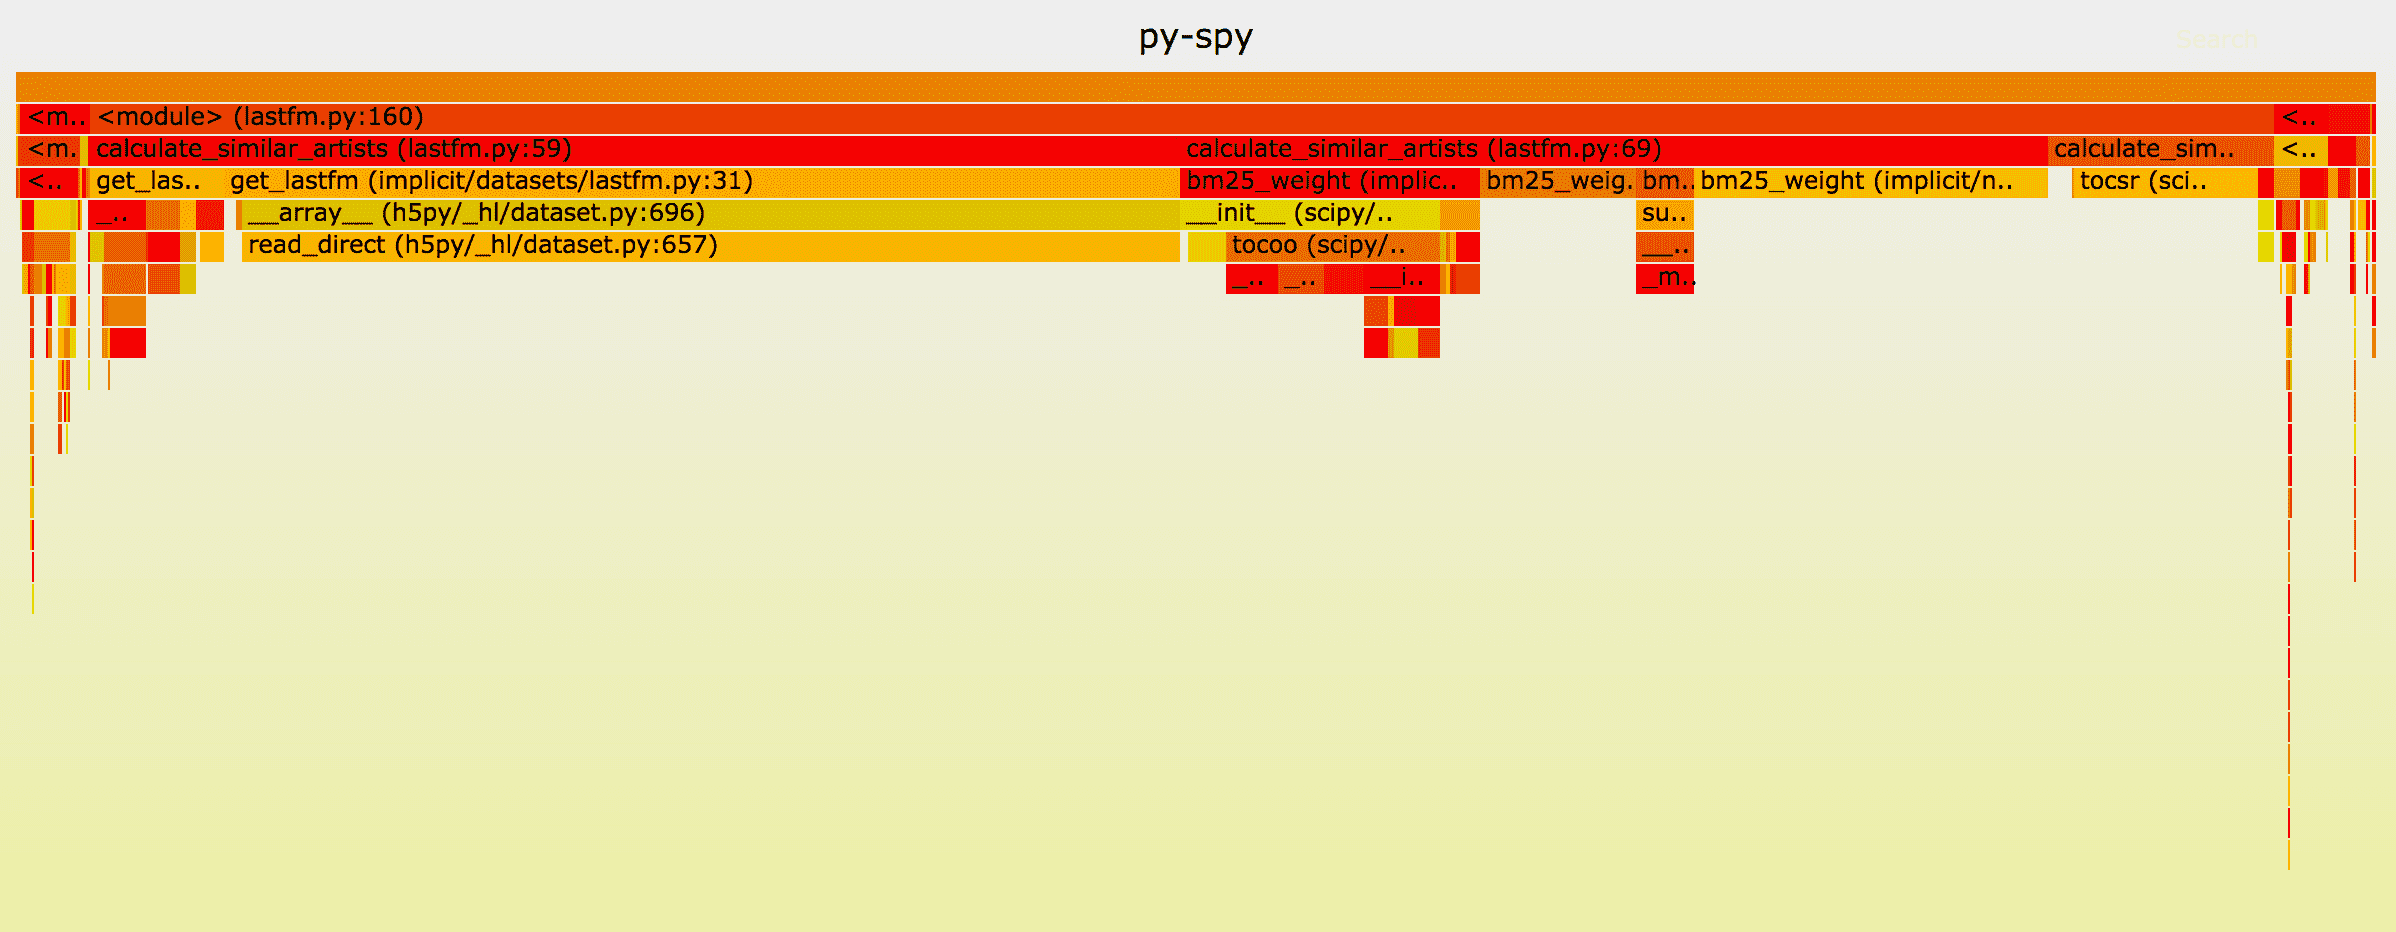
py-spy
py-spy is a specialized sampling profiler for Python applications, designed for production use with minimal overhead. Unlike traditional Python profilers, it runs as a separate process with zero code changes required.
Best For:
- Python-specific performance monitoring
- Production environments requiring non-intrusive profiling
- Teams wanting immediate Python profiling capabilities
- Development environments and production diagnostics
- Organizations running Python microservices
Key Features:
- Extremely low overhead sampling profiler
- No code changes or instrumentation required
- Fast installation and immediate results
- Multiple output formats (flamegraph, speedscope)
- Works with all recent Python versions
Potential Drawbacks:
- Limited to Python applications only
- Fewer features compared to full-stack profiling solutions
Key Takeaways
✓ py-spy provides instant Python profiling without any code modification.
✓ Designed specifically for production Python applications with minimal impact.
✓ Simple installation and immediate results make it ideal for quick diagnostics.
✓ Flame graph output provides clear visualization of performance bottlenecks.
✓ Perfect for Python teams needing focused profiling capabilities.
Profiling as Part of Observability
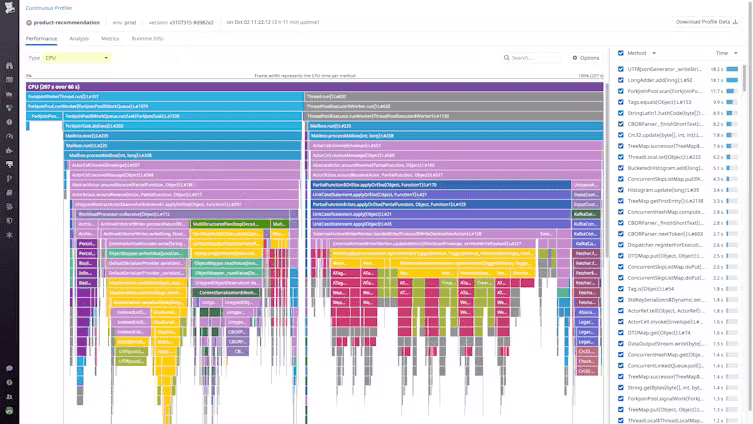
Datadog Continuous Profiler
Datadog's continuous profiling solution integrates seamlessly with their comprehensive observability platform, providing production-grade profiling across multiple languages and environments.
Best For:
- Enterprise environments with diverse technology stacks
- Organizations already using Datadog for monitoring
- Teams requiring production-safe profiling
- Companies with compliance and security requirements
- Development teams needing full-stack correlation
Key Features:
- Support for Java, Python, Go, Ruby, and more
- Integration with APM for trace-to-profile correlation
- Low-overhead production profiling
- Code hotspot identification and optimization suggestions
- Compliance-friendly with data retention controls
Potential Drawbacks:
- Enterprise pricing model
- Best value when used with full Datadog platform
Key Takeaways
✓ Datadog provides battle-tested profiling for enterprise production environments.
✓ Cross-correlation with traces and logs enables comprehensive troubleshooting.
✓ Multiple language support with language-specific optimizations.
✓ Production-safe design with configurable sampling rates.
✓ Best for organizations seeking an integrated observability platform.
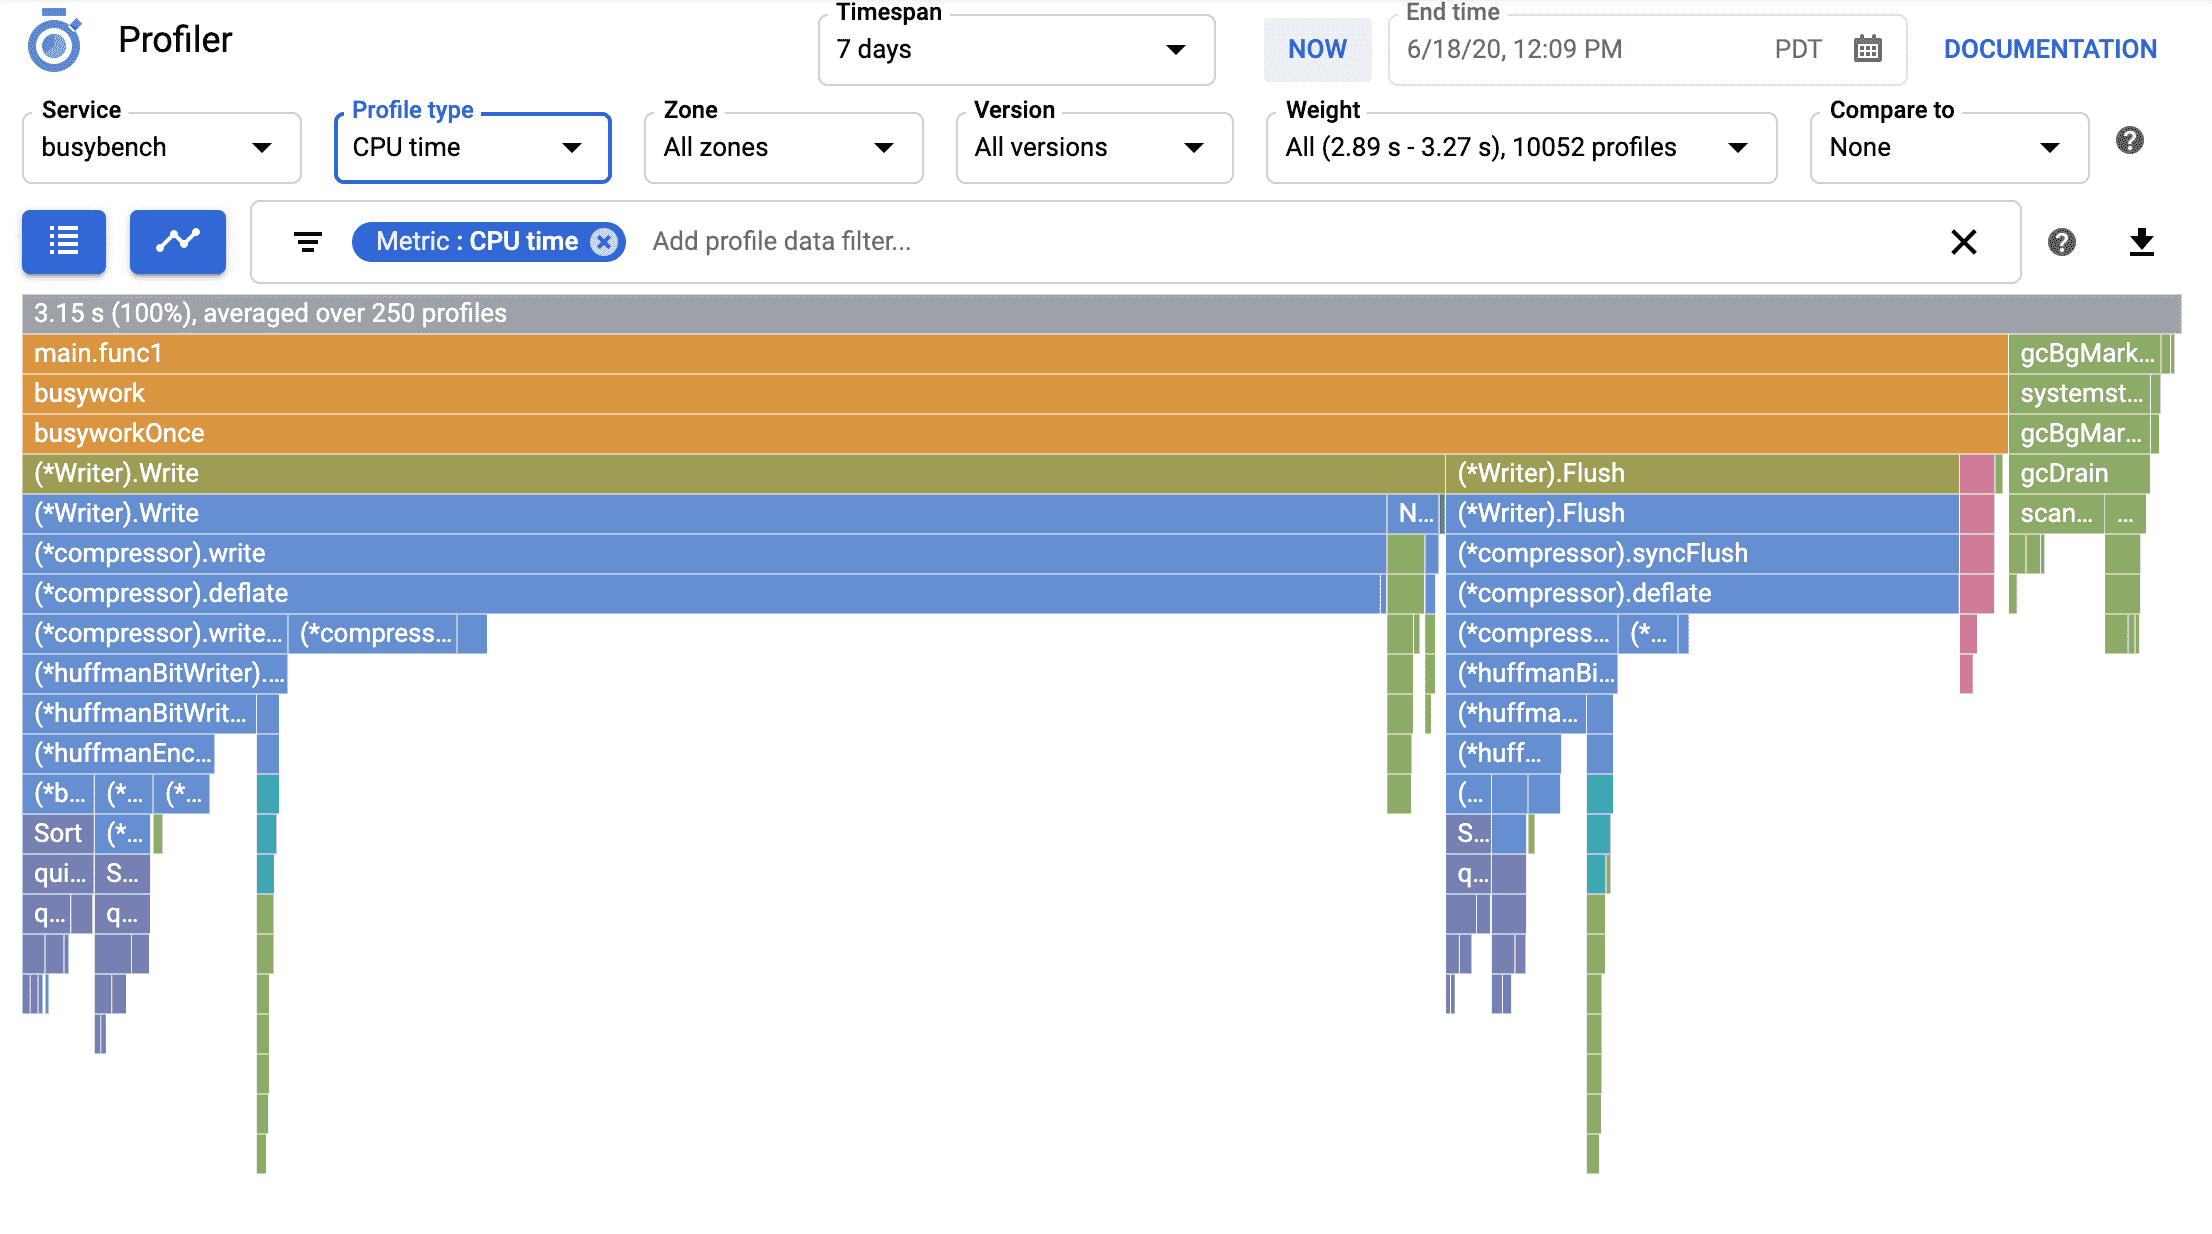
Google Cloud Profiler
Google Cloud Profiler is a statistical, low-overhead profiler that continuously gathers CPU usage and memory allocation data from production applications running on Google Cloud.
Best For:
- Applications running on Google Cloud Platform
- Teams using Java, Go, Python, or Node.js
- Organizations requiring statistical sampling profiling
- Environments where <5% overhead is acceptable
- Teams needing cloud-native profiling solutions
Key Features:
- Statistical sampling with randomized profiling periods
- Multi-language support with language-specific agents
- Integration with Google Cloud console
- Automatic profile collection from multiple instances
- Built-in comparison tools for performance analysis
Potential Drawbacks:
- Limited to Google Cloud environments
- Requires specific runtime versions
- No eBPF-based alternative for deeper insights
Key Takeaways
✓ Google Cloud Profiler excels in GCP environments with minimal configuration.
✓ Statistical sampling keeps overhead extremely low while maintaining accuracy.
✓ Built-in comparison features help identify performance regressions.
✓ Seamless integration with other Google Cloud observability tools.
✓ Ideal for organizations standardized on Google Cloud infrastructure.
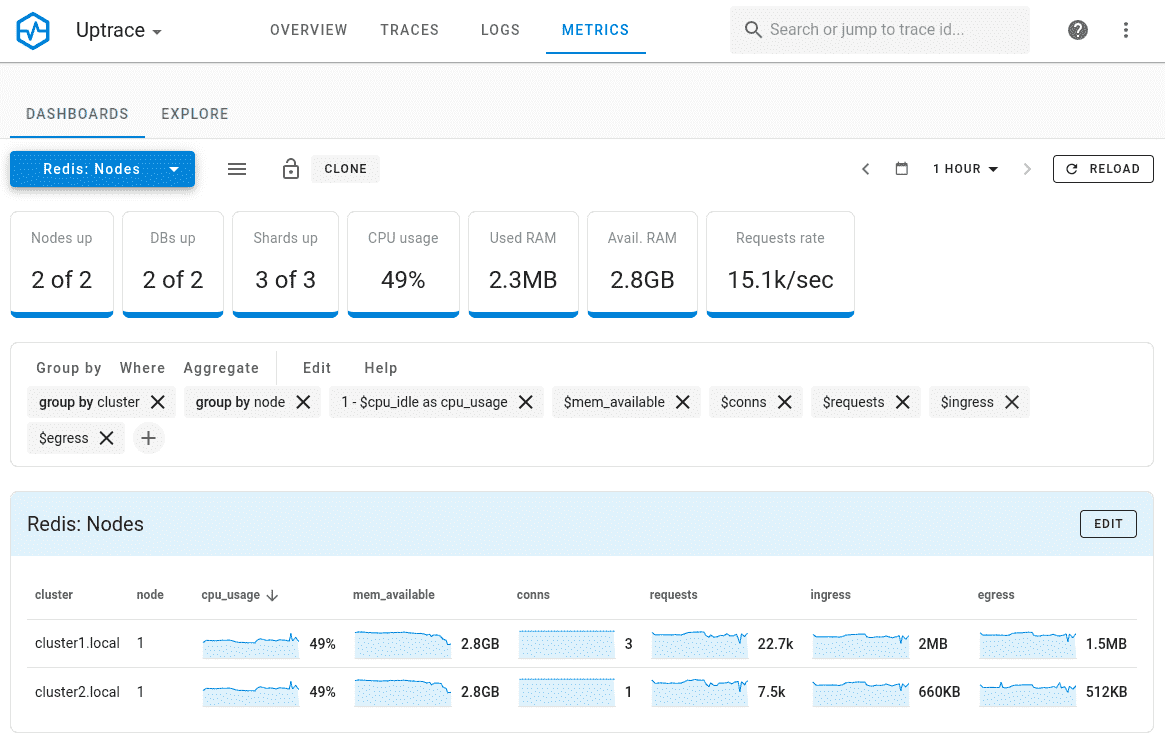
Uptrace
Uptrace is primarily an OpenTelemetry-native observability platform that includes continuous profiling for Go applications. While not a dedicated profiling tool, it provides powerful integration between profiling data and distributed tracing, making it valuable for teams wanting unified visibility.
Best For:
- Teams needing integrated profiling with OpenTelemetry traces
- Go applications requiring correlation between profiles and spans
- Organizations wanting unified observability dashboards
- Teams already using Uptrace for distributed tracing
- Companies looking for cost-effective profiling within existing observability stack
Key Features:
- Native Go continuous profiling support
- Integration with OpenTelemetry traces for span profiling
- Unified query interface for metrics, traces, and profiles
- Low overhead profiling for production environments
- SQL-powered data storage for flexible analysis
Potential Drawbacks:
- Profiling primarily focused on Go applications
- Not as specialized as dedicated profiling tools
Key Takeaways
✓ Best choice when you already use Uptrace for distributed tracing and metrics.
✓ Excellent correlation between Go profiles and OpenTelemetry traces.
✓ Integrated solution reduces tool sprawl for small teams.
✓ More budget-friendly than subscribing to separate profiling tool.
✓ Limited language support compared to dedicated profiling tools.
Choosing Continuous Profiling Tool
Selecting the ideal continuous profiling solution requires careful consideration of several factors:
| Factor | Considerations |
|---|---|
| Language Support | Programming languages used in your stack |
| Deployment Model | Cloud, on-premises, hybrid environments |
| Overhead Requirements | Performance impact acceptable in production |
| Integration Needs | Compatibility with existing observability tools |
| Team Expertise | Required knowledge for setup and operation |
| Budget Constraints | Open source vs. commercial solutions |
| Scale Requirements | Data volume and retention needs |
For Python-heavy environments, py-spy offers immediate value with minimal setup. Organizations seeking universal profiling should consider Polar Signals or Parca. Teams with diverse tech stacks may find Pyroscope or Datadog most suitable. Go applications benefit from Uptrace when already using its observability features.
Implementing Continuous Profiling
Effective continuous profiling implementation requires more than just tool selection:
- Start with baseline metrics to understand normal application behavior
- Configure appropriate sampling rates to balance overhead and accuracy
- Establish alerting thresholds for critical performance indicators
- Train teams on interpretation of profiling data and flamegraphs
- Integrate with CI/CD to catch performance regressions early
- Document performance optimizations to build organizational knowledge
Remember that continuous profiling is an ongoing process that requires commitment to analyzing and acting on the insights it provides.
Conclusion
Continuous profiling has become an essential tool for maintaining high-performance applications in production environments. The tools highlighted in this guide represent the best options available in 2025, each with unique strengths suited to different use cases.
Polar Signals and Parca lead as dedicated continuous profiling solutions, offering eBPF-based profiling with minimal overhead. py-spy excels for Python-specific needs, while Pyroscope provides comprehensive language support. Datadog and Google Cloud Profiler offer enterprise-grade features within broader observability platforms. Uptrace stands out for teams wanting integrated profiling alongside distributed tracing.
The key is selecting a tool that aligns with your specific requirements, technology stack, and organizational goals. As applications continue to grow in complexity, continuous profiling will remain crucial for understanding and optimizing performance in production environments.
FAQ
- What is continuous profiling and how does it differ from traditional profiling?
Continuous profiling automatically collects performance data from production systems at regular intervals with minimal overhead (typically <1%). Unlike traditional profiling that requires manual profiling sessions or specific test scenarios, continuous profiling provides ongoing visibility into application performance in real-world conditions. - How much overhead does continuous profiling add to production systems?
Modern continuous profiling tools are designed for production use with minimal overhead. eBPF-based tools like Polar Signals and Parca typically add less than 1% overhead, while language-specific profilers vary between 1-3% depending on configuration and sampling rates. - Can continuous profiling tools profile multiple programming languages?
Yes, though capabilities vary by tool. Pyroscope and Datadog support the broadest range of languages including Go, Java, Python, Ruby, and .NET. eBPF-based tools like Polar Signals can profile any compiled language, while specialized tools like py-spy focus on specific languages. - Is it safe to run continuous profiling in production environments?
Yes, all tools mentioned are designed for production use. They employ sampling techniques and careful resource management to ensure minimal impact. However, it's recommended to start with conservative sampling rates and monitor system behavior before increasing profiling frequency. - What types of performance issues can continuous profiling detect?
Continuous profiling can identify CPU hotspots, memory leaks, inefficient algorithms, thread contention, excessive garbage collection, and performance regressions across deployments. It's particularly effective at finding issues that only occur under production load conditions. - How much does continuous profiling cost?
Costs vary widely. Open-source options like Parca, Pyroscope, and py-spy are free to self-host. Commercial solutions like Polar Signals Cloud and Datadog use consumption-based pricing, typically charging based on data volume or number of profiled instances. Consider both licensing costs and infrastructure requirements when budgeting. - Can I correlate profiling data with other observability signals?
Yes, many modern tools offer correlation capabilities. Uptrace excels at linking profiles with distributed traces, Datadog connects profiling with APM data, and Pyroscope integrates with OpenTelemetry. This correlation is crucial for understanding performance issues in the context of specific user requests or system events. - What's the learning curve for implementing continuous profiling?
The learning curve varies by tool and team experience. Solutions like Polar Signals prioritize simplicity with one-command deployments, while self-hosted options like Parca require more setup expertise. Reading flame graphs and interpreting profiling data generally requires training, regardless of the tool chosen.
You may also be interested in: