7 Best End-to-End Monitoring Tools in 2025
What Is End-to-End Monitoring
Quick Answer: The best end-to-end monitoring tools in 2025 are Uptrace (OpenTelemetry-native), Datadog (enterprise), and Grafana Cloud (open source). Choose based on budget, team size, and vendor preference.
End-to-end monitoring (also known as end to end application monitoring, end to end application performance monitoring, or end to end performance monitoring) is the practice of observing and analyzing the full delivery chain of an application — from the end user's browser to backend services, networks, and infrastructure.
Unlike traditional APM tools that focus mainly on backend performance, end-to-end monitoring connects frontend, backend, and infrastructure signals in a single view. This helps teams understand not only what failed but also where and why.
Key data types collected include:
- Distributed traces to follow a request across services
- Metrics to monitor application and infrastructure health
- Logs to provide debugging context
- RUM (Real User Monitoring) to capture frontend performance
This holistic visibility allows engineering teams to detect performance degradation early, correlate incidents across multiple layers, and deliver more stable, faster user experiences. End-to-end monitoring is especially valuable in environments with microservices, serverless functions, and multi-cloud deployments.
Why It Matters
Modern systems are complex: microservices, serverless, multi-cloud, and edge architectures. Monitoring only one layer no longer works and problems often appear at the intersection of services.
End-to-end monitoring addresses this by:
- Correlating data sources across frontend, backend, and infrastructure
- Reducing blind spots that occur with isolated monitoring tools
- Supporting open standards like OpenTelemetry for better interoperability
As organizations adopt open standards and hybrid architectures, end-to-end monitoring becomes a foundation for reliable performance and incident response.
Key Capabilities of End-to-End Monitoring Tools
- Full-stack visibility across apps, infra, and frontend
- Real-time tracing and error analysis
- Metrics collection and alerting
- Log aggregation and correlation
- RUM integration for frontend performance
- OpenTelemetry compatibility
- Flexible deployment (SaaS or self-hosted)
🏆 Top 7 End-to-End Monitoring Tools in 2025
Uptrace
Type: OpenTelemetry-native observability platform
Deployment: Self-hosted or SaaS
Best for: Teams wanting OpenTelemetry-native observability without vendor lock-in
Uptrace APM focuses on full-stack observability without vendor lock-in. Built around OpenTelemetry from the ground up, it ingests traces, metrics, logs, and RUM data without requiring proprietary agents. The platform uses ClickHouse as a storage engine, enabling fast queries even at scale.
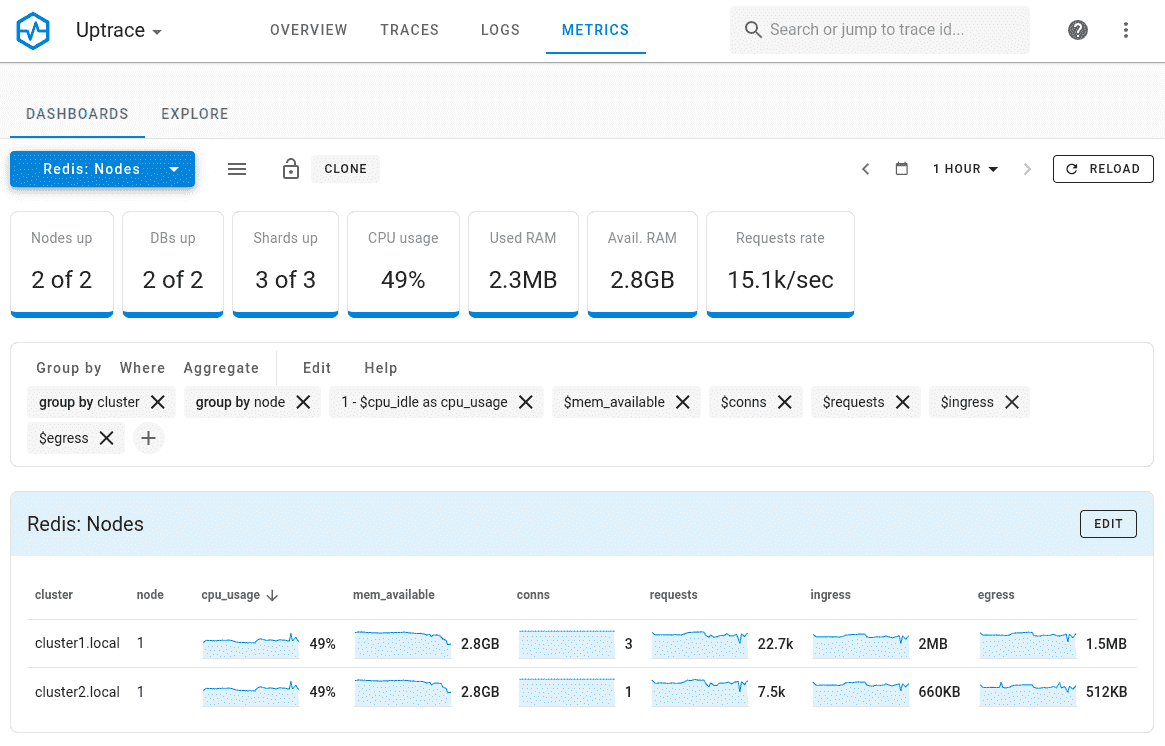
Key strengths:
- Native OpenTelemetry support (no translation layers)
- Unified view of traces, metrics, logs, and RUM
- Lightweight and cost-efficient
- Open source + managed cloud
Limitations:
- Smaller integration ecosystem compared to enterprise tools
- Requires some setup for advanced alerting and automation
Datadog
Type: Enterprise SaaS monitoring platform
Best for: Large enterprises needing comprehensive integrations and support
Datadog offers a comprehensive end-to-end monitoring solution that combines APM, infrastructure metrics, logs, security, RUM, and synthetic monitoring. Known for its broad integration ecosystem and strong dashboards, it's widely used by large engineering teams.
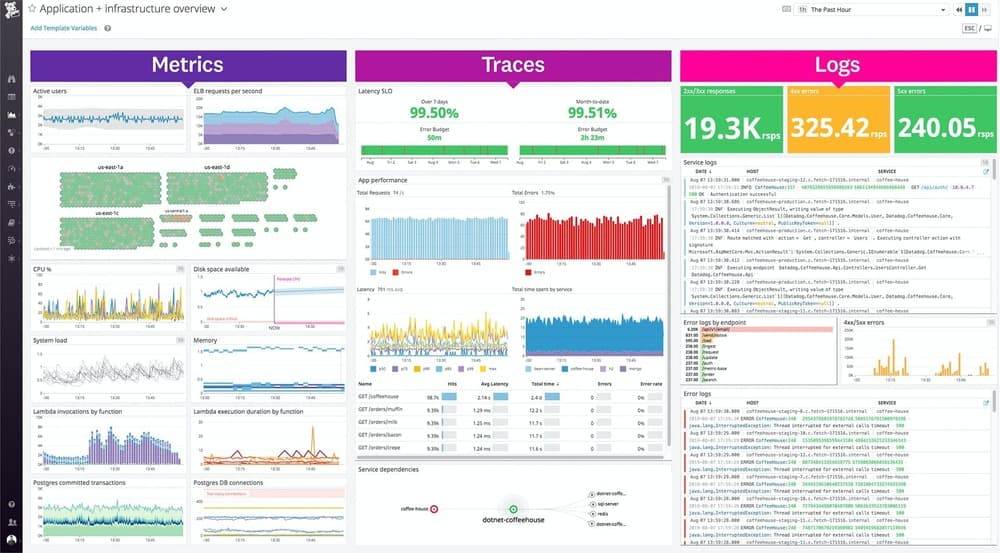
Key strengths:
- Rich integrations and plugins
- All-in-one platform (APM, infra, RUM, security)
- Real-time alerting and anomaly detection
Limitations:
- Vendor lock-in and proprietary agents
- Can become expensive at scale
Dynatrace
Type: Enterprise observability platform
Best for: Large-scale deployments requiring AI-driven automation
Dynatrace uses AI-powered monitoring and automated instrumentation to provide deep visibility into large-scale distributed systems. Its OneAgent automatically discovers components, and the Davis AI engine helps detect root causes.
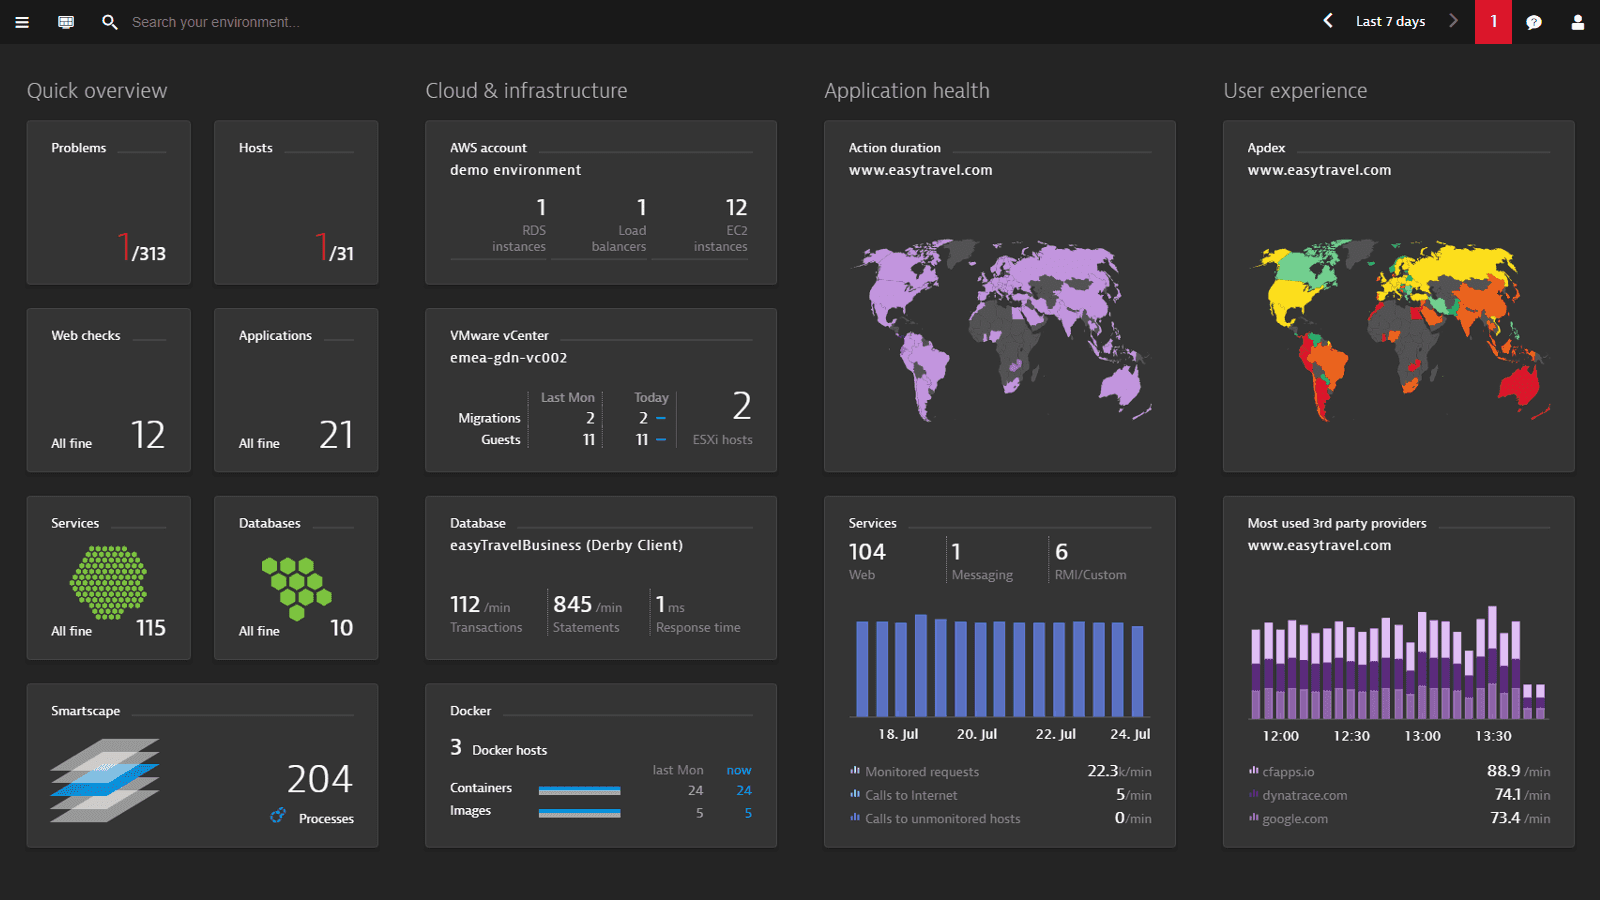
Key strengths:
- Automatic instrumentation
- Strong AI-driven analysis
- Deep application and infrastructure insights
Limitations:
- High cost for large deployments
- Heavily tied to its proprietary agent
Grafana Cloud
Type: Open source observability stack (managed)
Best for: Teams already using Prometheus or Grafana
Grafana Cloud offers a managed version of the popular open source stack: Prometheus (metrics), Loki (logs), Tempo (traces), and Grafana dashboards. It's ideal for teams already using Prometheus or Grafana.
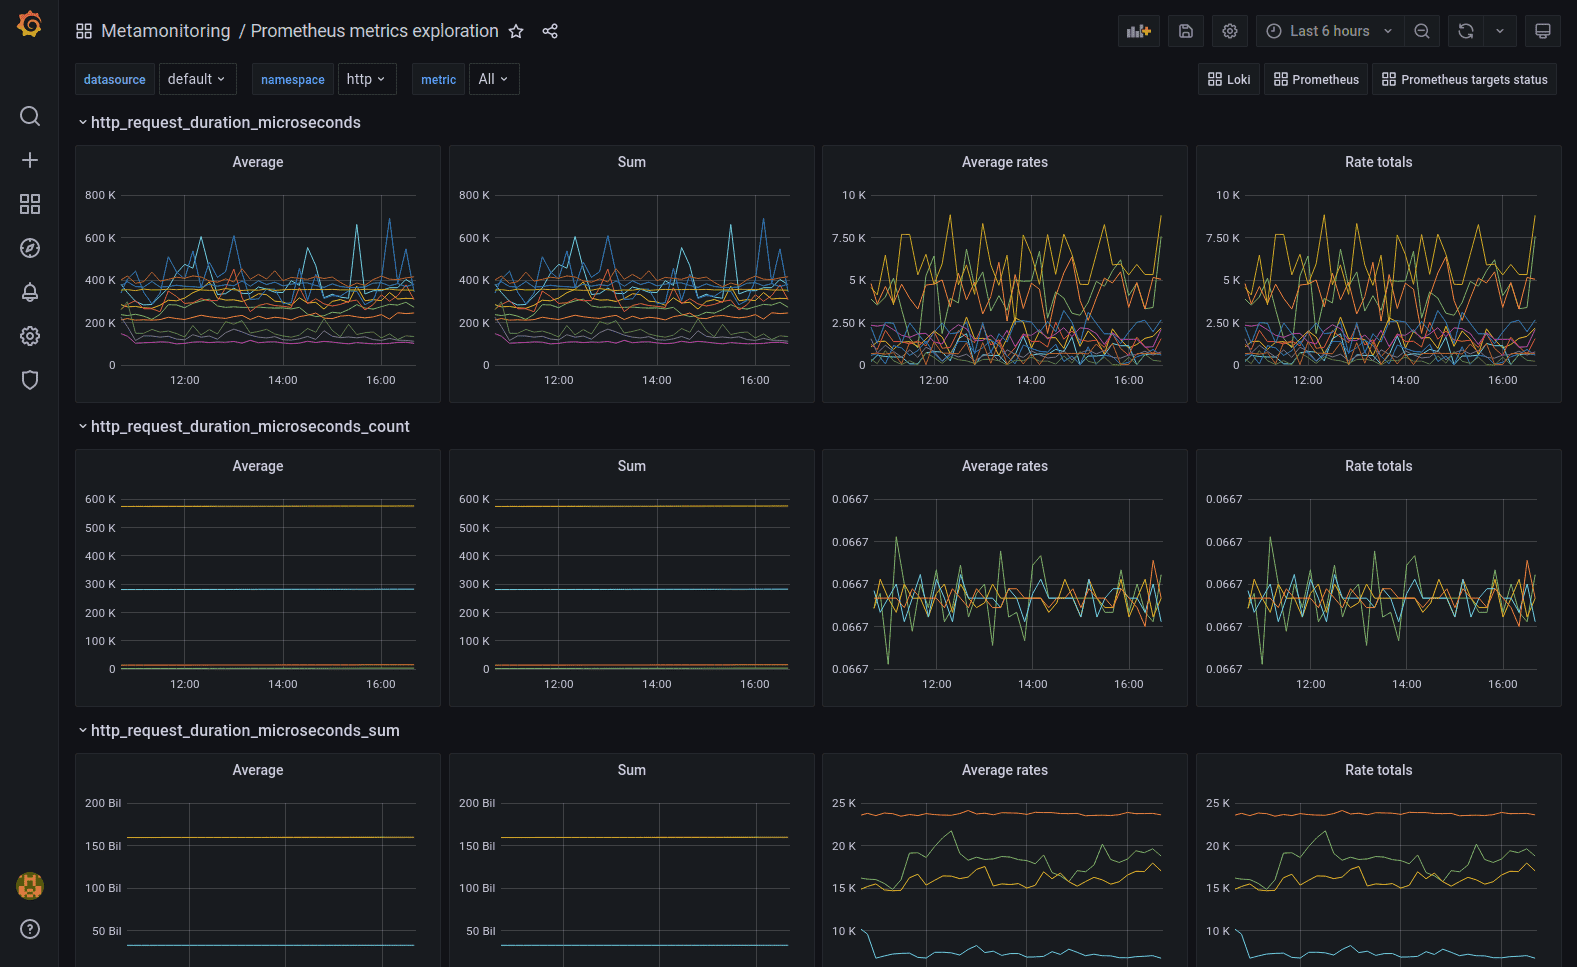
Key strengths:
- True open source foundations
- Strong visualization capabilities
- Good OpenTelemetry compatibility
Limitations:
- Requires PromQL/LogQL knowledge
- Can get complex at scale
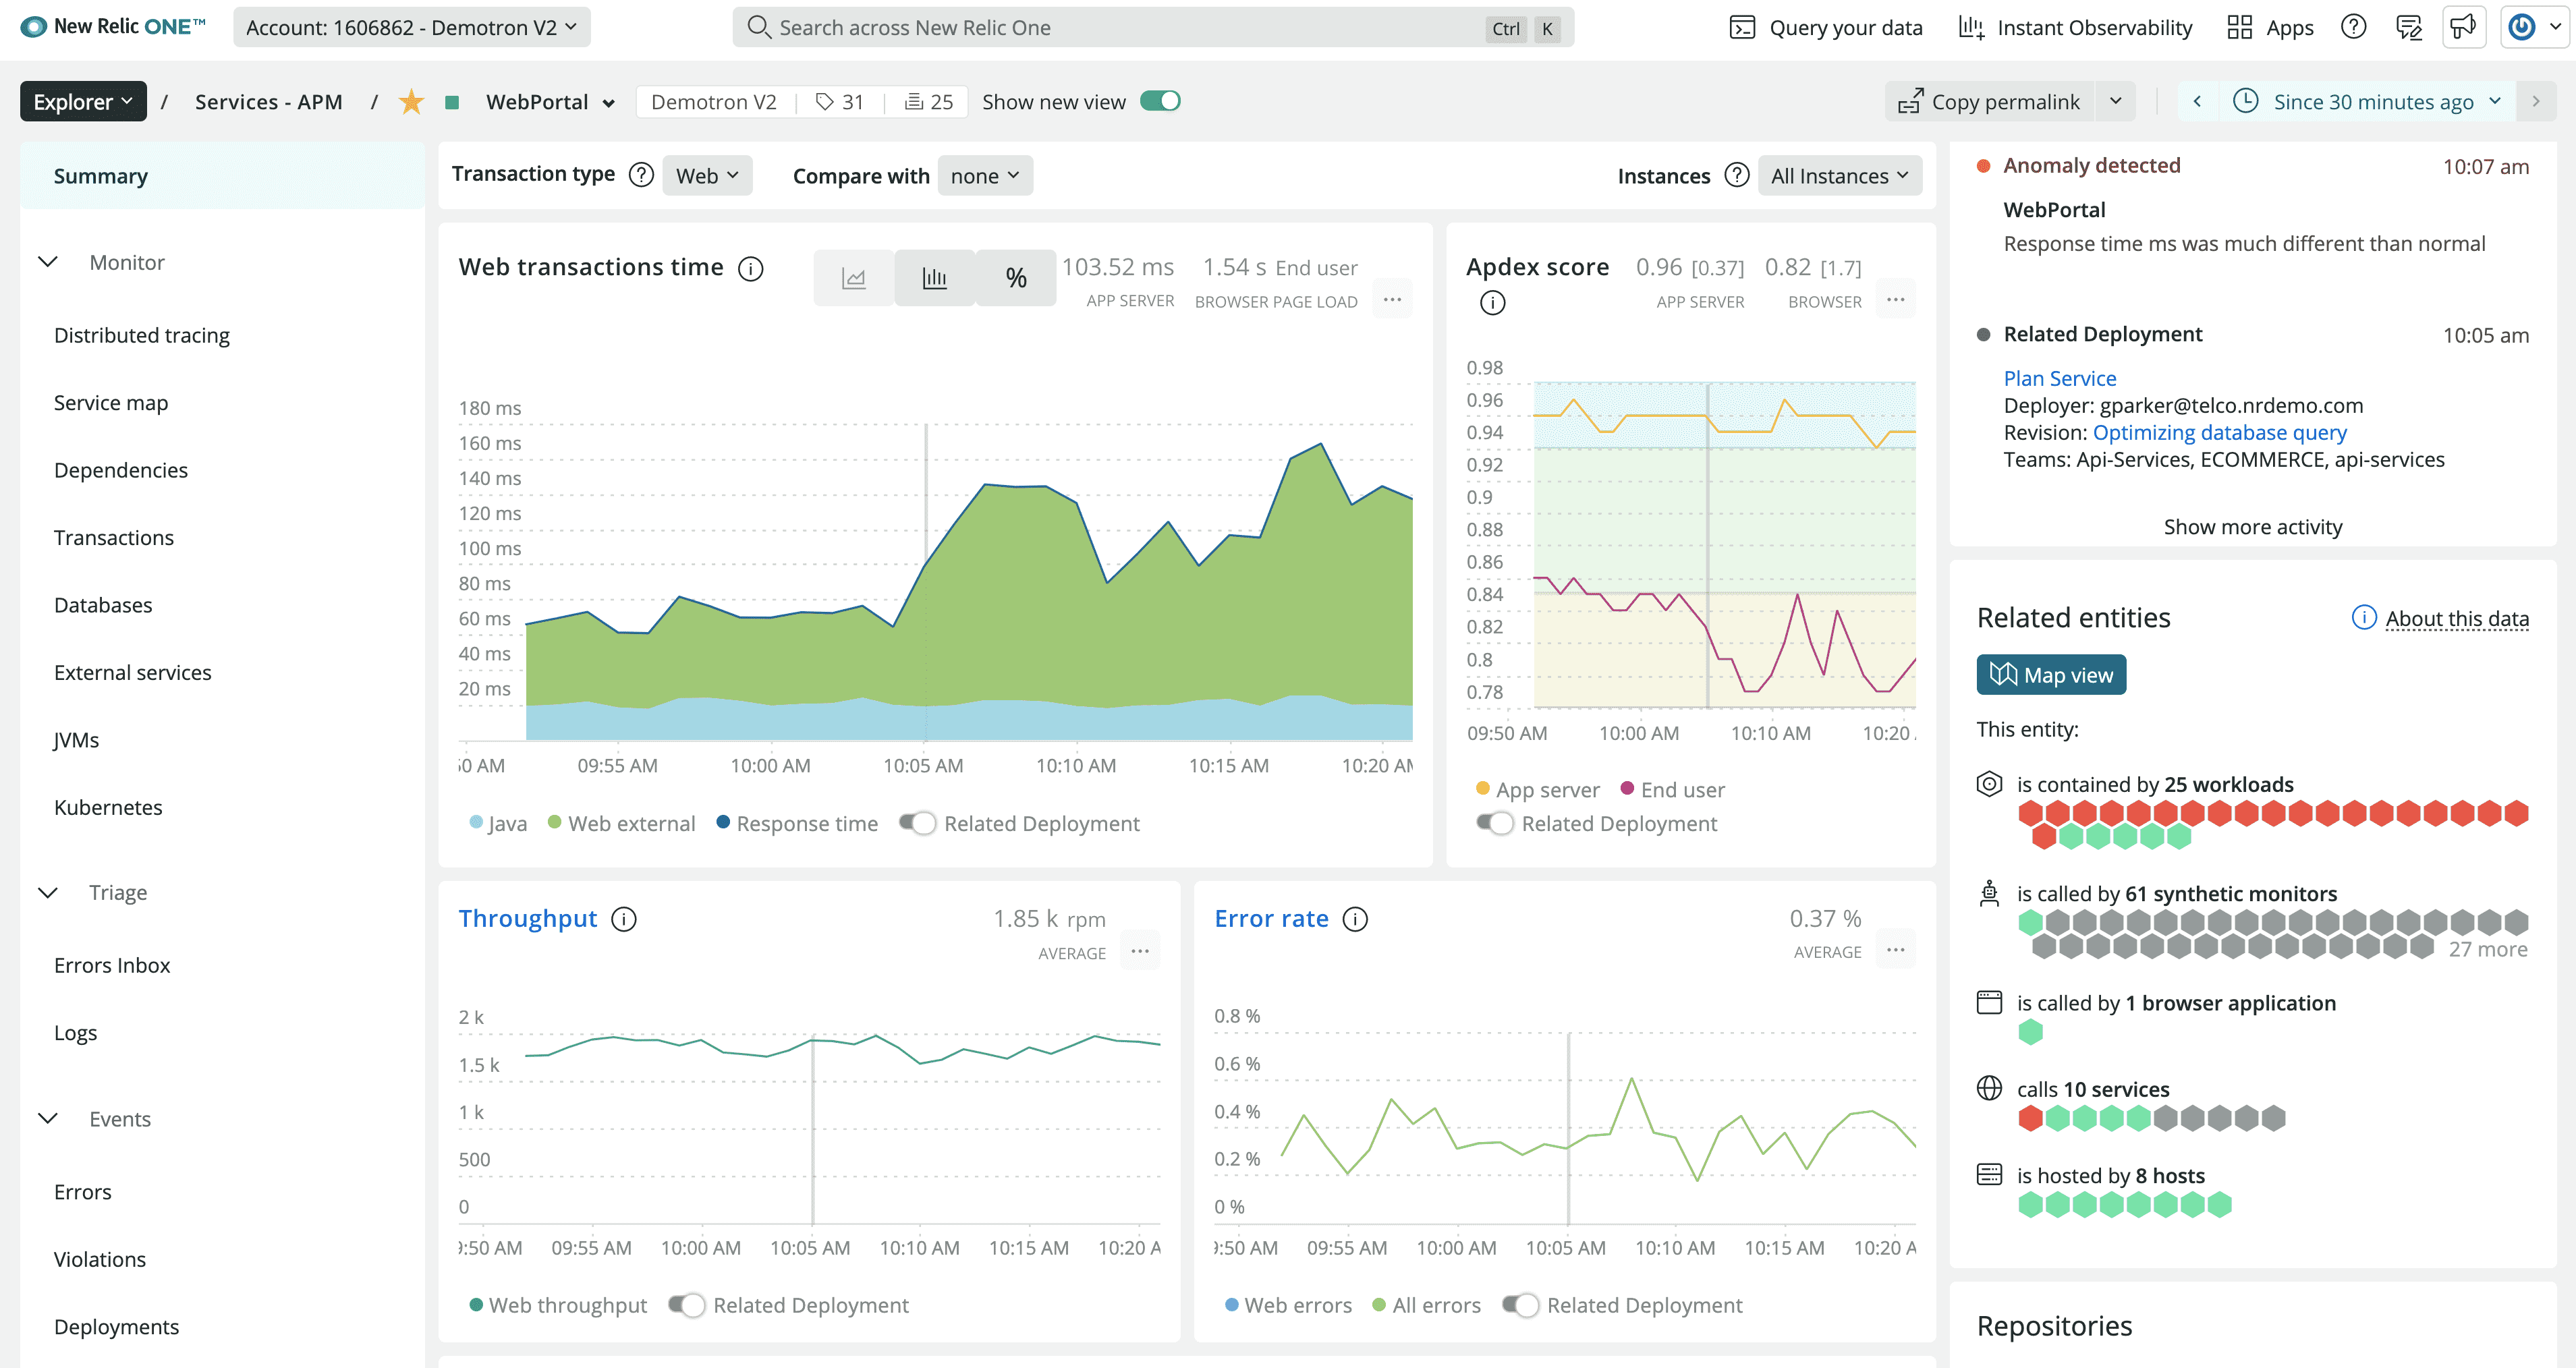
New Relic
Type: Commercial observability platform
Best for: Mid-size teams wanting an all-in-one solution with a generous free tier
New Relic provides a unified observability platform with strong support for APM, infrastructure monitoring, logs, RUM, and synthetic checks. It supports OpenTelemetry ingestion and is widely adopted by mid-size and enterprise teams.
Key strengths:
- OpenTelemetry support
- Generous free tier
- Good coverage across frontend and backend
Limitations:
- Per-user pricing can limit access for larger teams
- UI complexity
AppDynamics
Type: Enterprise APM
Best for: Enterprises focused on business transaction monitoring
AppDynamics (owned by Cisco) focuses primarily on APM with strong application mapping, business transaction monitoring, and alerting capabilities. It integrates with backend, frontend, and infrastructure layers.
Key strengths:
- Strong APM and transaction mapping
- Enterprise-grade support
- Good visibility into backend performance
Limitations:
- Less flexible than modern OpenTelemetry-based tools
- High enterprise pricing
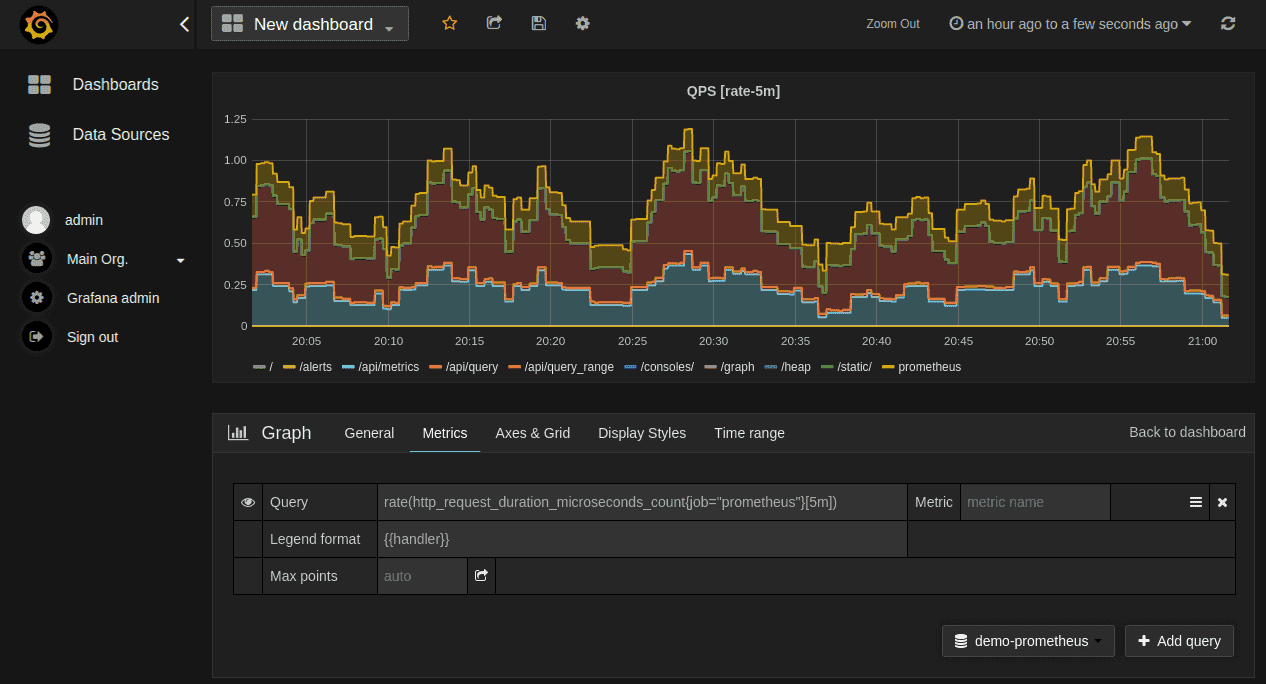
Prometheus + Grafana
Type: DIY observability stack
Best for: Teams wanting full control and avoiding vendor lock-in
The combination of Prometheus and Grafana remains a popular choice for teams wanting full control over their stack. It provides powerful metrics collection, alerting, and visualization — and can be extended with tracing (Tempo) and logging (Loki).
Key strengths:
- Fully open source
- Flexible and extensible
- Ideal for infrastructure and backend monitoring
Limitations:
- High operational overhead
- Requires manual integration of components
Feature Comparison Table
| Tool | OpenTelemetry | Traces | Metrics | Logs | RUM | Self-Host | SaaS | Best For |
|---|---|---|---|---|---|---|---|---|
| Uptrace | ✅ Native | ✅ | ✅ | ✅ | ✅ | ✅ | ✅ | OpenTelemetry-native teams |
| Datadog | ⚠️ Partial | ✅ | ✅ | ✅ | ✅ | ❌ | ✅ | Enterprise all-in-one |
| Dynatrace | ⚠️ Partial | ✅ | ✅ | ✅ | ✅ | ❌ | ✅ | AI-driven automation |
| Grafana Cloud | ✅ | ✅ | ✅ | ✅ | ✅ | ⚠️ | ✅ | Open source stack users |
| New Relic | ✅ | ✅ | ✅ | ✅ | ✅ | ❌ | ✅ | Startups with free tier needs |
| AppDynamics | ⚠️ Partial | ✅ | ✅ | ✅ | ⚠️ | ❌ | ✅ | Business transaction monitoring |
| Prometheus+Grafana | ✅ (via OTel) | ⚠️ | ✅ | ⚠️ | ❌ | ✅ | ❌ | Full control, no vendor lock-in |
How to Choose the Right End-to-End Monitoring Tool
Selecting the right monitoring tool depends on your technical requirements, team size, and budget constraints.
For small teams and startups:
Start with tools that offer generous free tiers or low operational overhead. New Relic and Grafana Cloud are solid choices. If you're already using OpenTelemetry, Uptrace provides a cost-efficient path without vendor lock-in.
For mid-size teams:
Look for platforms that balance features with cost. Uptrace and Grafana Cloud work well here, especially if you value open standards. Datadog is a strong option if you need extensive integrations and are willing to pay for them.
For enterprises:
Prioritize platforms with strong support, compliance features, and enterprise-grade SLAs. Datadog, Dynatrace, and AppDynamics are built for this scale, though they come with higher costs. If avoiding vendor lock-in is critical, consider Uptrace or self-hosted Prometheus + Grafana.
Key decision factors:
- Budget: Self-hosted solutions (Uptrace, Prometheus) are cheaper at scale; SaaS tools have predictable pricing but can get expensive
- Team expertise: Grafana and Prometheus require more hands-on management; Datadog and Dynatrace are easier to adopt
- OpenTelemetry commitment: If you're invested in OpenTelemetry, choose native-first tools like Uptrace or Grafana Cloud
- Vendor lock-in tolerance: Proprietary platforms (Datadog, Dynatrace) make migration harder; open standards reduce risk
FAQ
What is an example of end-to-end monitoring?
End-to-end monitoring might include collecting frontend performance metrics through RUM (Real User Monitoring) tools, tracing API calls through microservices, measuring infrastructure resource usage, and correlating it all into one view.
How does end-to-end monitoring differ from APM?
APM typically focuses on application performance. End-to-end monitoring includes frontend, network, infrastructure, and external dependencies — offering a more complete view.
How much does end-to-end monitoring cost?
Pricing varies by platform and data volume. Open source solutions like Prometheus or Uptrace self-hosted can be cost-efficient, while enterprise SaaS tools may charge by data volume, host, or user.
Can I build end-to-end monitoring with OpenTelemetry?
Yes. OpenTelemetry provides the instrumentation layer to collect traces, metrics, and logs from multiple services and send them to a backend like Uptrace, Grafana, or Datadog.
What's the best tool for small teams?
For small teams, Uptrace or Grafana Cloud can be good options due to their flexibility, OpenTelemetry compatibility, and lower operational overhead.
Final Thoughts
End-to-end monitoring has become a critical capability for modern systems. With growing system complexity, teams need visibility across the entire stack — frontend, backend, network, and infrastructure.
Open standards like OpenTelemetry make it possible to build or adopt monitoring solutions without being tied to a single vendor. Platforms like Uptrace offer open, flexible observability, while enterprise SaaS tools like Datadog and Dynatrace deliver integrated, ready-to-use solutions.
The best choice depends on your team's size, budget, and control requirements. But one thing is clear — end-to-end monitoring is no longer optional. It's the backbone of reliable, performant systems in 2025.
Ready to start? Try Uptrace free.