Top 5 Real User Monitoring Tools in 2025
What Is Real User Monitoring
Real User Monitoring (RUM) — also known as RUM monitoring, user monitoring, or browser monitoring — is a method for capturing and analyzing real user data directly from browsers and devices in production environments. This solution, often referred to as RUM real user monitoring, provides engineering teams with precise insight into frontend performance and user experience. Unlike synthetic monitoring, which relies on scripted probes, RUM measures real page load times, JavaScript execution, errors, network behavior, and Core Web Vitals from real browsers and devices.
This data gives engineering teams:
- Detailed visibility into frontend performance in production.
- Clear understanding of how performance differs by device, browser, or location.
- The ability to connect frontend issues with backend traces or logs through OpenTelemetry.
RUM data is collected using a small script embedded in the site or application. That script passively reports metrics and events to the monitoring platform, allowing teams to monitor user experience without active testing. In 2025, RUM tools are used not only for basic page timing but also for real-time session replay, error correlation, and advanced UX analysis.
Why RUM Matters
Modern websites and applications are expected to load fast, stay stable, and work across every device. RUM plays a central role in meeting these expectations because it reflects the real world — not controlled test conditions. This makes it one of the most valuable data sources for engineering, product, and marketing teams alike.
Real user monitoring gives direct visibility into how applications perform in real-world conditions. It complements APM solutions and synthetic monitoring by showing what users actually experience, not just what tests predict.
Real Data vs. Synthetic Checks
Synthetic probes simulate user behavior, but they run in controlled environments. RUM tools capture actual page load times, network conditions, and browser behavior from real users. This helps detect issues that synthetic tests miss — such as regional latency spikes, CDN routing problems, and inconsistent rendering on mobile devices.
Early Detection of User-Facing Issues
Frontend performance directly affects user engagement and revenue. With RUM monitoring and frontend monitoring tools, teams can catch slow pages, JavaScript errors, and rendering issues in production before they escalate into widespread incidents.
OpenTelemetry and Integration
RUM solutions integrate with OpenTelemetry APM, making data portable and vendor-neutral. This allows teams to feed real user monitoring data into existing observability pipelines, correlate frontend issues with backend traces, and analyze user experience monitoring in a single place.
Key Features of RUM Platforms
Real user monitoring tools provide a mix of performance, error visibility, and user journey insight. Top solutions offer much more than basic page load timing. Key capabilities include:
- Core Web Vitals tracking — LCP, CLS, and FID remain the most important real-world performance metrics for SEO and UX.
- Real-time session replay — See how users actually interact with your website or application, click by click.
- User journey mapping — Follow the path users take, identify drop-offs and bottlenecks.
- Geo and device segmentation — Understand performance differences by region, device type, and browser.
- Error and exception tracking — Get stack traces, trends, and alerts for JavaScript issues.
- Alerting and integrations — Tie performance data to APM, OpenTelemetry pipelines, and incident management systems.
Top 5 Real User Monitoring Tools
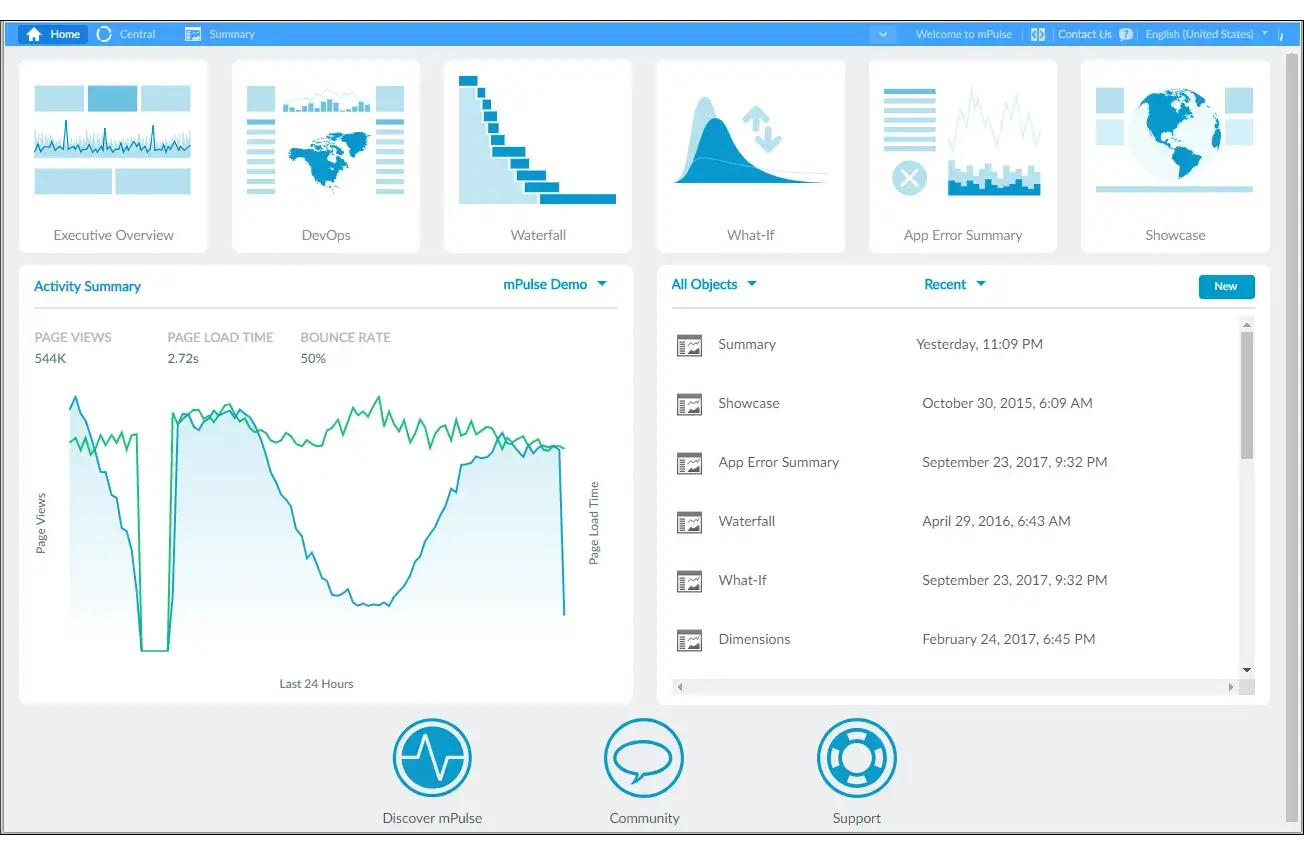
Akamai mPulse
Best for: Teams that prioritize frontend performance and detailed user experience metrics.
Akamai mPulse is a dedicated RUM platform focused on browser performance data and real user behavior. It excels at collecting and analyzing Core Web Vitals at scale, giving teams detailed visibility into how pages load and render in production.
- Pricing: Custom, volume-based
- Key features:
- Real-time Core Web Vitals tracking
- Geo and device segmentation
- Session metrics and navigation timing
- Strong data visualization and reporting
✅ Highly accurate frontend performance data
✅ Ideal for optimizing UX at scale
❌ Enterprise-oriented pricing
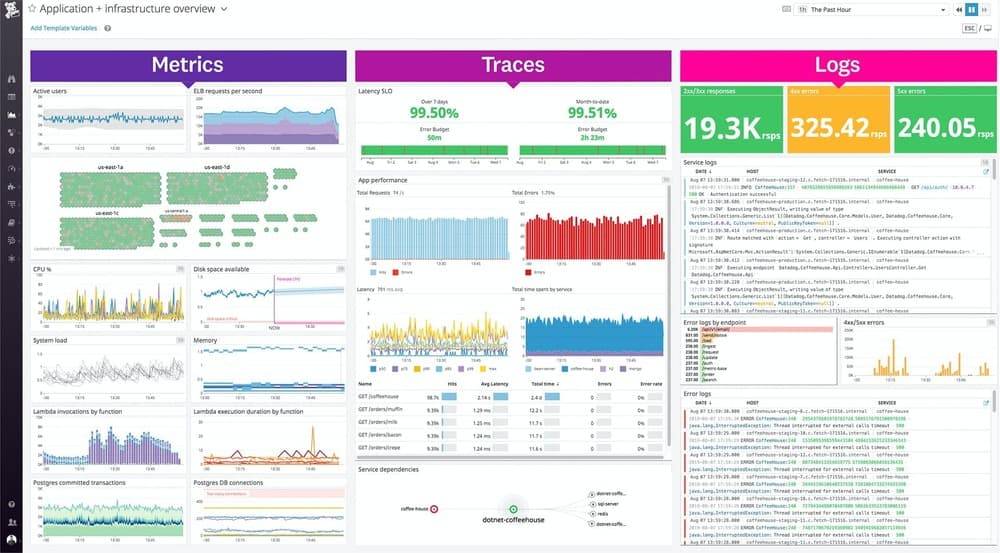
Datadog
Best for: Large organizations needing deep visibility and advanced dashboards.
Datadog integrates RUM with APM, infrastructure, and security monitoring, making it a strong option for enterprises.
- Pricing: ~$1.50–2.00 per 1,000 sessions
- Key features:
- Real-time browser and mobile RUM
- Geo performance visualization
- Advanced alerting and incident workflows
✅ Strong ecosystem and enterprise integrations
✅ Excellent visualization capabilities
❌ Can get expensive at scale
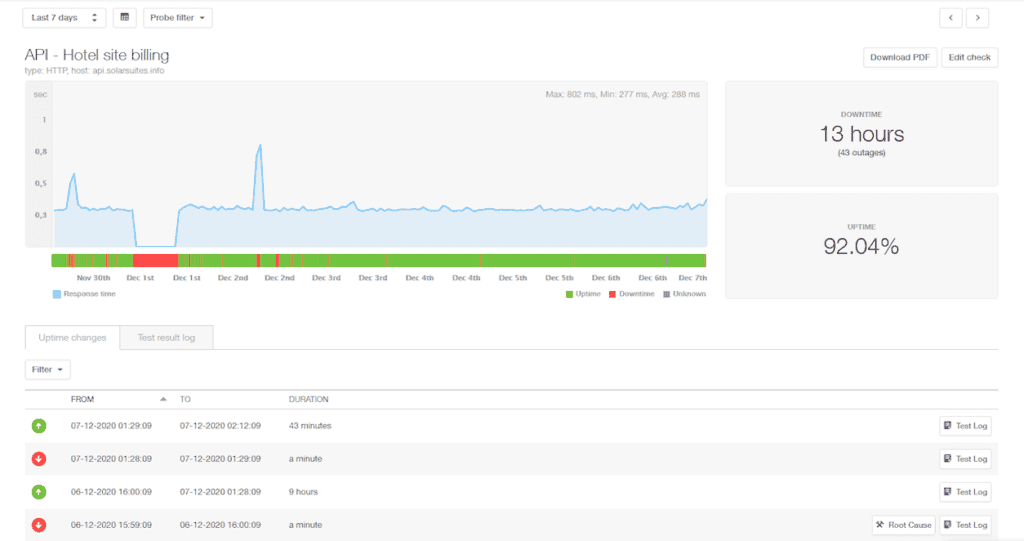
Pingdom
Best for: Teams focused on performance visibility without complex setup.
Pingdom offers simple, reliable RUM features alongside synthetic checks. It's a popular choice for small to mid-size teams that want actionable performance data.
- Pricing: from $15/month
- Key features:
- Real-time frontend performance tracking
- Easy setup and reporting
- Strong alerting features
✅ Fast onboarding
✅ Good for teams without large observability stacks
❌ Limited advanced functionality
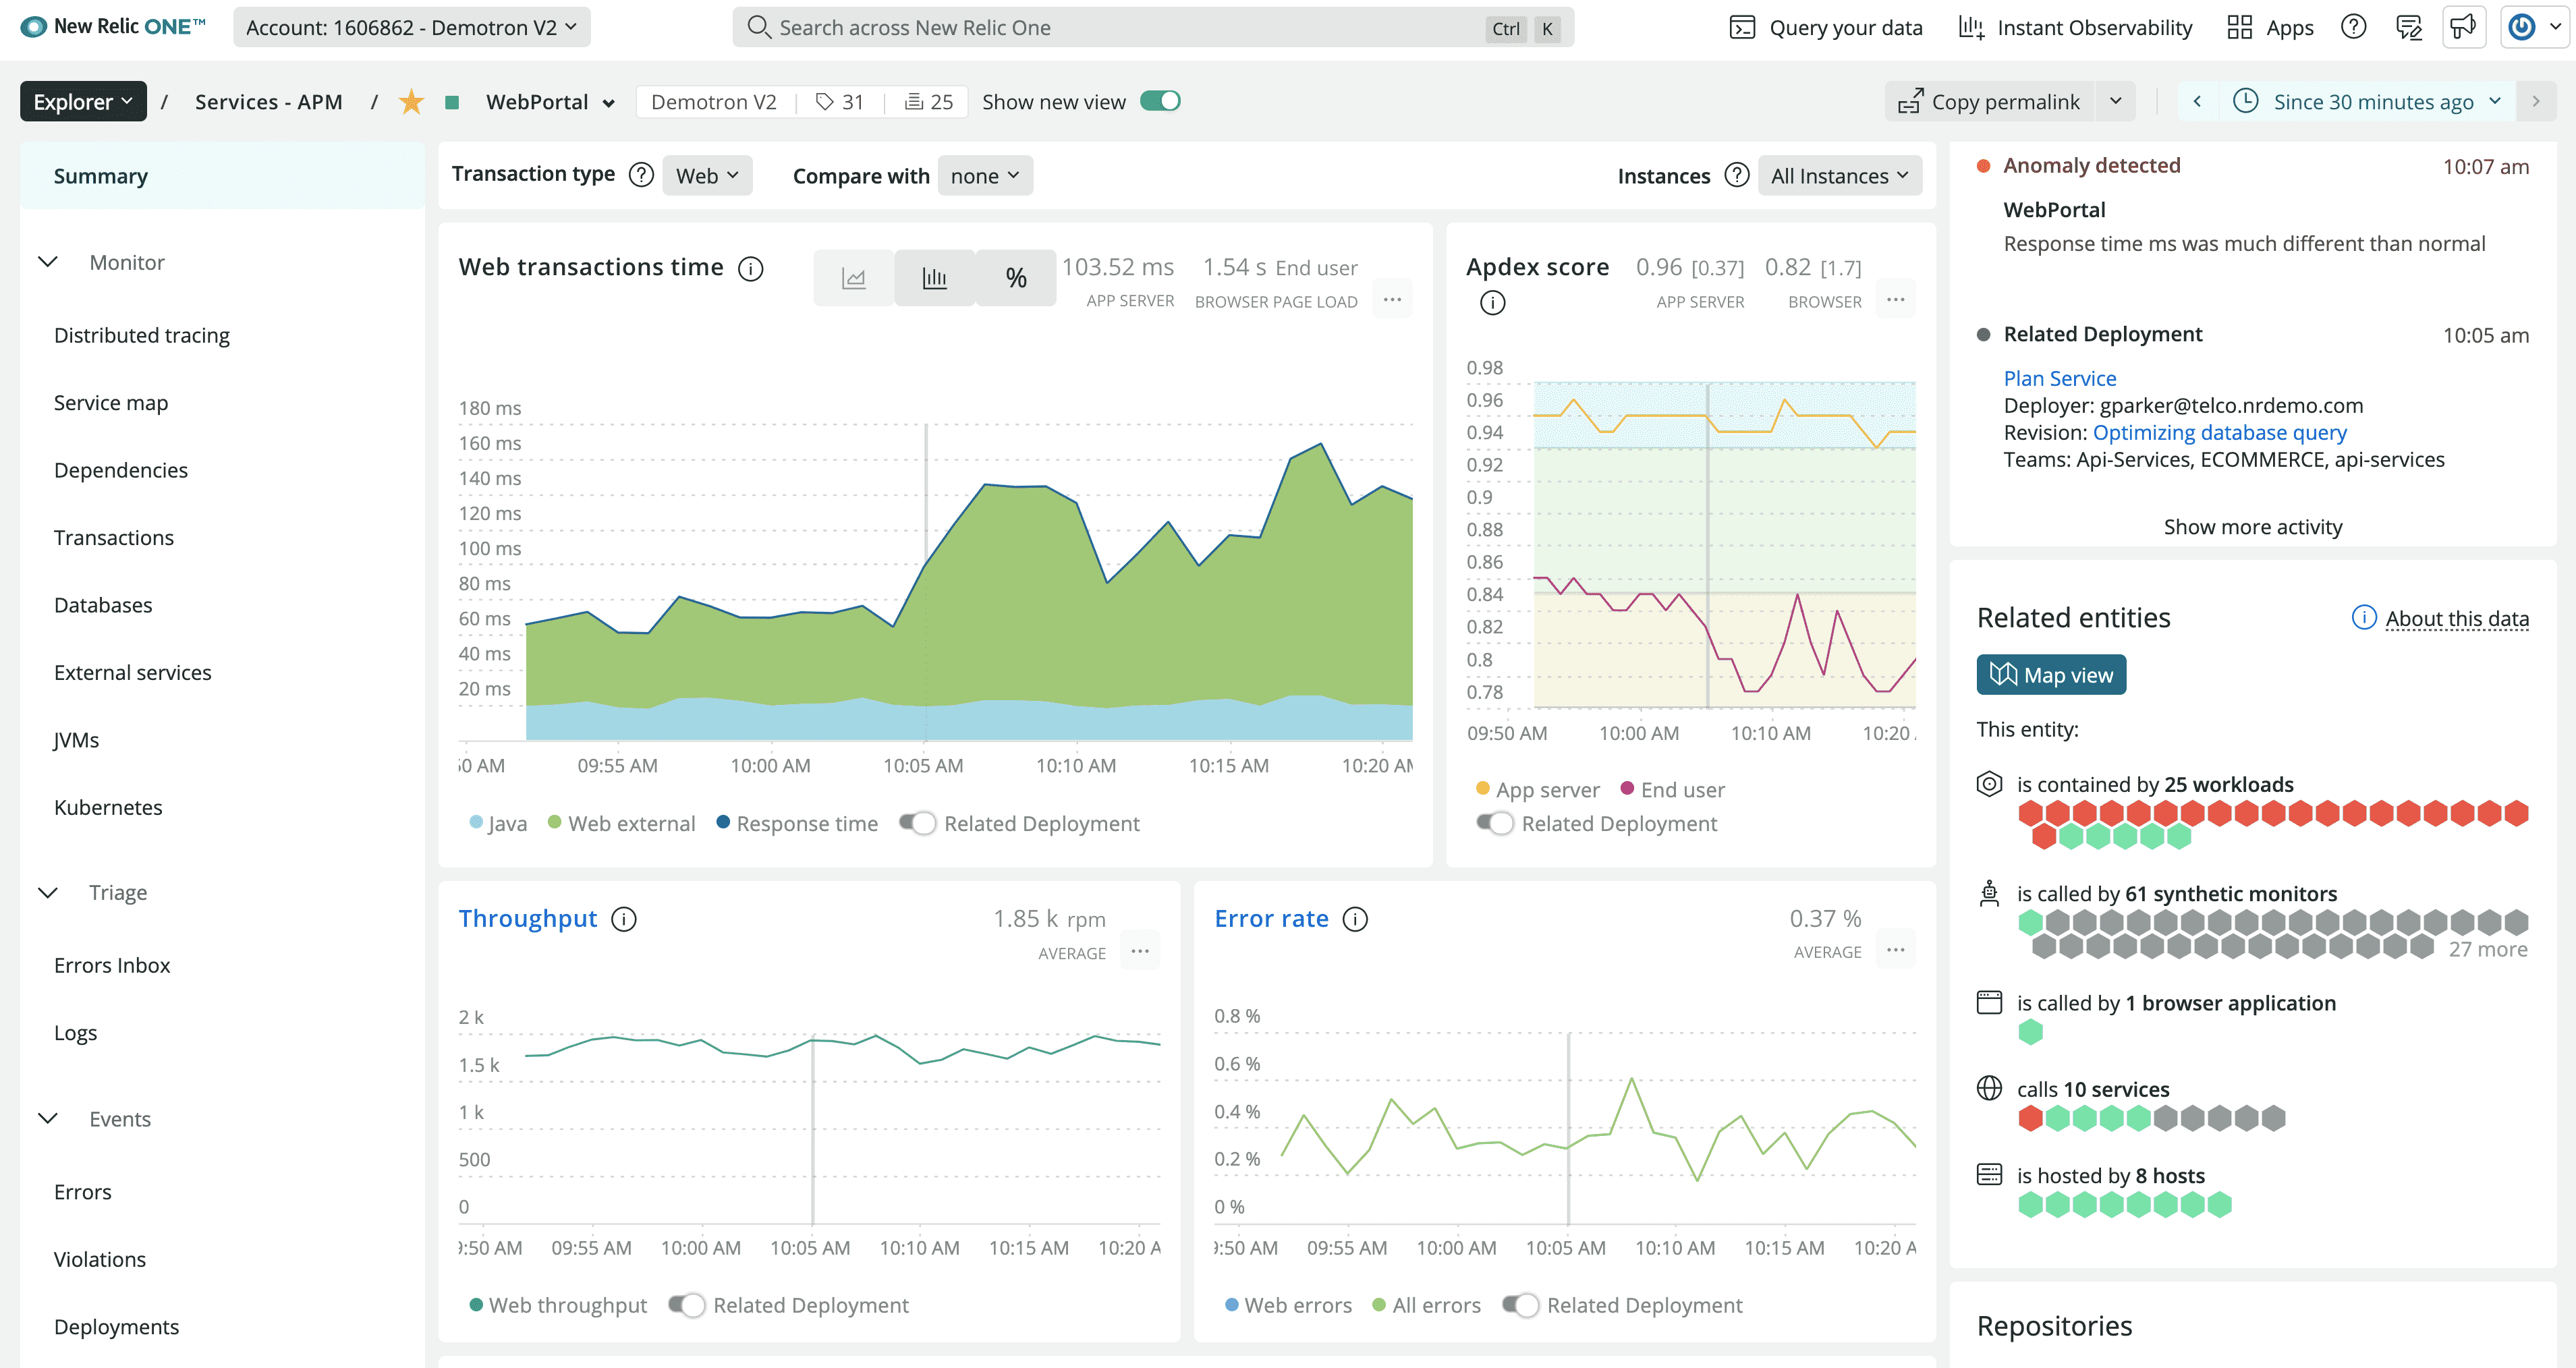
New Relic
Best for: Startups and growing teams.
New Relic combines RUM, APM, synthetics, and logging in one platform. Its free tier makes it attractive for smaller teams.
- Pricing: 100 GB/month free, then $0.40/GB
- Key features:
- Browser and mobile RUM
- Built-in OpenTelemetry support
- Simple configuration
✅ Generous free tier
✅ Fast setup with broad integrations
❌ Costs grow quickly with scale
Raygun
Best for: Frontend teams focusing on real user behavior and error tracking.
Raygun focuses on RUM, error monitoring, and crash reporting. It provides a clear view of how frontend issues affect UX.
- Pricing: from $8/month per 10,000 sessions
- Key features:
- Real-time session replay
- Error tracking and performance metrics
- UX and conversion insights
✅ Strong JavaScript error analysis
✅ UX-focused reports and dashboards
❌ Limited backend integration
How to Choose a RUM Tool
Pick the tool that fits your team size, budget, and technical needs.
Budget-conscious startups: Start with New Relic's free tier or Pingdom's low entry price.
Frontend-focused teams: Akamai mPulse and Raygun offer the deepest browser monitoring and user experience insights.
Full-stack enterprises: Datadog provides the best integration with APM and infrastructure monitoring, though at a higher cost.
OpenTelemetry users: New Relic and Uptrace both support OpenTelemetry natively, making it easier to correlate frontend RUM data with backend traces.
FAQ
What is an example of real user monitoring?
A common example is tracking how long it takes for a page to load for users in different regions and devices. For example, a RUM script can show that mobile users in Europe experience slower LCP than desktop users in North America, helping teams isolate network or CDN issues.
What does real user monitoring do?
Real user monitoring collects performance, error, and UX data from real browsers and devices. It helps teams find slow pages, broken scripts, and UX bottlenecks before they affect business metrics.
How much does real user monitoring cost?
Pricing depends on the vendor. OpenTelemetry-native options like Uptrace cost about $0.10–0.15/GB, while enterprise vendors like Datadog can reach $400–600/month for moderate traffic volumes.
Is RUM the same as synthetic monitoring?
No. Synthetic monitoring runs scripted tests, while RUM captures actual user sessions.
Do I need RUM if I already have APM?
Yes. APM measures backend performance, while RUM shows what real users actually experience on the frontend.
Will RUM scripts slow down my site?
Modern RUM scripts are lightweight and optimized to have minimal performance impact.
Final Thoughts
RUM monitoring is a critical part of modern performance engineering, giving teams visibility into how users actually experience their applications. Tools like Akamai mPulse, Datadog, Pingdom, New Relic, and Raygun cover a wide range of use cases — from Core Web Vitals tracking to deep UX analysis.
There is no single "best" RUM tool. The right choice depends on the size of your application, traffic volume, and how closely you want to tie frontend data to backend observability.
For organizations that need complete end-to-end visibility, combining a RUM platform with a backend observability solution can provide a powerful, vendor-agnostic monitoring stack. Ready to build full-stack observability? Check out Uptrace for OpenTelemetry-native monitoring or explore our guide on end-to-end monitoring tools.
By pairing real user monitoring with distributed tracing, metrics, and logs, teams can detect issues earlier, reduce downtime, and continuously optimize the end user experience.