Open Source Distributed Tracing Tools for Microservices
Compare open source distributed tracing tools for microservices: Jaeger, Uptrace, SkyWalking, SigNoz, Zipkin, Grafana Tempo, and Pinpoint. This guide covers features, tech stacks, pros/cons, and OpenTelemetry support to help you choose the right tracing solution for monitoring distributed systems and debugging performance bottlenecks.
Quick Comparison
| Tool | License | Backend | Storage | OpenTelemetry | Metrics | Best For |
|---|---|---|---|---|---|---|
| Uptrace | AGPL-3.0 | Go | ClickHouse | Native | Yes | Cost-effective APM with traces, metrics, logs |
| SigNoz | MIT/Enterprise | Go | ClickHouse | Native | Yes | Unified observability platform |
| Jaeger | Apache 2.0 | Go | Multiple | Native | Limited | Enterprise tracing with flexible storage |
| Pinpoint | Apache 2.0 | Java | HBase | Via SDK | Yes | Large-scale Java distributed systems |
| SkyWalking | Apache 2.0 | Java | Multiple | Via Collector | Yes | Full APM suite with service mesh |
| Zipkin | Apache 2.0 | Java | Multiple | Via Adapter | No | Legacy systems, mature tracing |
| Grafana Tempo | AGPLv3 | Go | Object Storage | Native | No | Grafana integration, cost-efficient storage |
What is a distributed tracing tool?
Distributed tracing tools track requests across microservices architectures, providing visibility into the end-to-end flow of requests. They help developers identify performance bottlenecks, diagnose issues, understand service dependencies, and optimize system behavior through visualization and analysis of trace data.
Why do you need a tracing tool?
Get a centralized view. Tracing provides a single view of your distributed microservices. Your team can more easily understand how an application is built and how services interact with each other.
Visualizing Bottlenecks. The collected trace data collected is visually presented through timelines or graphs, enabling developers to identify performance bottlenecks and slow services by observing the duration of each step in each microservice.
Alerting and Monitoring. Certain distributed tracing tools provide alerting and monitoring capabilities, enabling operators to establish alerts based on predetermined thresholds or conditions. This facilitates proactive monitoring and response to system performance degradation or errors.
Faster Debugging. Tracing tools can significantly reduce debugging time by visualizing the entire request flow. This allows developers to quickly locate the source of errors or slowdowns.
Dependency Mapping. Maintaining and evolving distributed systems requires a clear understanding of service dependencies. Distributed tracing tools offer dependency maps that visualize service relationships. These maps help developers and operators comprehend their application architecture and make informed decisions about changes and upgrades.
Open source tracing tools
Uptrace
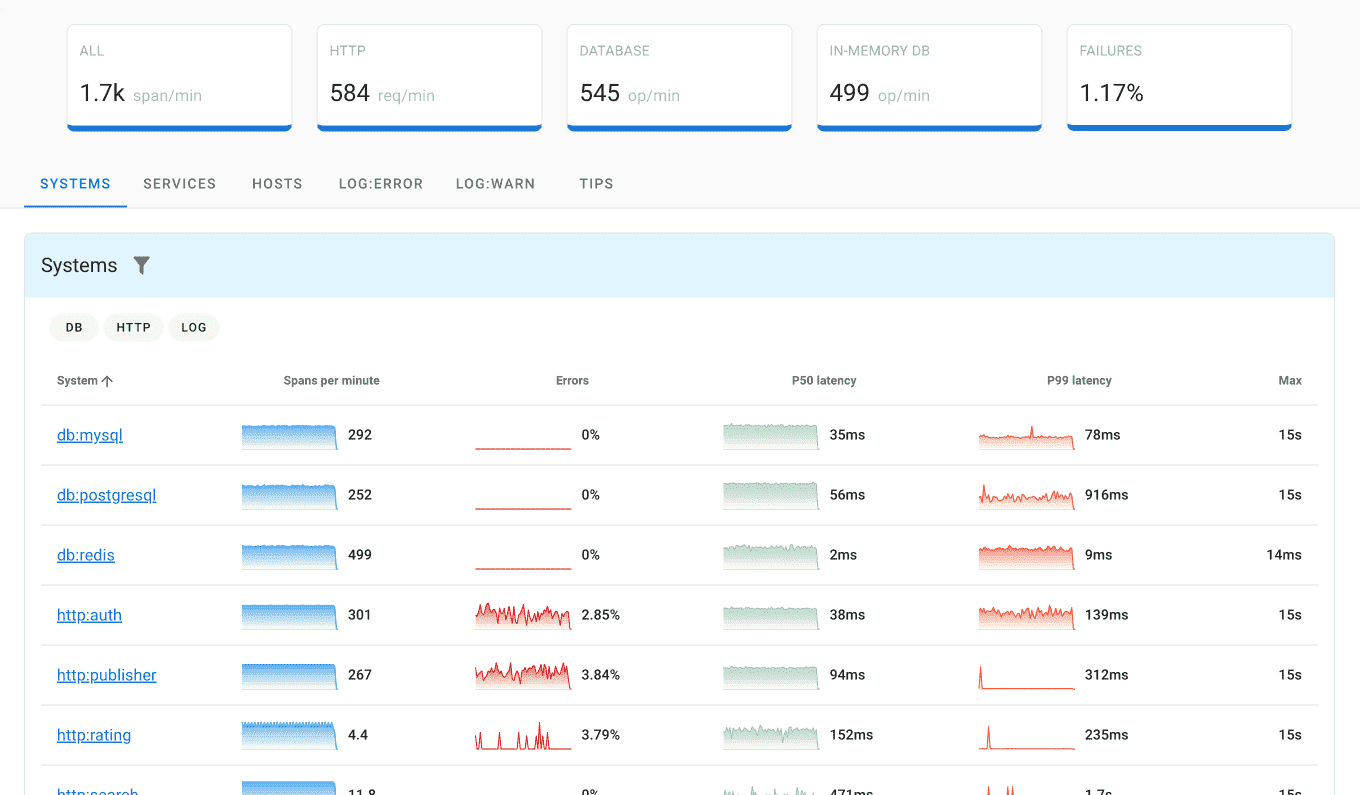
Uptrace is an OpenTelemetry APM that helps developers pinpoint failures and find performance bottlenecks. Uptrace can process billions of spans on a single server, allowing you to monitor your software at 10x less cost.
Uptrace aims to simplify the process of monitoring and troubleshooting distributed systems by providing a comprehensive tracing and observability platform.
You can get started with Uptrace by downloading a DEB/RPM package or a precompiled Go binary.
Tech stack:
- Backend: Go
- Frontend: Vue.js
- Instrumentation: OpenTelemetry (OTLP), Vector, FluentBit, AWS CloudWatch, Prometheus Remote Write
- Storage: ClickHouse and S3
Pros:
- Tracings, logs, and metrics
- Rich UI with charts
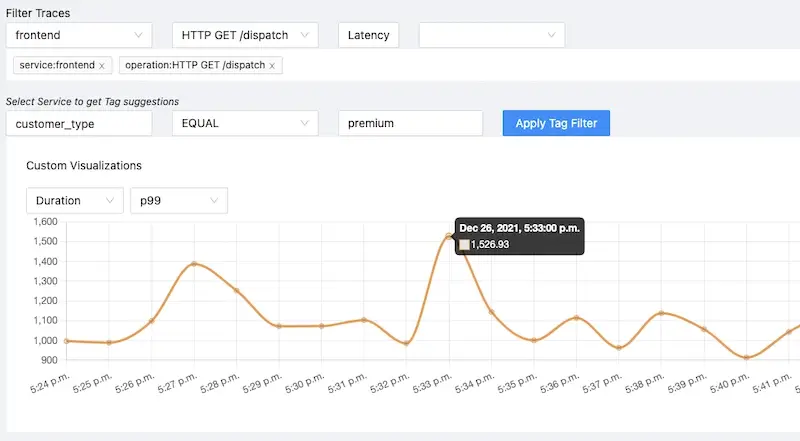
- Advanced filtering capabilities
- Simple setup with ClickHouse being the only dependency
- OpenTelemetry support including pre-configured distributions
Cons:
- ClickHouse is the only supported DBMS
SigNoz
SigNoz is an open-source APM. It helps developers monitor their applications & troubleshoot problems.
SigNoz provides a unified UI for metrics and traces so that there is no need to switch between different tools such as Jaeger and Prometheus.
Tech stack:
- Backend: Go
- Frontend: React
- Instrumentation: OpenTelemetry / OTLP
- Storage: ClickHouse
Pros:
- Native OpenTelemetry support
- Rich UI with charts
- Metrics support using Prometheus as a backend and custom UI
- Traces visualization using Flamegraphs and Gantt charts
- Filters based on tags, status codes, service names, operation, etc.
- Alarms
Cons:
- Dual licensing model with enterprise features in separate package
- ClickHouse operational complexity requires significant overhead
- UI can feel clunky for complex analytics and custom alerts
- Some features limited in open source version
Jaeger
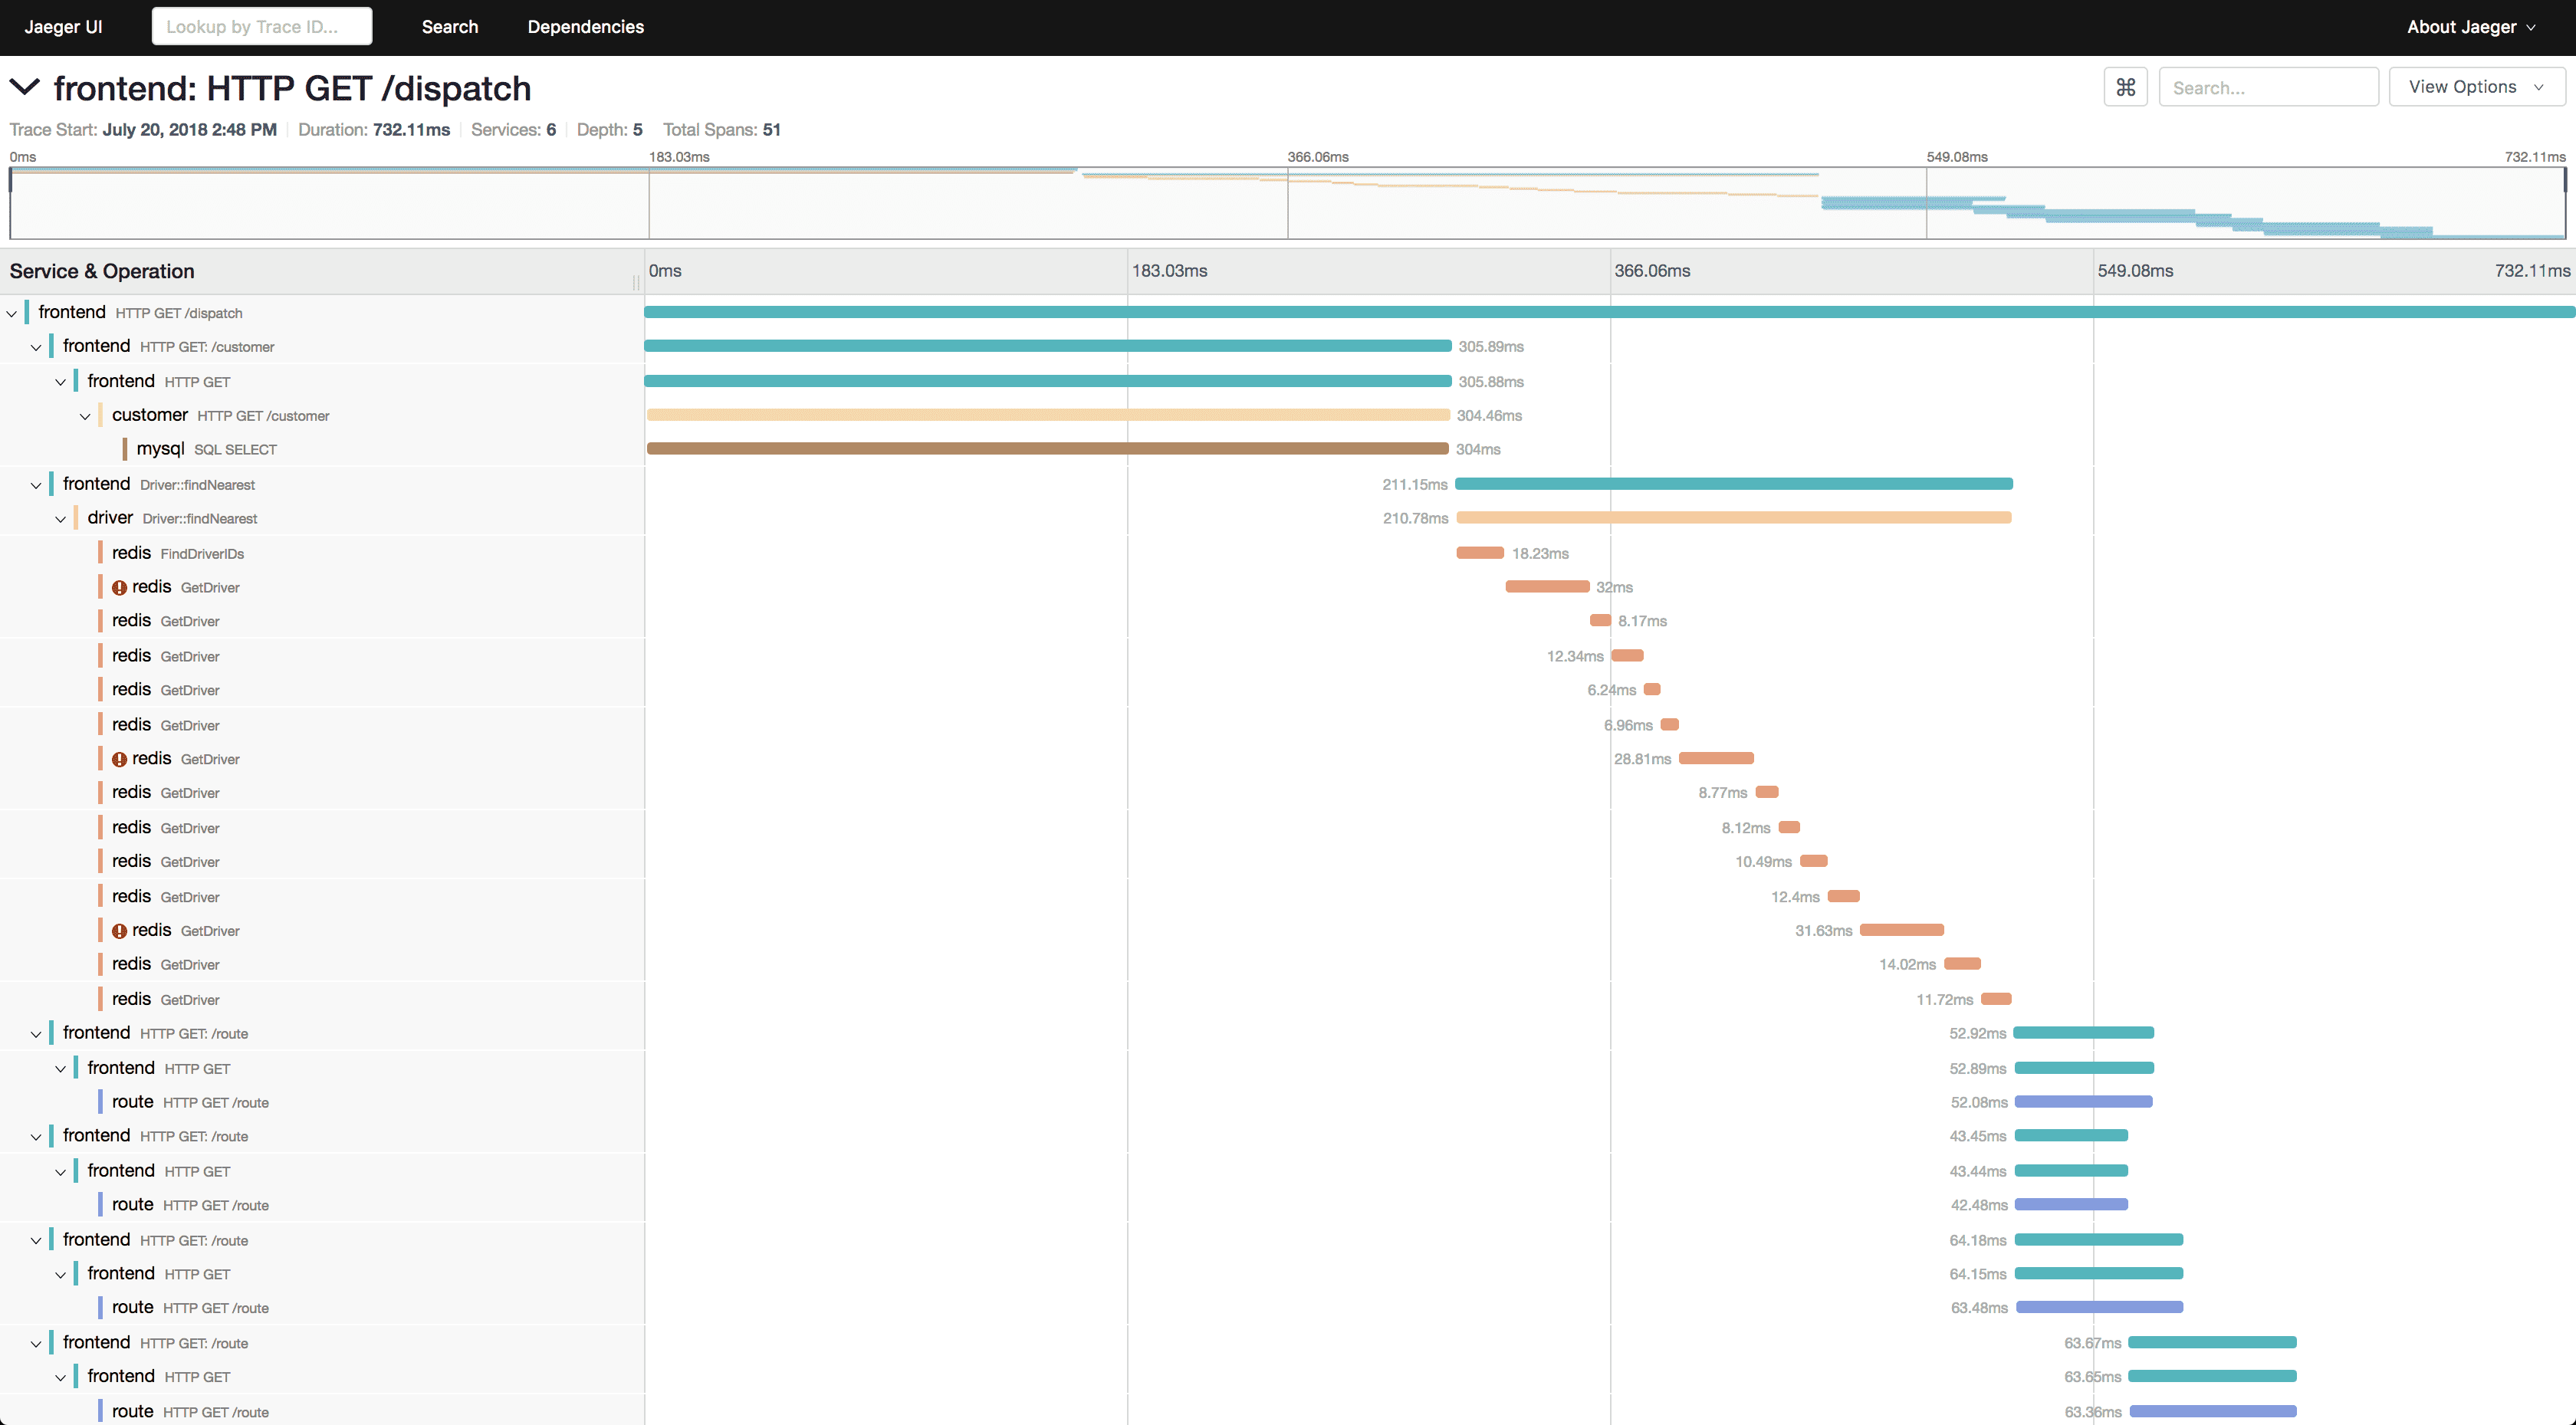
Jaeger is a CNCF graduated distributed tracing platform created by Uber Technologies. It can be used for monitoring microservices-based distributed systems.
Jaeger provides visibility into the flow of requests across microservices, allowing developers to understand the performance and behavior of their applications. It is used to gather timing data and logs from different services, and present them in a single view to help developers identify performance bottlenecks and errors.
In November 2024, Jaeger released version 2.0 with OpenTelemetry at its core, marking a significant evolution for the project. Jaeger v1 will be deprecated in January 2026, with the last v1 release scheduled for December 2025.
Jaeger's scalability is limited by the performance of its backend storage, which can become a bottleneck in highly distributed and high-traffic systems.
Tech stack:
- Backend: Go
- Frontend: React
- Instrumentation: OpenTelemetry / OTLP
- Storage: Cassandra, Elasticsearch; ClickHouse using a plugin
Pros:
- CNCF Graduated project (October 2019)
- Jaeger v2 with native OpenTelemetry integration
- Adaptive sampling
- Support for multiple DBMS via plugins
- Strong community (1,359+ contributors from 597 companies)
Cons:
- No charts / percentiles
- Limited filtering capabilities
- Not all plugins are maintained and usable
- v1 deprecation requires migration planning
Pinpoint
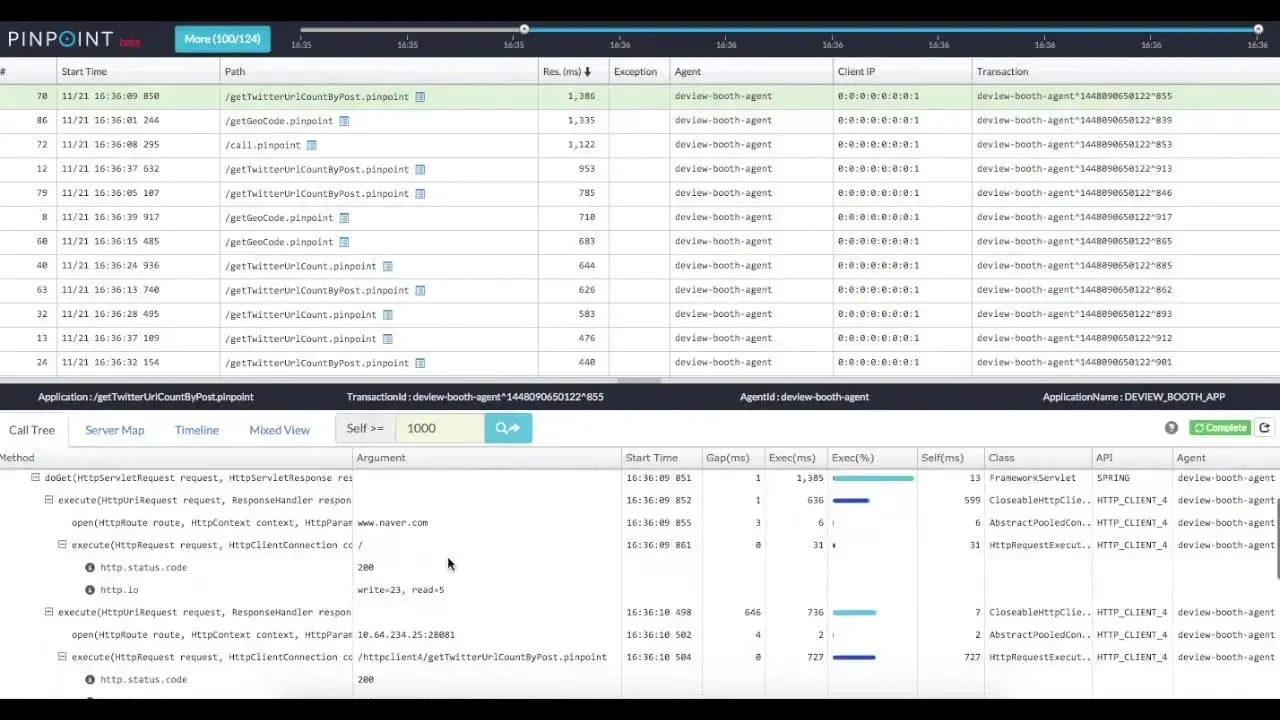
Pinpoint is an APM tool for large-scale distributed systems written in Java, PHP, and Python. Originally developed by Naver and inspired by Google's Dapper, Pinpoint provides code-level visibility into distributed applications.
Pinpoint traces transaction flows between distributed components and provides a clear view to identify problem areas and potential bottlenecks. The platform is battle-tested, handling over 20 billion requests per day in Naver's production environment.
Pinpoint offers detailed transaction timelines, application topology with real-time node status, request/response scatter charts, and an inspector view showing CPU usage, memory/garbage collection, TPS, and JVM arguments.
Tech stack:
- Backend: Java
- Frontend: React
- Instrumentation: Pinpoint Agent (bytecode instrumentation)
- Storage: HBase
Pros:
- Code-level visibility without code changes (bytecode instrumentation)
- Production-proven at massive scale (20B+ requests/day)
- Rich real-time monitoring dashboards
- Low overhead performance impact
- Active Apache-licensed open source project
Cons:
- HBase as only supported storage (operational complexity)
- Primarily optimized for Java applications
- Limited OpenTelemetry integration
- Steeper learning curve for setup and configuration
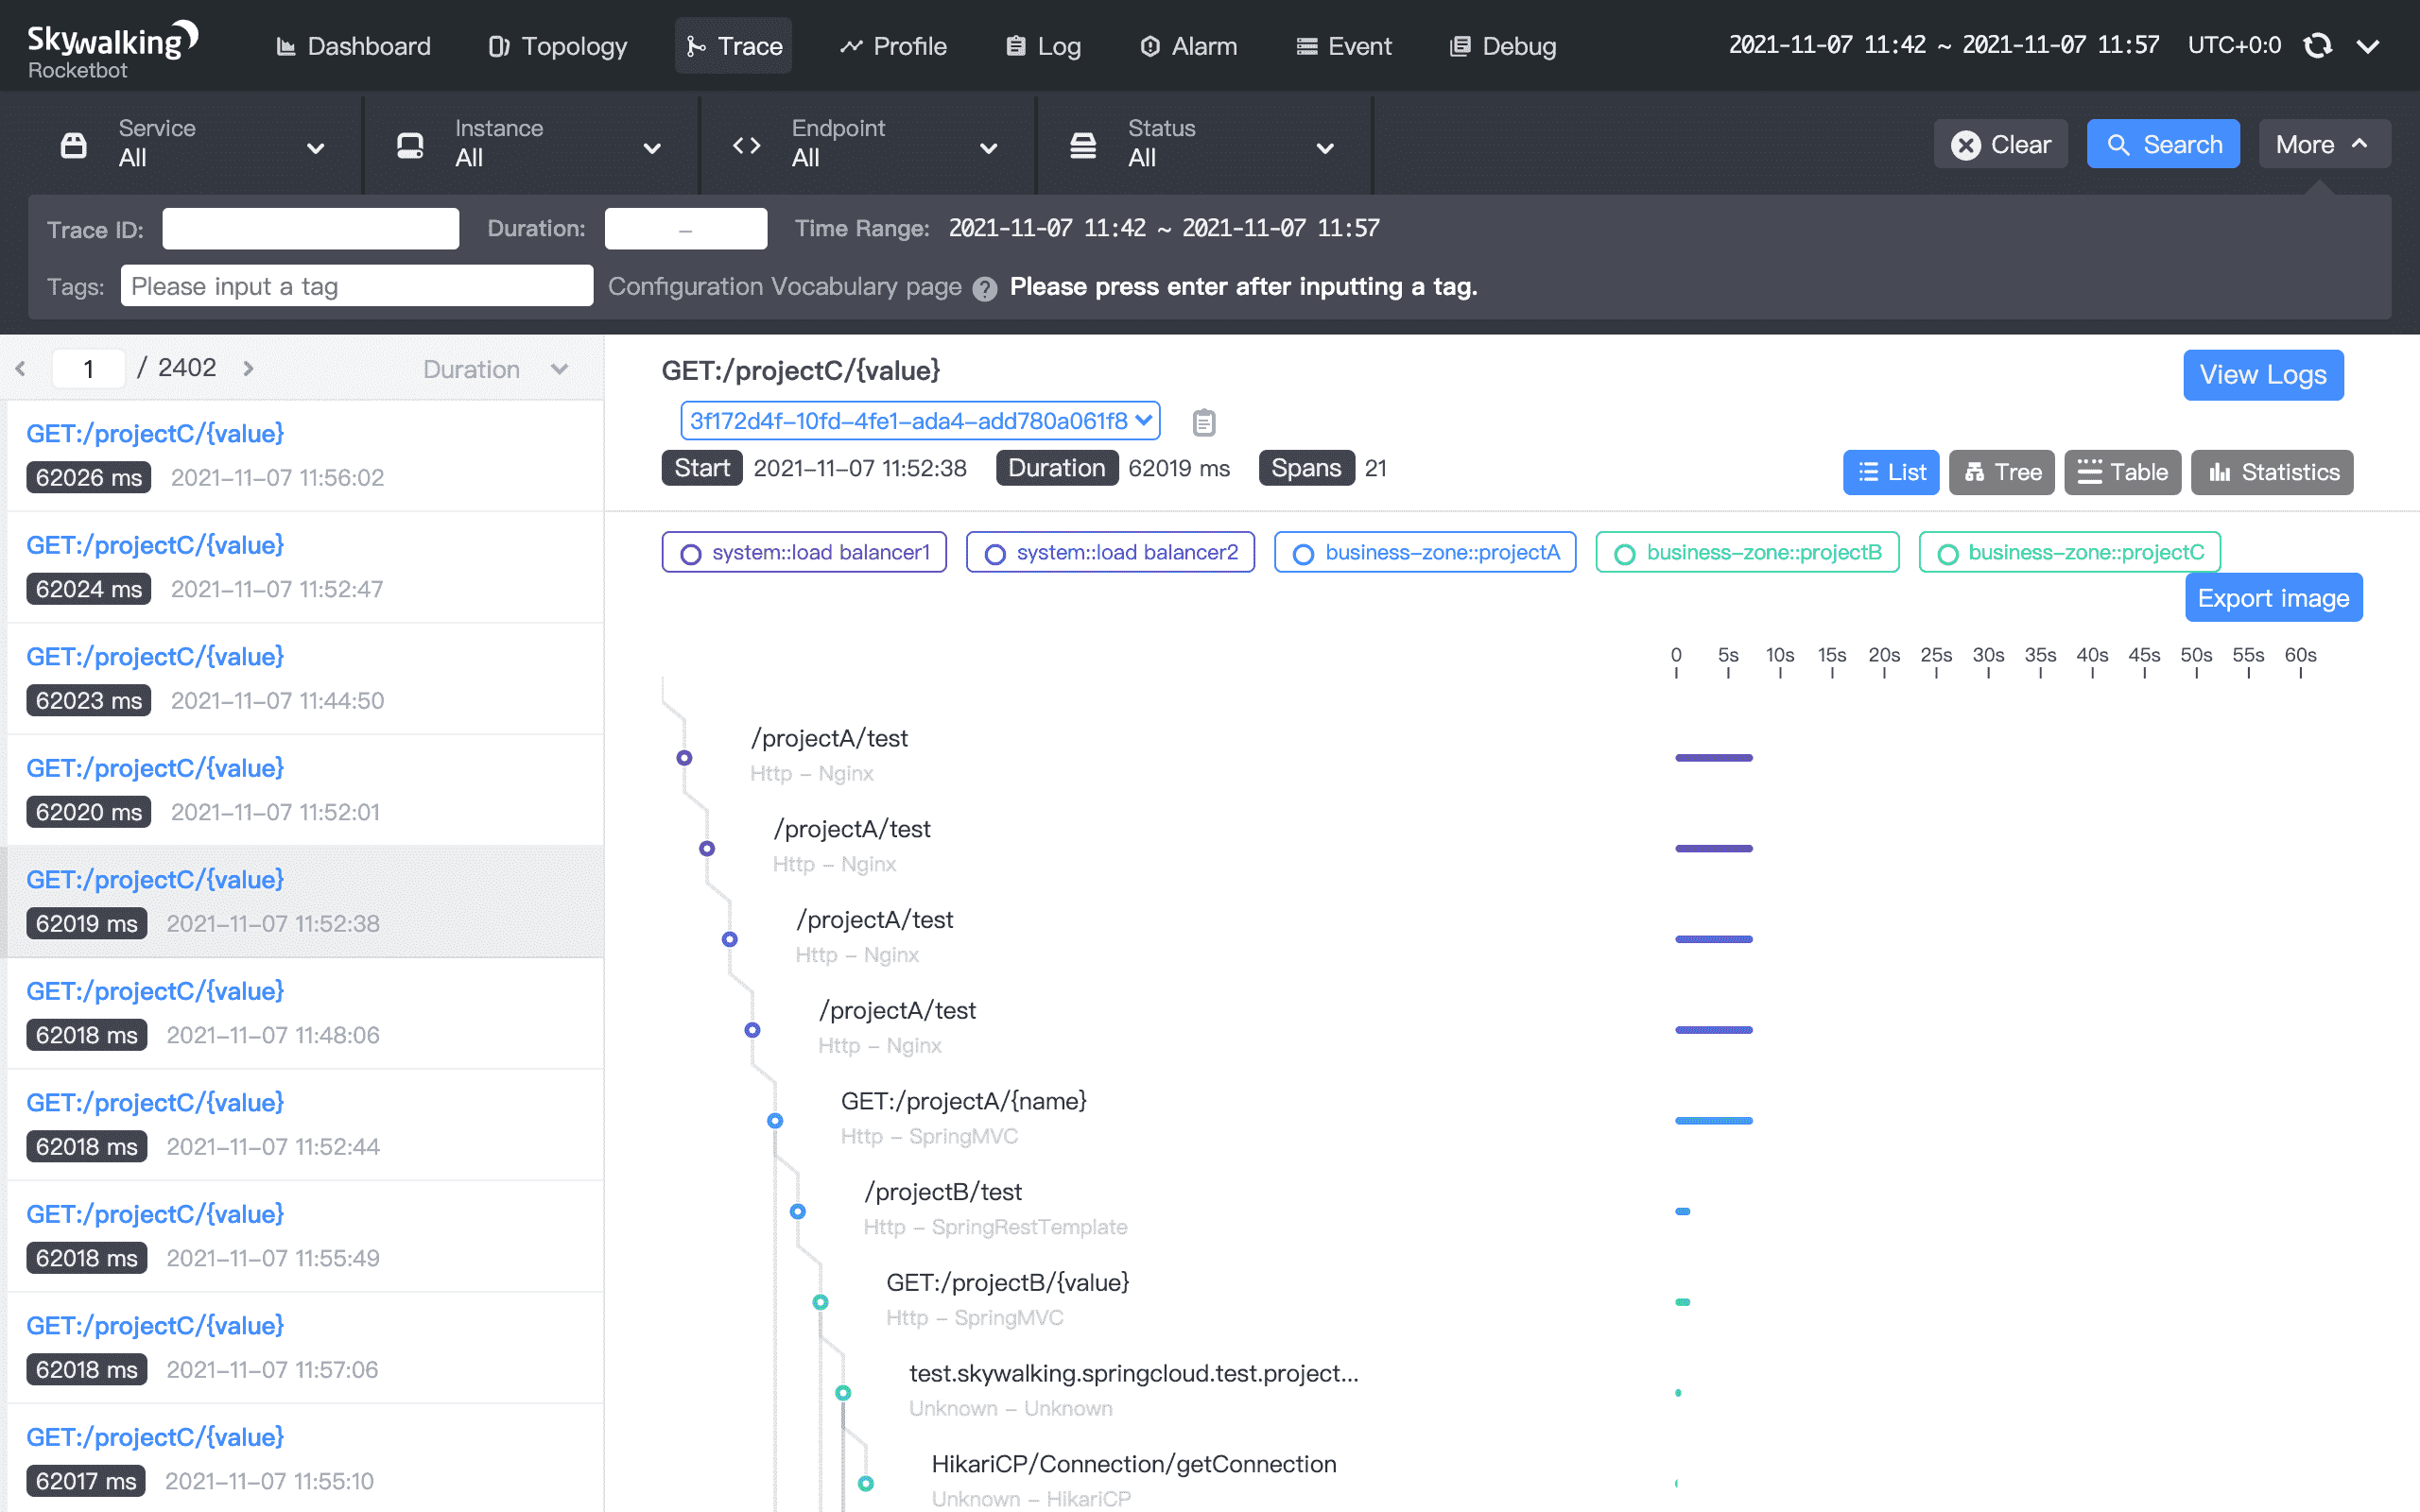
SkyWalking
SkyWalking is an open source APM system, including monitoring, tracing, diagnosing capabilities for distributed system in Cloud Native architecture.
SkyWalking provides a comprehensive solution for monitoring and analyzing the performance and behavior of modern applications, helping teams to identify and resolve issues before they impact end users.
SkyWalking provides features such as distributed tracing, application performance management (APM), and service mesh observability, all of which can be used to gain insights into the behavior and health of your applications.
SkyWalking also provides a centralized dashboard to visualize data, as well as alerts and notifications to alert teams to potential issues.
SkyWalking's feature set may not be as comprehensive as some commercial APM tools, including fewer integrations, alerting capabilities, and analytics tools.
Tech stack:
- Backend: Java
- Frontend: Vue.js
- Instrumentation: SkyWalking
- Storage: ElasticSearch, MySQL, TiDB, InfluxDB, and more
Pros:
- Rich UI with charts
- Good metrics support (including dashboards)
- Alarms
- Support for multiple DBMS
Cons:
- Complex setup
- Complex and overloaded UI
- Confusing tracing UI
- OpenTelemetry support requires OpenTelemetry Collector
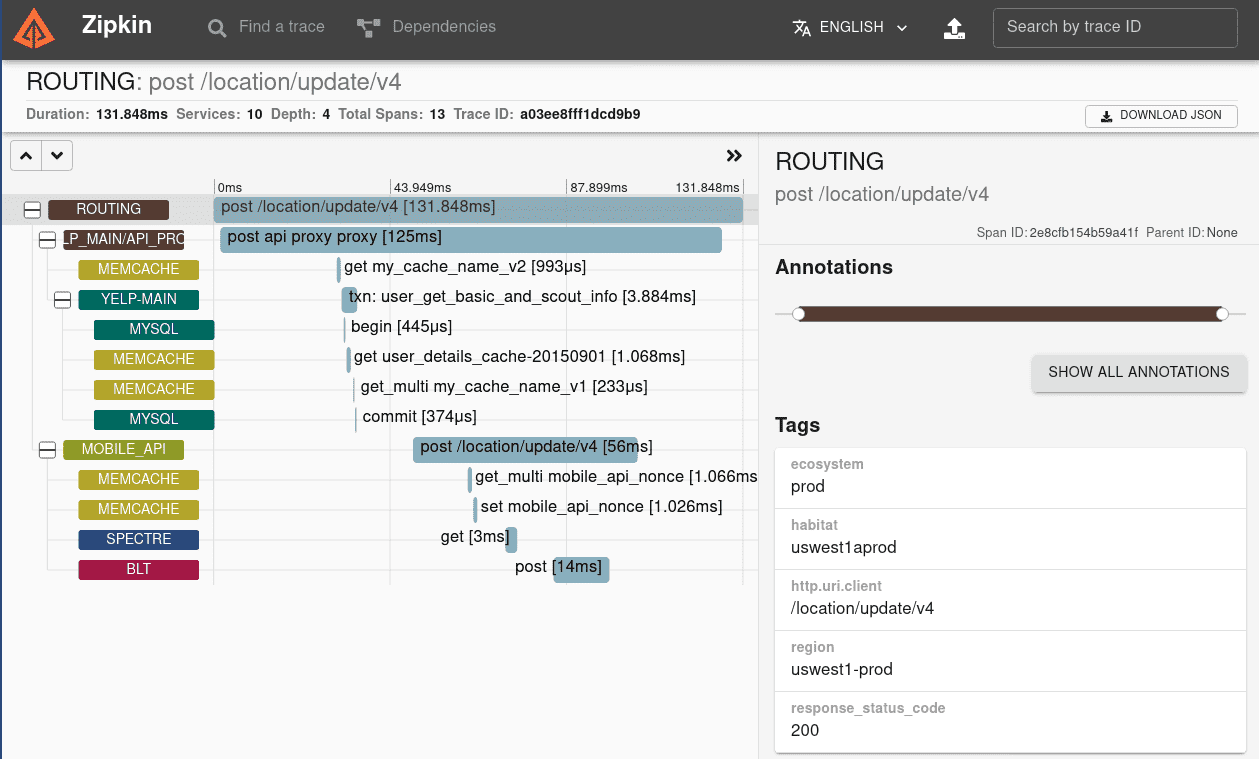
Zipkin
Zipkin is an open-source distributed tracing system that helps to gather data on the interactions between microservices in a distributed system.
Zipkin provides a way to visualize the flow of requests and responses between services, as well as the performance characteristics of each request, such as latency and response times.
Zipkin's key feature is the ability to trace a request as it flows through multiple microservices. This information can be used to gain insights into the performance of each service and the interactions between them, helping teams to identify and resolve performance and stability issues.
Zipkin remains actively maintained with regular updates through 2025, including security improvements with Trivy scanner integration. However, the project is maintained entirely by volunteers with no dedicated paid development time.
Zipkin's UI is minimalistic, but you can replace it with Grafana/Kibana configured to work with Zipkin data source.
Tech stack:
- Backend: Java
- Frontend: React
- Instrumentation: Zipkin span model; OpenTelemetry via adapter
- Storage: MySQL, Cassandra, or Elasticsearch
Pros:
- Stable and well-known project
- Support for multiple DBMS
- Regular security updates and maintenance
- Simple, focused feature set
Cons:
- Volunteer-only maintenance (no paid contributors)
- Limited UI and filtering capabilities
- OpenTelemetry support requires an adapter
- No ClickHouse support
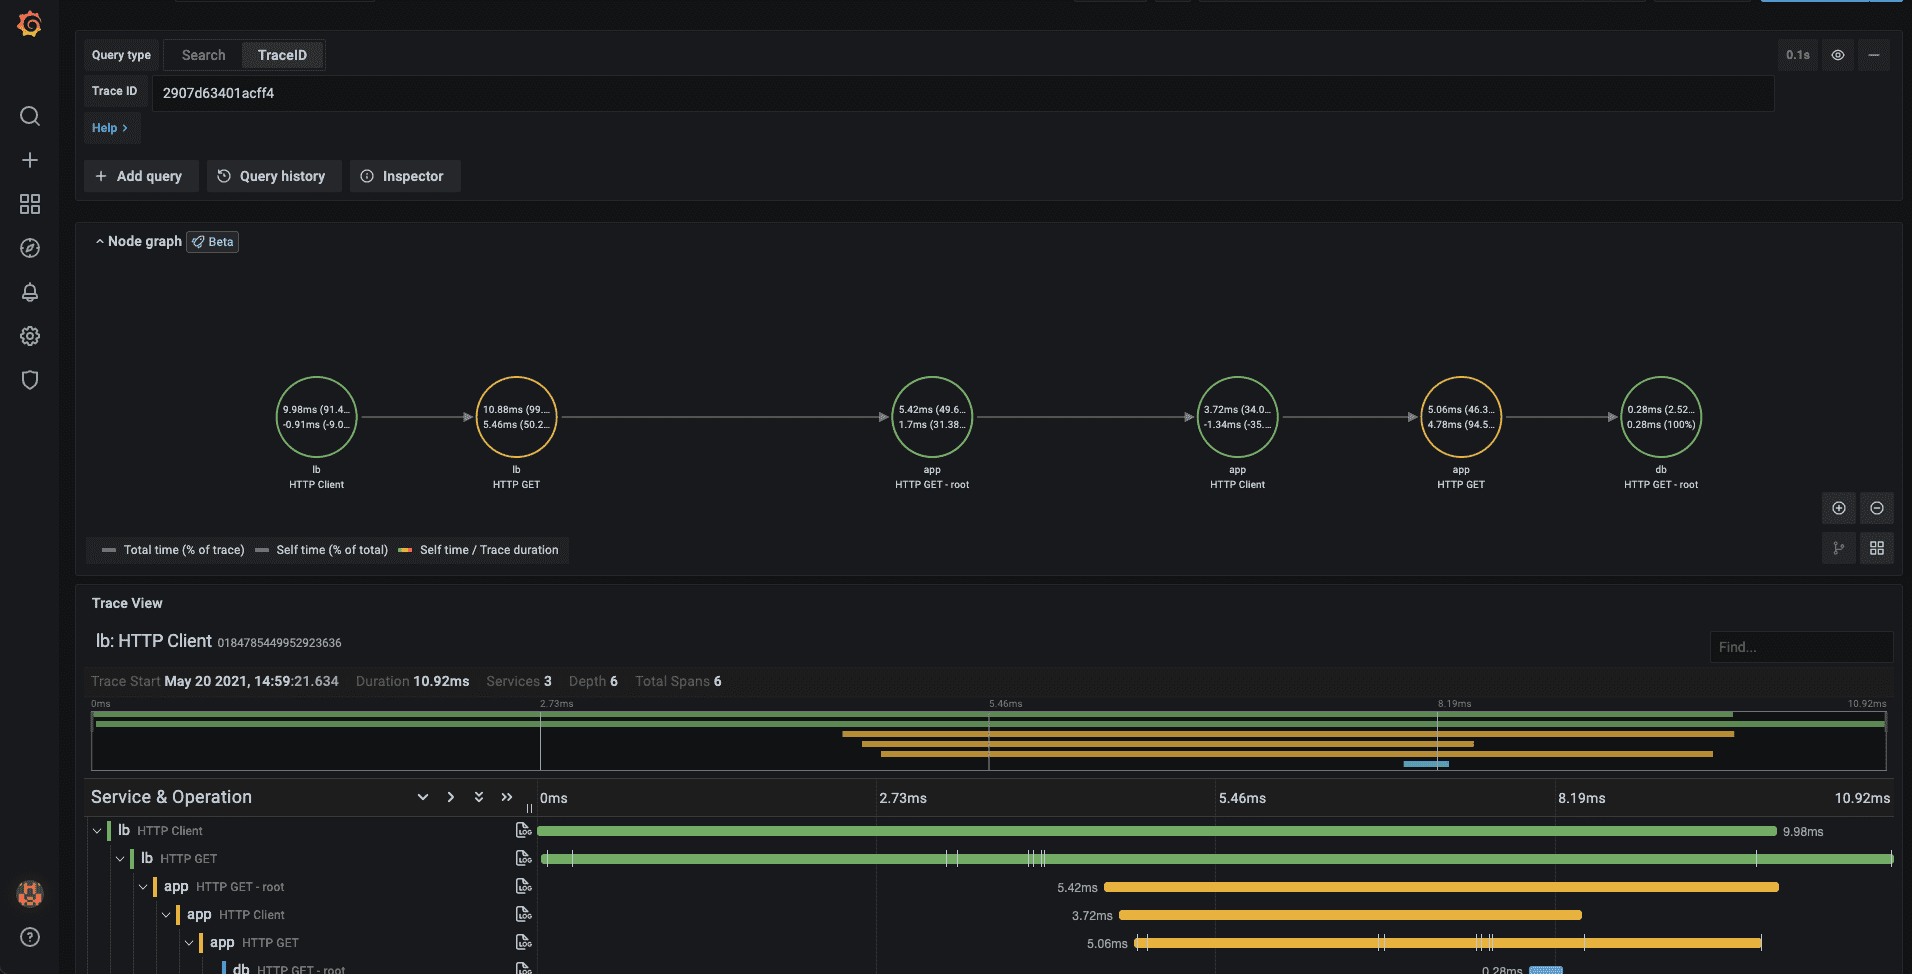
Grafana Tempo
Grafana Tempo is an open source, easy-to-use, and high-scale distributed tracing backend.
Tempo is designed to work seamlessly with Grafana, providing a complete solution for observability of distributed systems and microservices.
Tempo is cost-efficient, requiring only object storage to operate, and is deeply integrated with Grafana, Prometheus, and Loki. Tempo can ingest common open source tracing protocols, including Jaeger, Zipkin, and OpenTelemetry.
Tempo is optimized for high performance and can handle large amounts of tracing data, making it well-suited for use in large, complex systems. It provides a highly scalable, high-availability backend for storing, querying, and visualizing tracing data.
Tech stack:
- Backend: Go
- Frontend: React
- Instrumentation: OpenTelemetry / OTLP
- Storage: Grafana Tempo
Pros:
- Integration with Grafana metrics dashboard
- OpenTelemetry support
Cons:
- The UI is built around metrics and feels awkward / clumsy for everything else
- Limited filtering capabilities
OpenTelemetry
OpenTelemetry is an open-source observability framework that provides a vendor-neutral, standard way of collecting, processing, and exporting telemetry data, including distributed traces, metrics, and logs.
OpenTelemetry supports several popular backends for storing and analyzing trace data, including Uptrace, Jaeger, Zipkin, and Prometheus. It also provides integrations with cloud platforms, such as AWS, GCP, and Azure, to facilitate the collection and analysis of telemetry data in cloud-native environments.
OpenTelemetry tracing is one of the core features of the framework, which allows developers to trace requests and transactions across distributed systems. OpenTelemetry tracing provides end-to-end visibility into the path of requests, their latency, and the interactions between different components of the system.
Tool Comparisons
Uptrace vs SigNoz
Both Uptrace and SigNoz use Go and ClickHouse, offering excellent performance for traces, metrics, and logs. Uptrace focuses on cost-efficiency with the ability to process billions of spans on a single server, while SigNoz provides more out-of-the-box dashboards and a richer UI. Choose Uptrace for minimal infrastructure costs, or SigNoz for a more feature-complete platform with pre-built visualizations.
Jaeger vs SkyWalking
Jaeger (Go-based, CNCF graduated) and SkyWalking (Java-based, Apache project) both offer comprehensive distributed tracing. Jaeger provides better OpenTelemetry integration and multiple storage options, while SkyWalking offers a richer feature set with metrics, service mesh observability, and more elaborate dashboards. Choose Jaeger for OpenTelemetry-first architecture, or SkyWalking for a complete APM suite with extensive built-in features.
Pinpoint vs SkyWalking
Both Pinpoint and SkyWalking are Java-based APM tools for large-scale systems. Pinpoint excels with bytecode instrumentation providing code-level visibility without code changes and is battle-tested at massive scale (20B+ requests/day). SkyWalking offers broader language support, multiple storage backends, and better OpenTelemetry integration. Choose Pinpoint for Java-heavy environments requiring deep code-level tracing, or SkyWalking for polyglot architectures.
Zipkin vs Tempo
Zipkin is a mature, stable project with support for multiple storage backends but volunteer-only maintenance. Grafana Tempo is newer, designed for cost-efficient storage using object storage (S3, GCS) and deep Grafana integration. Choose Zipkin for legacy compatibility and simplicity, or Tempo for modern, scalable tracing with Grafana.
Jaeger vs Zipkin vs Tempo
All three support distributed tracing, but differ in implementation. Jaeger offers the richest feature set with adaptive sampling, CNCF backing, and Jaeger v2 with native OpenTelemetry. Zipkin provides simplicity and maturity with volunteer maintenance. Tempo focuses on cost-efficiency with object storage and Grafana integration. For enterprise needs, choose Jaeger; for simplicity, Zipkin; for Grafana users, Tempo.
FAQ
What are the best open source distributed tracing tools? The best open source distributed tracing tools include Uptrace (cost-effective APM), SigNoz (unified observability), Jaeger (enterprise tracing), Grafana Tempo (Grafana integration), Zipkin (mature solution), and Pinpoint (large-scale Java systems). The choice depends on your specific needs: infrastructure costs, feature requirements, programming language, and existing technology stack.
What is the difference between Jaeger and Zipkin? Jaeger offers more features including adaptive sampling, better filtering, CNCF graduated status, and Jaeger v2 with native OpenTelemetry. Zipkin is simpler and more mature but has volunteer-only maintenance and fewer features. Both support OpenTelemetry, but Jaeger has native support while Zipkin requires an adapter.
Which distributed tracing tool supports OpenTelemetry? Uptrace, SigNoz, Jaeger, and Grafana Tempo have native OpenTelemetry support. SkyWalking supports OpenTelemetry via OpenTelemetry Collector. Zipkin requires an OpenTelemetry to Zipkin adapter. Pinpoint uses its own SDK with limited OpenTelemetry integration.
How do I choose a distributed tracing tool for microservices? Consider: (1) OpenTelemetry support for vendor neutrality, (2) storage backend compatibility with your infrastructure, (3) whether you need unified observability (traces + metrics + logs) or just tracing, (4) scalability requirements and infrastructure costs, (5) integration with existing tools like Grafana or Prometheus, (6) primary programming language (Pinpoint for Java, for example).
What's the best free distributed tracing tool? All tools listed (Uptrace, SigNoz, Jaeger, Zipkin, Tempo, SkyWalking, Pinpoint) are open source and free to self-host. Uptrace and SigNoz offer the most features for free including traces, metrics, and logs. Jaeger and Zipkin are free but focus primarily on tracing. Grafana Tempo is free and optimized for low storage costs. Pinpoint is free with production-proven scalability.
Can distributed tracing tools monitor performance bottlenecks? Yes, distributed tracing tools visualize request flows across services, showing the duration of each operation. This helps identify slow services, database queries, API calls, and network latency. Tools with metrics support (Uptrace, SigNoz, SkyWalking, Pinpoint) provide additional performance insights through percentiles, throughput, and error rates.
What is the best distributed tracing tool for Java applications? For Java applications, Pinpoint and SkyWalking are excellent choices. Pinpoint offers bytecode instrumentation with code-level visibility and is battle-tested at massive scale (20B+ requests/day at Naver). SkyWalking provides broader language support, multiple storage backends, and better OpenTelemetry integration. Jaeger is also a strong choice for Java with native OpenTelemetry support.
Conclusion
Distributed tracing tools are essential for understanding, monitoring, troubleshooting, and optimizing complex distributed systems. They offer visibility into system behavior, help identify performance issues, aid in debugging, and ensure the reliability and scalability of distributed applications.
When choosing a distributed tracing tool, consider factors such as OpenTelemetry support, storage backend compatibility, whether you need unified observability or just tracing, scalability requirements, and how the tool integrates with your existing stack.
For complete observability, organizations need both distributed tracing and comprehensive infrastructure monitoring. This multi-layered approach provides both the detailed transaction view and the underlying resource status.
You may also be interested in: