Log Analyzer and Log Analysis Tools for 2026
Log analysis is the process of collecting, parsing, and querying log data from applications, servers, and network devices to diagnose problems, detect security threats, and understand system behavior. Log analysis tools automate this at scale — indexing raw log files, providing query languages for fast search, and alerting when patterns indicate failures or attacks. Open source options (Uptrace, ELK Stack, Graylog, Loki) and commercial platforms (Splunk, Datadog, Dynatrace) offer different trade-offs in cost, AI capabilities, and operational overhead.
Quick Comparison
| Tool | Type | License | Best For | Search | Price |
|---|---|---|---|---|---|
| Uptrace | Open Source | AGPL/Commercial | Unified logs+traces | SQL | Free/Custom |
| Splunk | Commercial | Proprietary | Enterprise security | SPL | Volume-based |
| Dynatrace | Commercial | Proprietary | Enterprise AI observability | DQL | Custom/Enterprise |
| ELK Stack | Source-available | Elastic License 2 (ELv2) | DevOps teams | Elasticsearch | Free/Paid |
| Datadog | Commercial | SaaS | Unified observability | Query builder | $0.10/GB + indexing |
| Graylog | Source-available | SSPL | Stream processing | Lucene | Free/Paid |
| Loki | Open Source | AGPL | Cost-efficient | LogQL | Free |
| New Relic | Commercial | SaaS | APM integration | NRQL | Free tier + |
| Sumo Logic | Commercial | SaaS | Cloud security | CQL | ~$0.20/GB |
| Logz.io | Commercial | SaaS | Managed ELK | Elasticsearch | Volume-based |
| Coralogix | Commercial | SaaS | AI-first, cost-efficient | DataPrime | Usage-based |
Log Analysis vs Log Management
Log Analysis focuses on searching, parsing, and visualizing logs to find patterns, errors, and security threats. Analysis tools (Splunk, ELK) provide query languages, dashboards, and anomaly detection.
Log Management handles collection, storage, and retention of logs from multiple sources. Management tools (Fluentd, Vector) focus on log shipping and centralization.
Most tools combine both - this guide focuses on analysis capabilities (search, visualization, alerting).
What is Log Analysis?
Log analysis is the process of examining, parsing, and interpreting log files generated by systems, applications, and network devices to extract meaningful insights about performance, security, and operational status. Unlike basic monitoring tools that track predefined metrics, log analysis tools process unstructured text data to identify patterns, anomalies, and security threats in real-time.
Top Log Analysis Tools in 2026
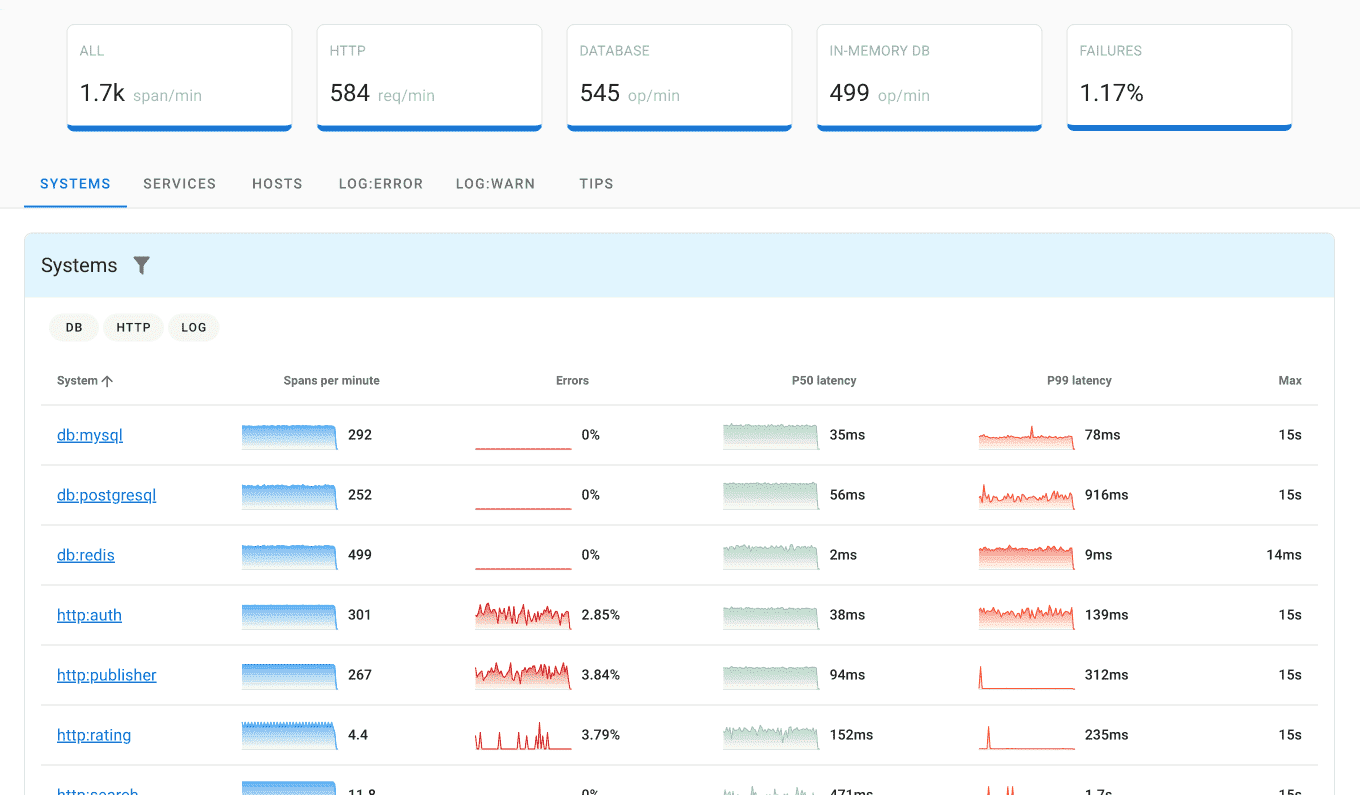
Uptrace
Type: Open source unified observability platform
License: AGPL / Commercial
Search: SQL
Best for: Unified logs + traces + metrics at startup-friendly pricing
Uptrace combines log analysis with distributed tracing and metrics in a single platform. OpenTelemetry-native architecture means no vendor SDK required — any OTel-compatible instrumentation feeds data directly.
Key Features:
- Unified Observability: Logs, metrics, and traces in a single platform — no separate tools required
- OpenTelemetry Native: Built-in support for OpenTelemetry Logs, traces, and metrics
- Advanced Correlation: Intelligent correlation between logs, traces, and metrics
- Cost-Effective: Transparent pricing without per-user or per-host fees
Pros: Unified platform, excellent value, modern architecture
Cons: Newer in market, smaller ecosystem than established vendors
Pricing: Free self-hosted (AGPL); cloud from $30/month
Splunk
Type: Commercial SIEM platform
License: Proprietary
Search: SPL (Search Processing Language)
Best for: Enterprise security and compliance
Splunk dominates enterprise log analysis with 47.51% SIEM market share and 17,915+ customers. SPL query language offers powerful search capabilities for security investigations, while machine learning detects anomalies across petabyte-scale log volumes.
Key Features:
- SPL query language for complex log searches
- Machine learning anomaly detection
- SIEM and threat intelligence integration
- Petabyte-scale distributed architecture
Pros: Industry-leading features, strong security focus, enterprise support
Cons: Expensive at scale, steep learning curve, complex setup
Pricing: Volume-based ingest pricing; contact sales for current rates
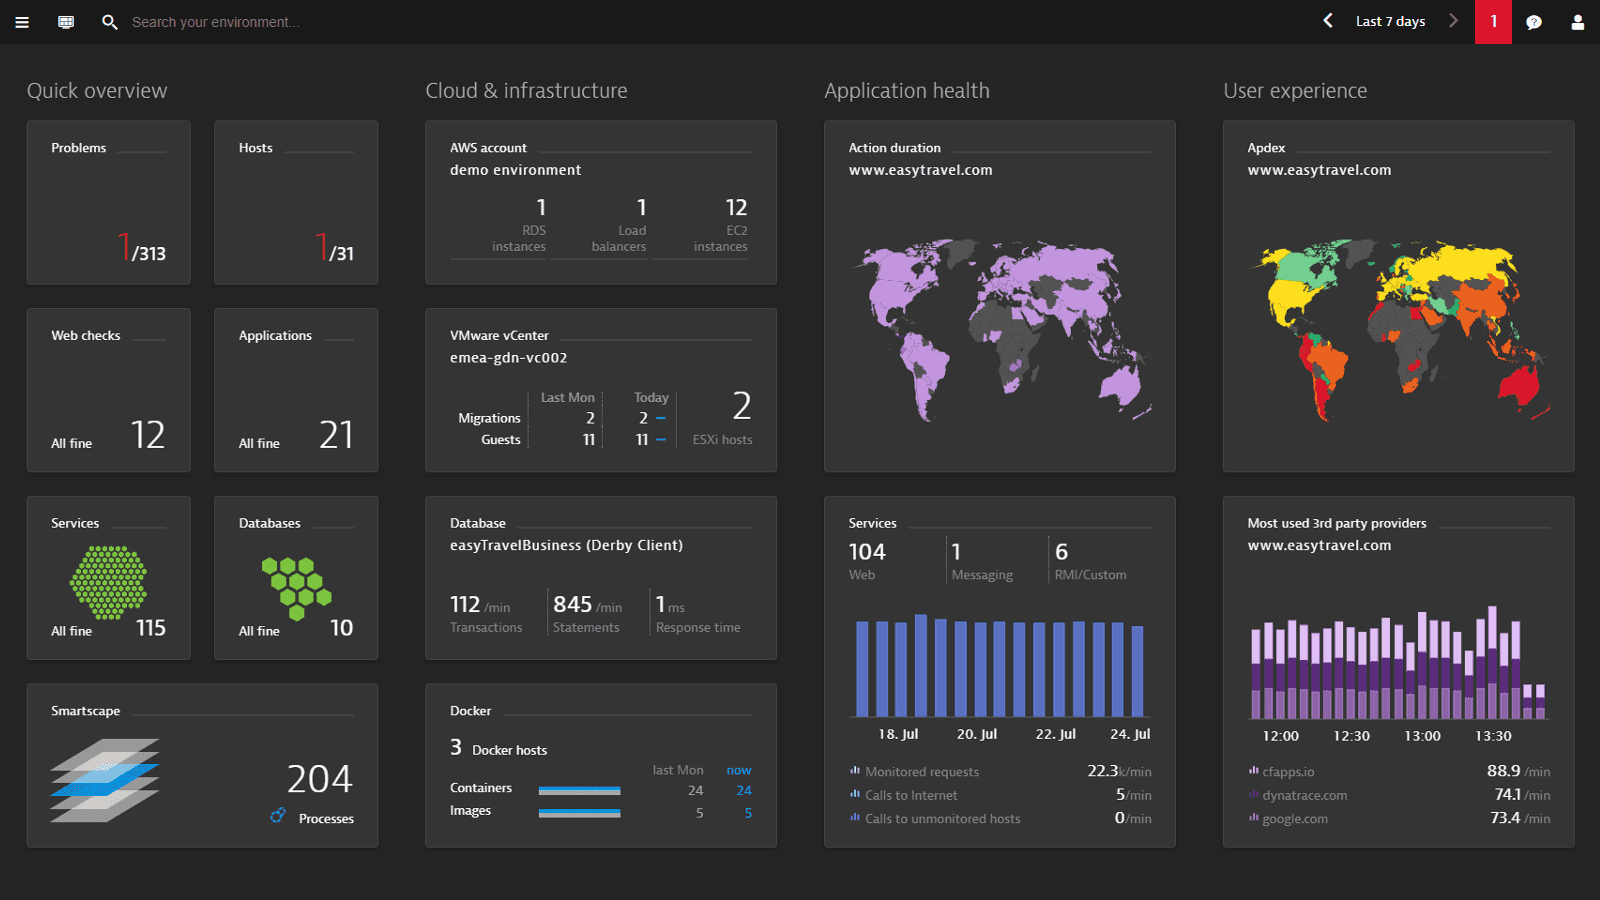
Dynatrace
Type: Commercial AI-powered observability platform
License: Proprietary SaaS
Search: DQL (Dynatrace Query Language)
Best for: Large enterprises requiring automated root cause analysis
Dynatrace uses its Davis AI engine to automatically correlate log events with traces, metrics, and topology data. Rather than requiring manual query rules, Davis identifies root causes across millions of events — linking a log anomaly to the specific service, deployment, or infrastructure change that caused it.
Key Features:
- Davis AI: Automated root cause analysis correlates logs, metrics, and topology without manual correlation rules
- Log Powered by Grail: Unified log storage with automatic parsing and context enrichment at ingest
- DQL: Powerful query language for log exploration and custom dashboards
- Full-Stack Context: Every log entry is automatically linked to traces, services, and hosts
Pros: Industry-leading AI automation, deep topology awareness, minimal manual configuration
Cons: Premium enterprise pricing, steep learning curve, overkill for smaller teams
Pricing: Custom enterprise pricing (contact sales)
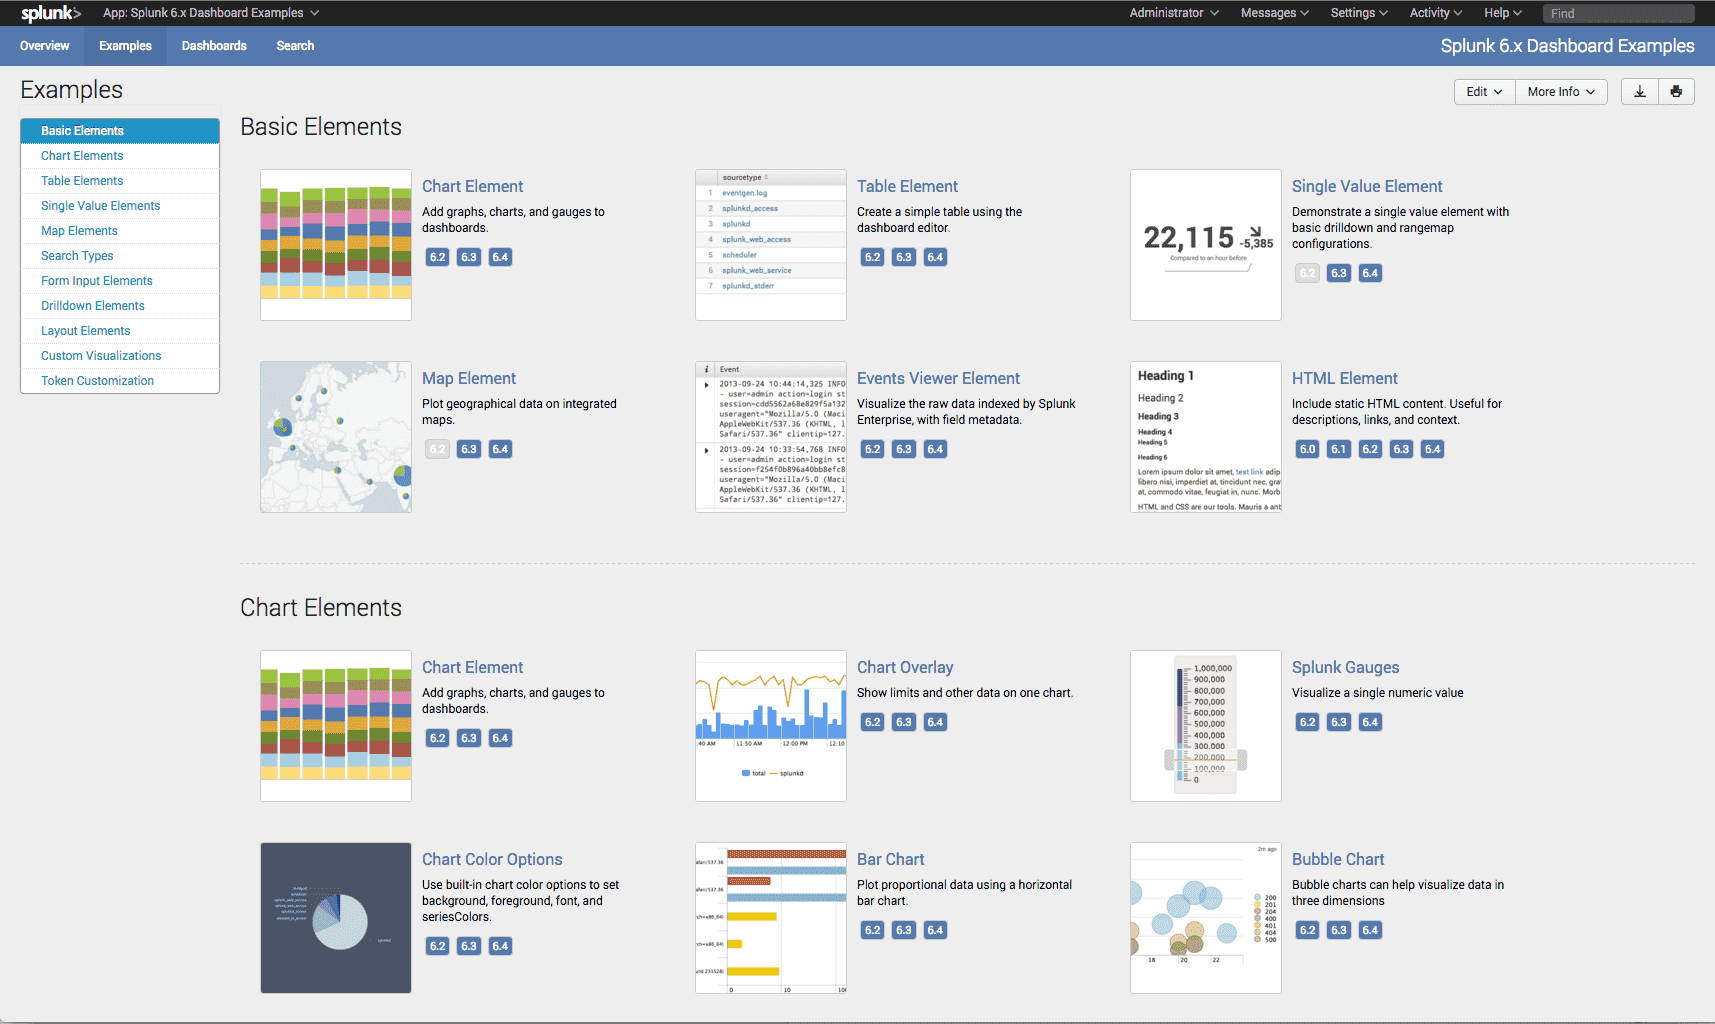
ELK Stack
Type: Source-available log analysis stack
License: Elastic License 2 (default distribution)
Search: Elasticsearch query language
Best for: DevOps teams wanting full control without licensing costs
Elastic ELK Stack is one of the most widely used self-managed log analysis solutions, with 5,000+ enterprise deployments. Ideal for organizations with technical expertise wanting full control over their log analysis infrastructure.
Key Features:
- Elasticsearch: Distributed search engine for fast log queries
- Logstash: Flexible data processing pipeline with 200+ plugins
- Kibana: Rich visualization and dashboard capabilities
- Beats: Lightweight data shippers for log collection
Pros: No licensing costs, highly customizable, strong community support
Cons: Requires technical expertise, resource-intensive, complex scaling
Pricing: Free self-hosted under ELv2; Elastic Cloud managed service pricing based on deployment size
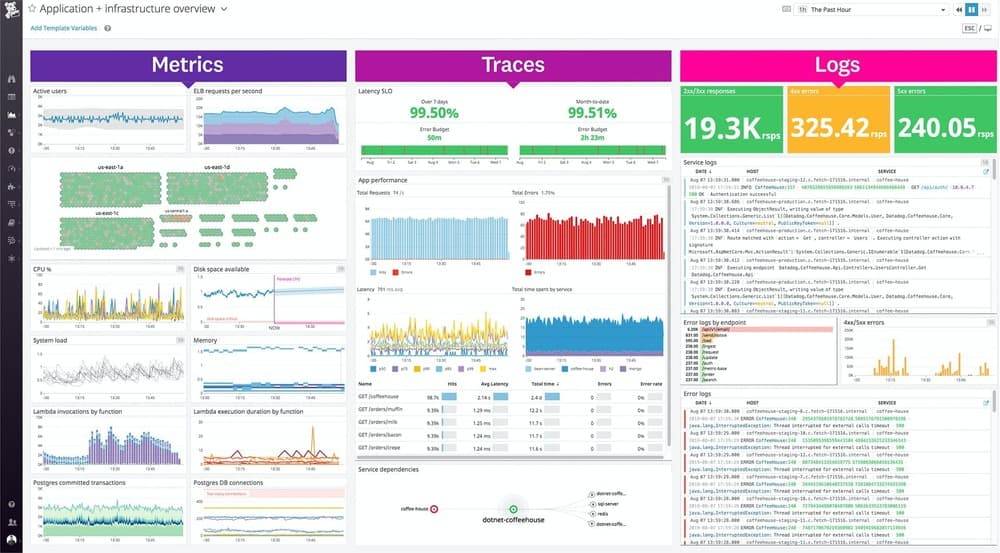
Datadog Logs
Type: Commercial observability platform
License: Proprietary SaaS
Search: Query builder
Best for: Unified observability with deep log-trace-metric correlation
Datadog integrates log analysis with infrastructure monitoring and APM tools, serving 30,500+ customers. Excellent correlation between logs, metrics, and traces in unified platform.
Key Features:
- Live Tail for real-time log streaming
- Automatic log-to-trace-to-metric correlation
- AI-powered pattern detection and clustering
- Unified logs, metrics, and traces platform
Pros: Excellent integration, user-friendly, powerful correlation
Cons: Expensive at scale, vendor lock-in concerns
Pricing: $0.10/GB ingested for processing + $1.70/M indexed log events for 15-day retention
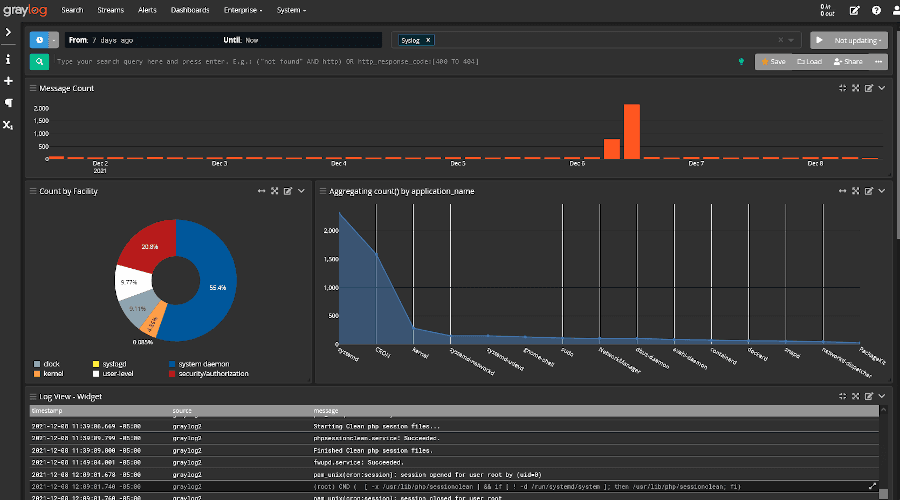
Graylog
Type: Source-available log management platform
License: SSPL
Search: Lucene
Best for: Mid-to-large enterprises needing flexible stream processing
Graylog combines self-hosted flexibility with enterprise features, offering powerful stream processing and real-time analysis. Popular option for organizations outgrowing ELK's operational complexity.
Key Features:
- Stream Processing: Real-time log processing and enrichment
- Dynamic Pipelines: Custom log transformation and routing rules
- Centralized Management: Unified configuration across distributed collectors
- Alert Framework: Flexible alerting with customizable conditions
Pros: Powerful processing capabilities, good documentation, reasonable pricing
Cons: Complex configuration, requires technical knowledge
Pricing: Free self-hosted (Graylog Open); Graylog Operations and Security commercial plans available
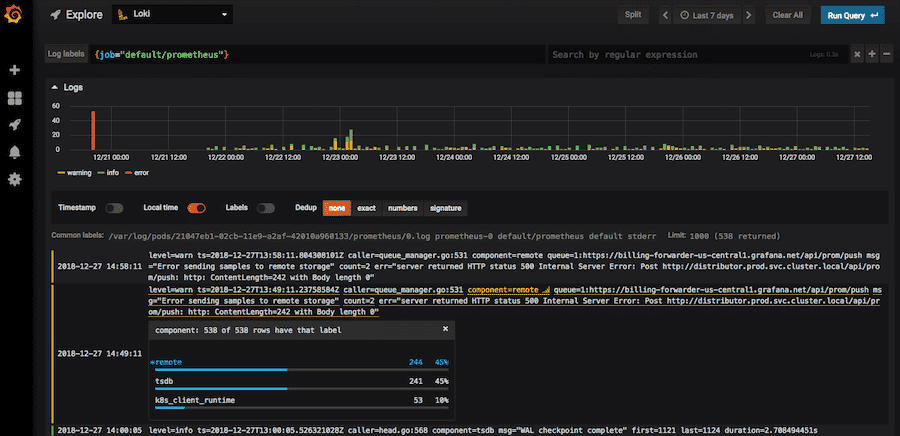
Grafana Loki
Type: Open source log aggregation system
License: AGPL
Search: LogQL
Best for: High-volume logs at low cost, Kubernetes environments
Grafana Loki takes a label-based approach to log indexing — only metadata labels are indexed, not the full log content. This dramatically reduces storage costs compared to Elasticsearch-based solutions, at the cost of slower full-text search performance.
Key Features:
- Label-based indexing keeps storage costs significantly lower than full-text indexes
- LogQL query language with metric extraction from log streams
- Native integration with Grafana for visualization and alerting
- Designed for Kubernetes with pod label auto-discovery and multi-tenancy support
Pros: Very low storage cost, seamless Grafana integration, cloud-native design
Cons: Slower full-text search than Elasticsearch, no standalone UI (requires Grafana)
Pricing: Free self-hosted; Grafana Cloud has a free tier with paid plans for higher volumes
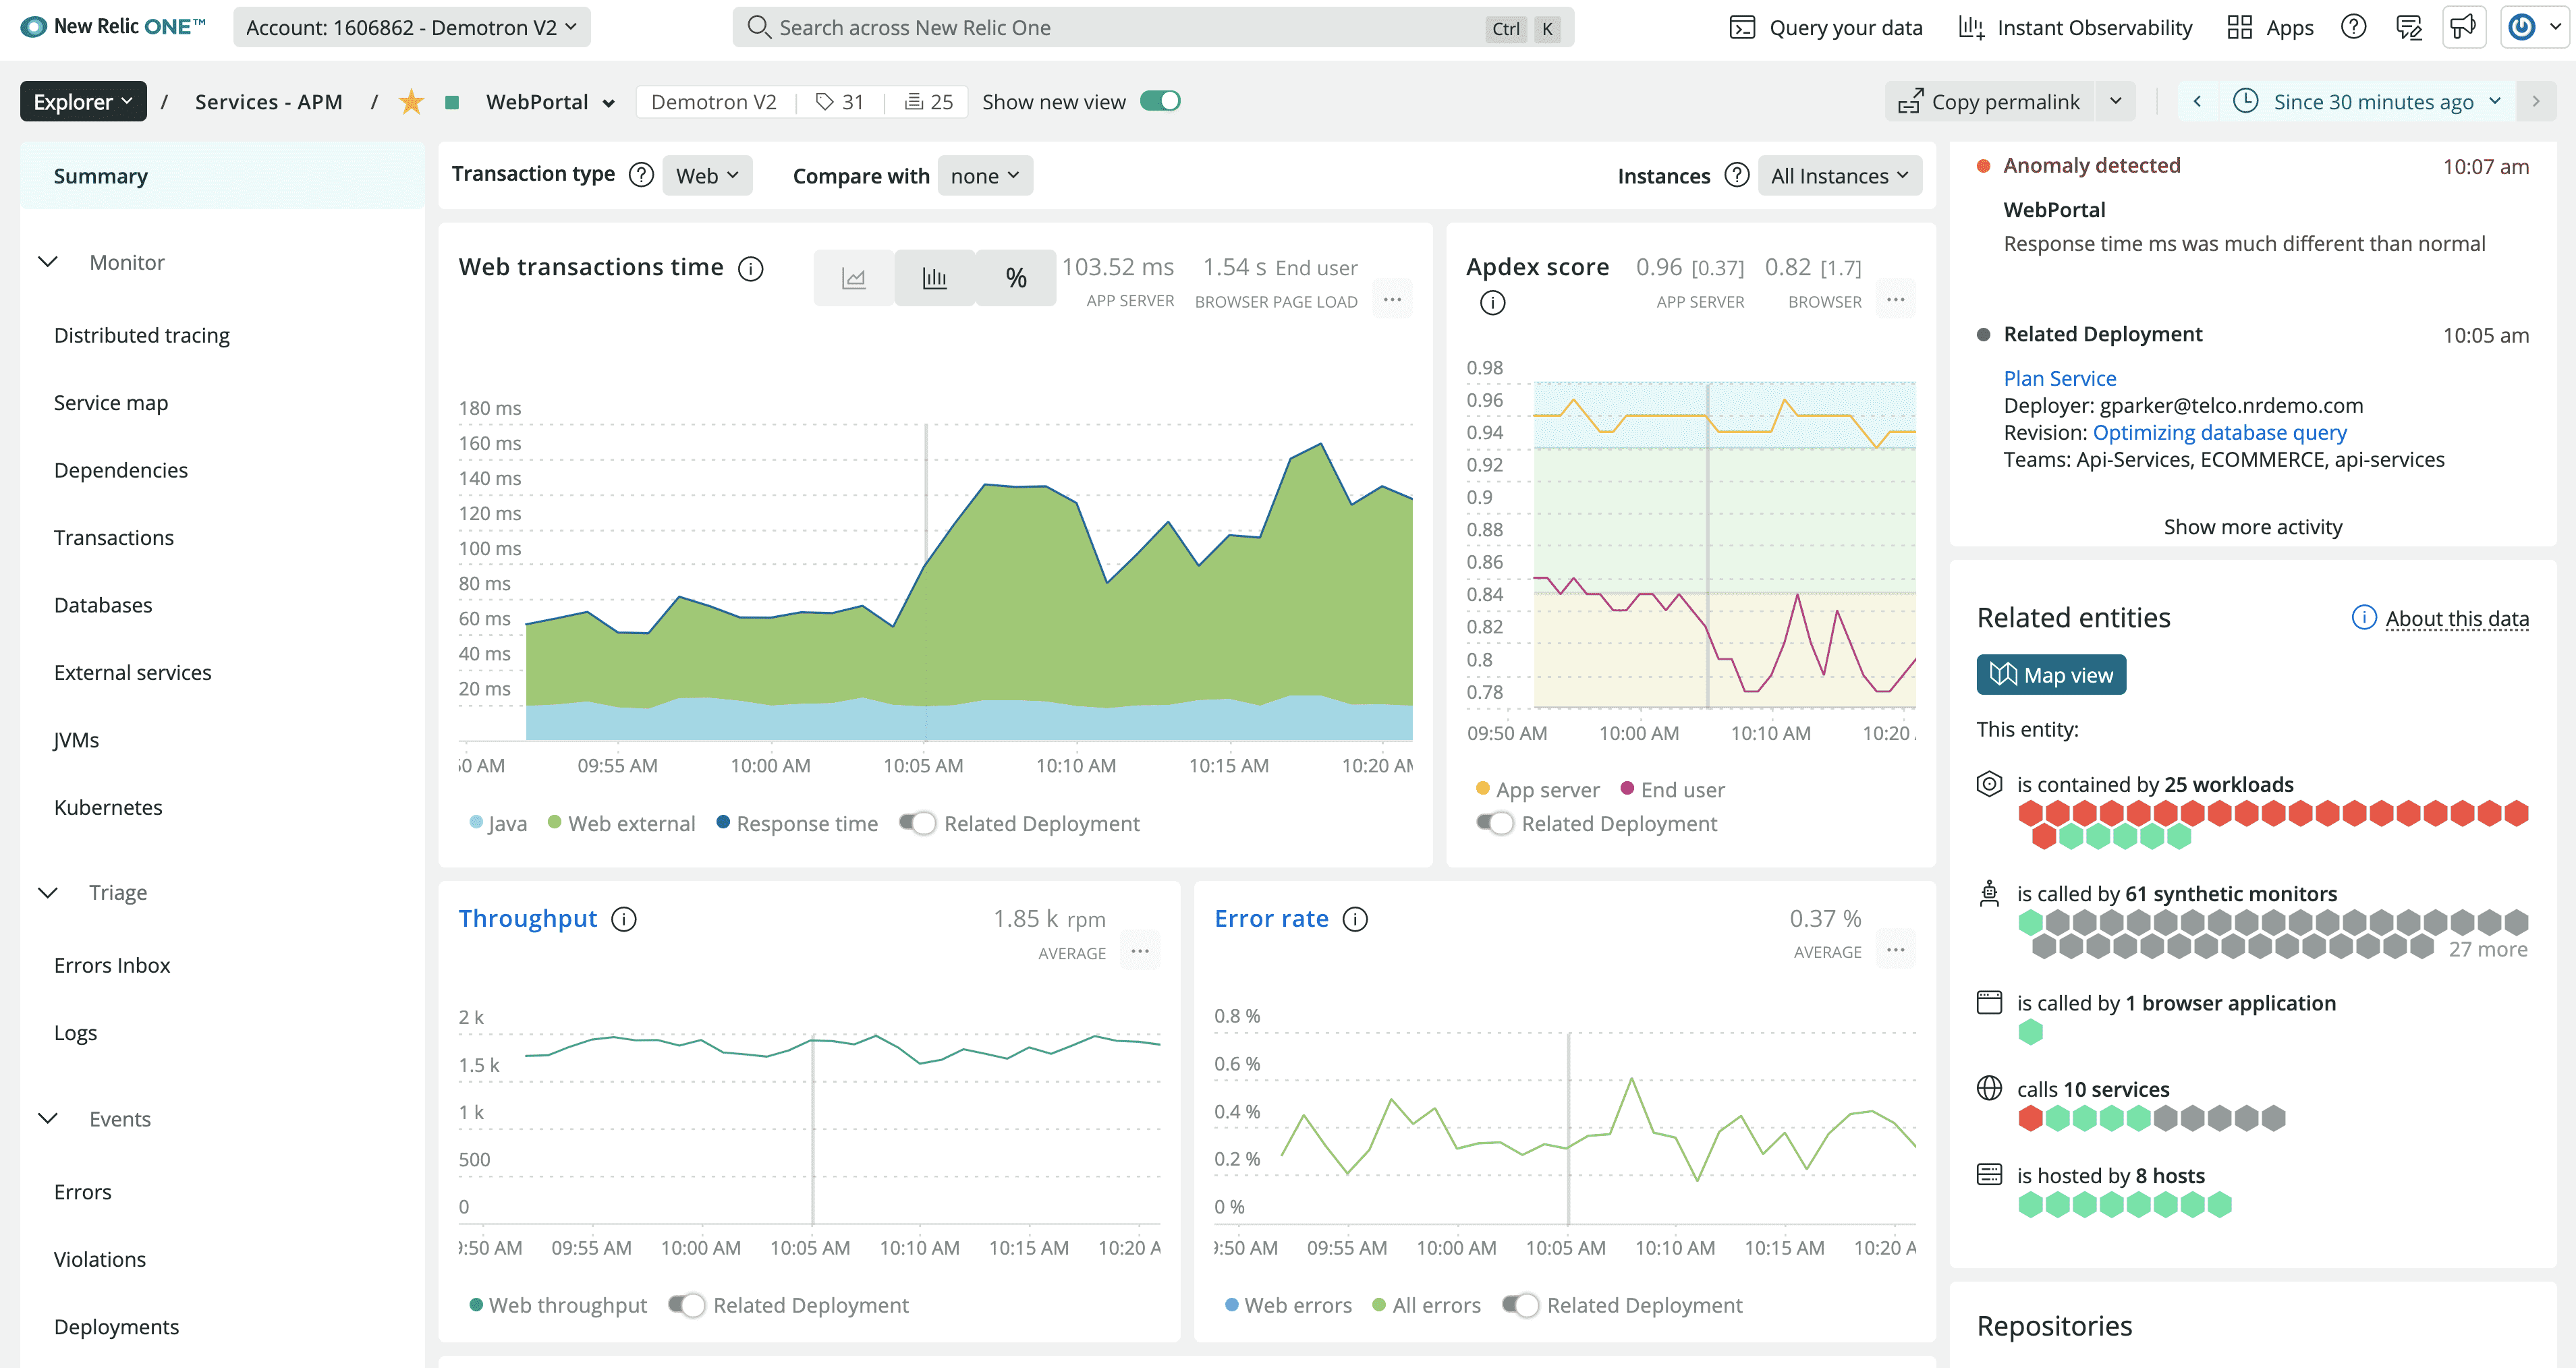
New Relic Logs
Type: Commercial observability platform
License: Proprietary SaaS
Search: NRQL (New Relic Query Language)
Best for: APM integration, development teams
New Relic serves 85,000+ active customers with strong APM-log correlation for application troubleshooting. Developer-friendly interface optimized for debugging workflows with generous free tier.
Key Features:
- Automatic log-to-APM correlation (Log Context)
- NRQL query builder for log analysis
- ML-powered anomaly detection
- Developer-optimized debugging workflows
Pros: Excellent APM integration, developer-friendly, generous free tier
Cons: Less comprehensive for pure log analysis, costly for high volumes
Pricing: Free tier + usage-based pricing
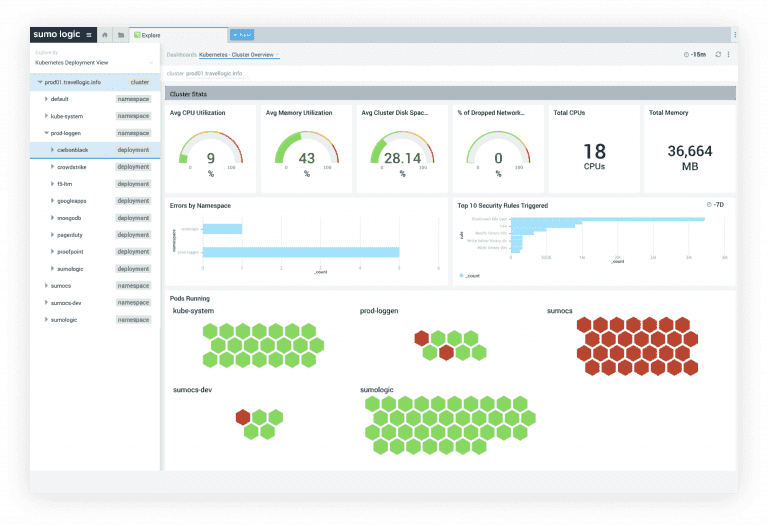
Sumo Logic
Type: Commercial cloud-native security analytics platform
License: Proprietary SaaS
Search: CQL (Continuous Query Language)
Best for: Security-focused organizations with compliance requirements
Sumo Logic serves 1,930+ customers with a strong focus on security analytics and compliance. Machine learning capabilities enable advanced threat detection and automated incident response across cloud and hybrid environments.
Key Features:
- Security Analytics: Built-in threat detection and investigation tools
- Machine Learning: Automated anomaly detection and behavioral analysis
- Compliance Support: Pre-built dashboards for GDPR, HIPAA, SOC2 requirements
- Cloud-Native: Built for cloud and hybrid environments
Pros: Strong security focus, good ML capabilities, compliance features
Cons: Premium pricing, complex for basic use cases
Pricing: Usage-based; contact sales for current rates
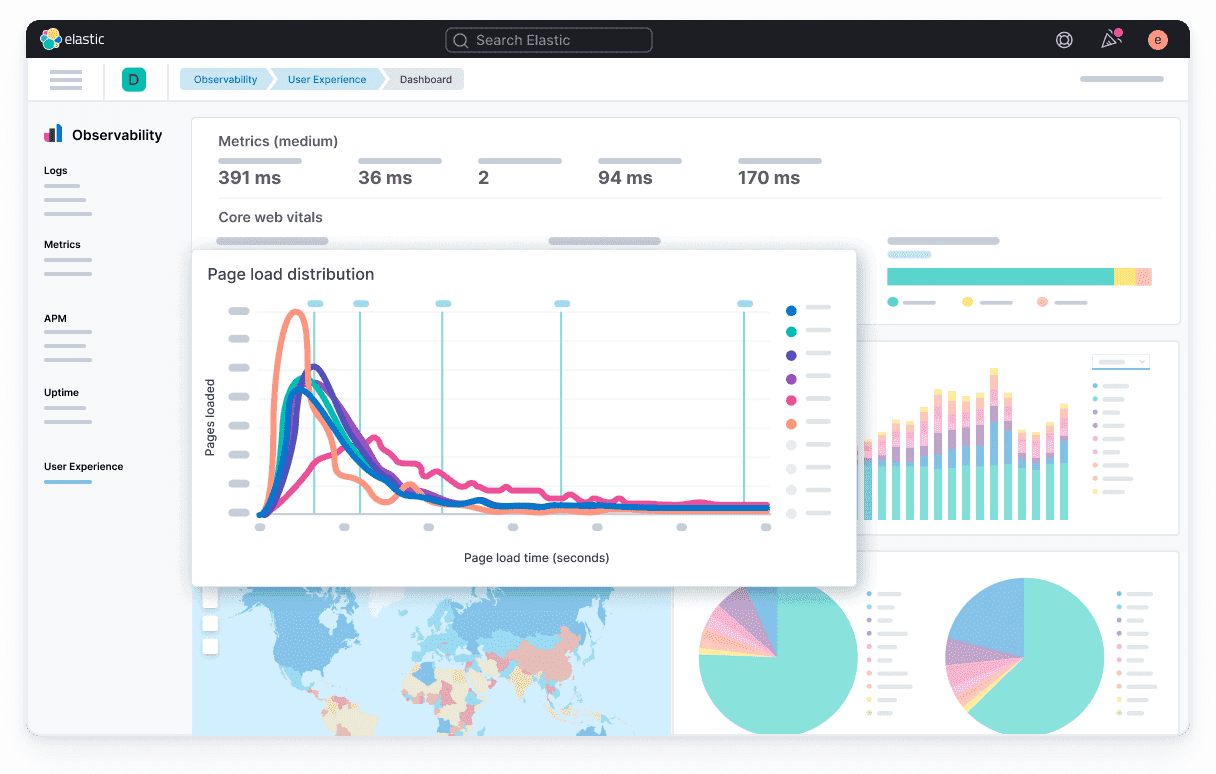
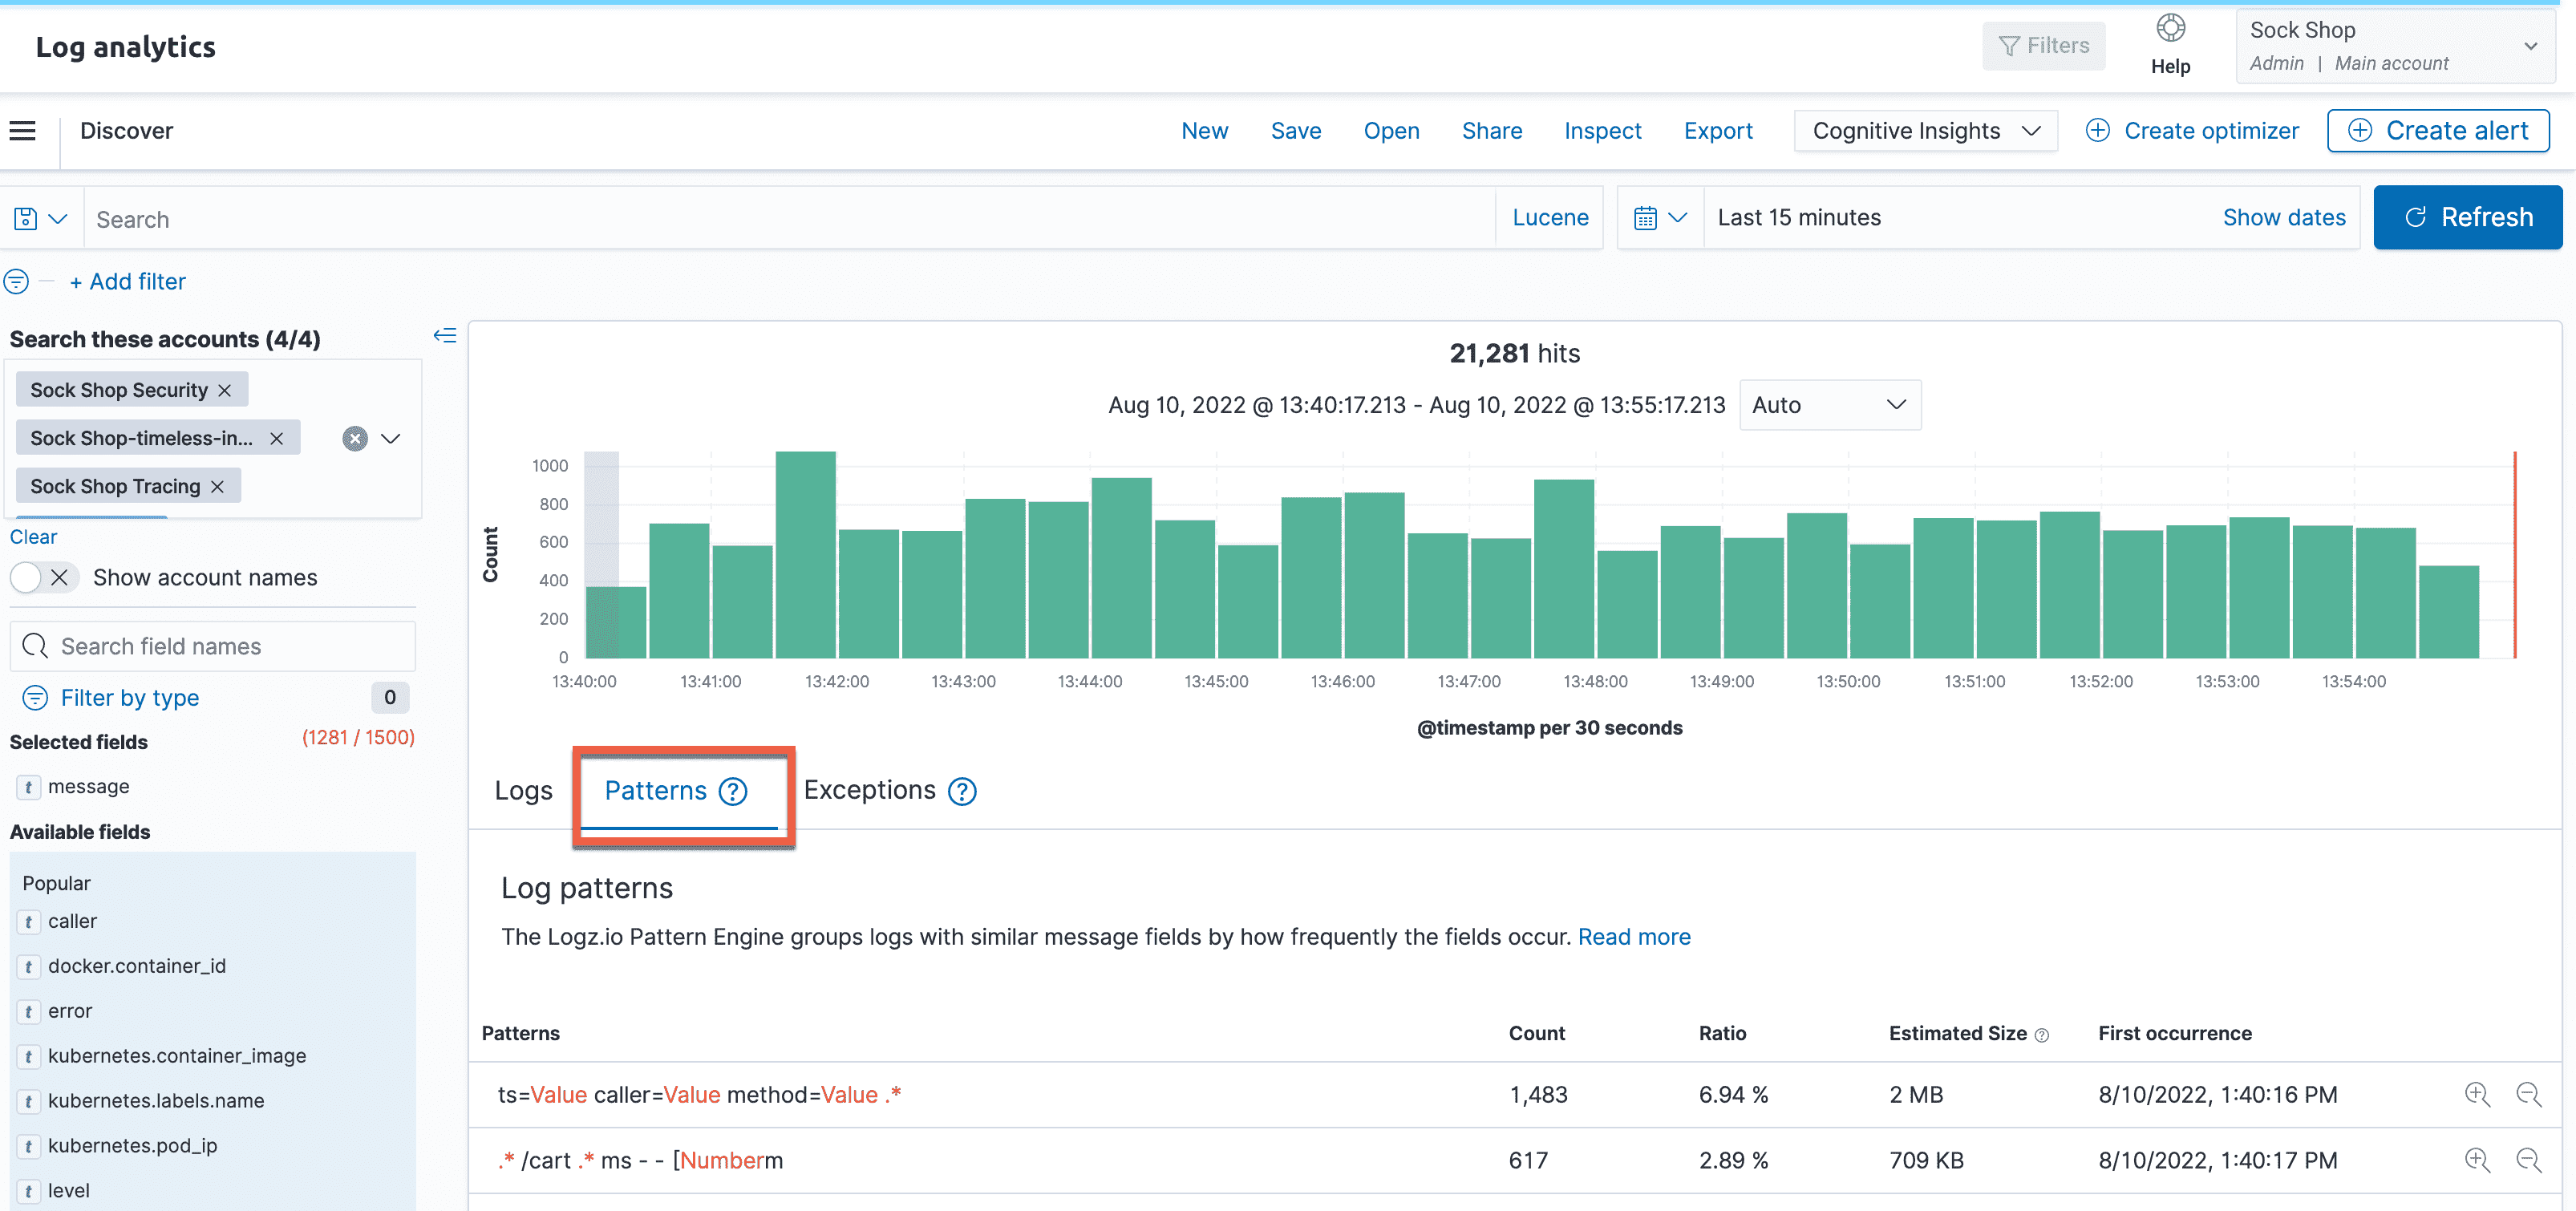
Logz.io
Type: Commercial managed ELK service
License: Proprietary SaaS
Search: Elasticsearch
Best for: Teams wanting ELK capabilities without infrastructure management
Logz.io provides a fully managed ELK Stack enhanced with AI-powered features for noise reduction and pattern recognition — removing operational overhead while retaining the familiar Kibana interface.
Key Features:
- Managed ELK: Fully managed Elasticsearch, Logstash, Kibana service
- AI Enhancement: Machine learning for log pattern detection
- Built-in Alerts: Intelligent alerting with noise reduction
- DevOps Integration: Strong CI/CD and development workflow support
Pros: No infrastructure management, AI enhancements, good support
Cons: Less customization than self-hosted ELK, vendor dependency
Pricing: Volume-based; contact sales for current rates
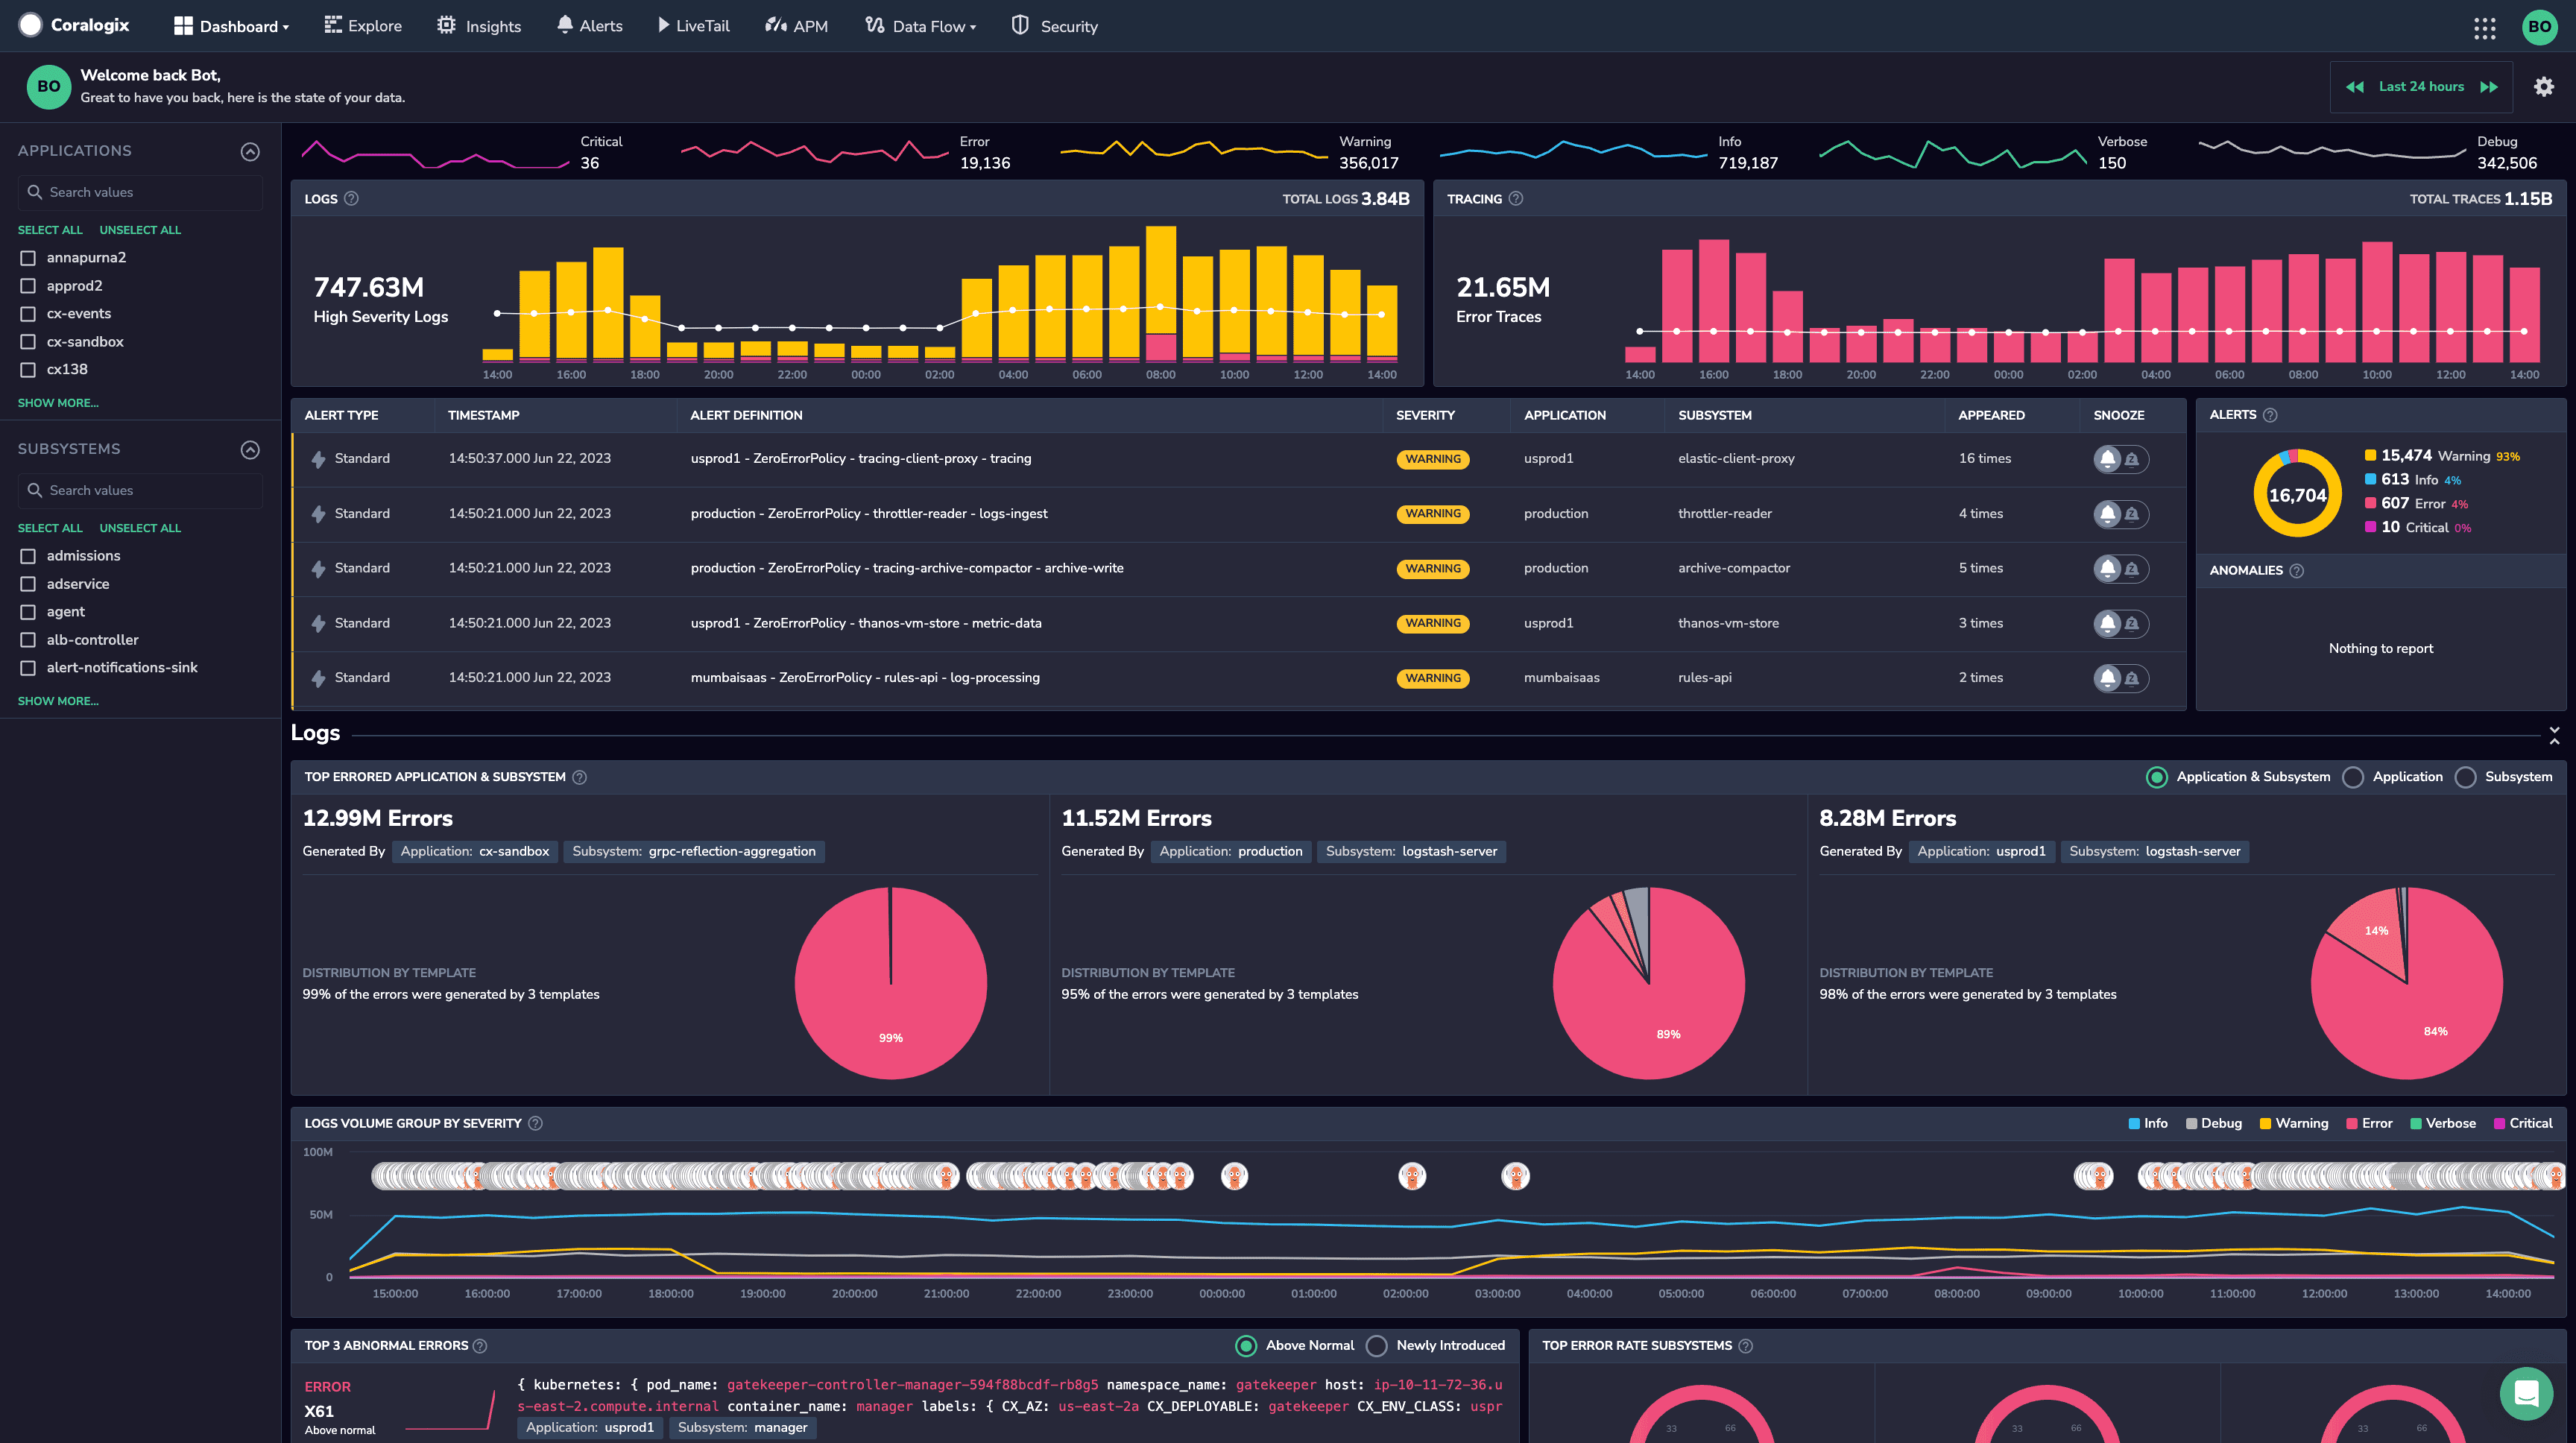
Coralogix
Type: Commercial AI-first observability platform
License: Proprietary SaaS
Search: DataPrime query language
Best for: Cost-efficient log analysis with AI-powered anomaly detection
Coralogix uses a tiered storage model ("Frequent Search", "Monitoring", "Compliance") where logs are routed based on expected query frequency. Logs you rarely query are archived cheaply and remain queryable on-demand — making effective cost competitive with Datadog at scale.
Key Features:
- Tiered Storage: Pay for query frequency, not just volume — rarely accessed logs are archived cheaply and queried on-demand
- Streaming ML: Anomaly detection runs on the log stream without pre-defined rules
- DataPrime: Query language with natural language assistance for non-technical teams
- Pre-built Parsing: Automatic parsing for 200+ log formats at ingest
Pros: Cost-efficient at scale, strong streaming ML, modern tiered architecture
Cons: Newer vendor, smaller ecosystem than Splunk or Elastic
Pricing: Usage-based; contact sales for current rates
Log Analysis Tool Comparisons
Splunk vs ELK Stack
Splunk offers commercial support, SPL query language, and advanced SIEM features with volume-based pricing. ELK provides a self-managed alternative with Elasticsearch search and Kibana visualization, but requires DevOps expertise for setup and scaling.
Choose Splunk if: Enterprise budget, need commercial support, SIEM features required
Choose ELK if: Technical team, budget constraints, want customization control
Datadog vs New Relic
Both integrate logs with APM and infrastructure monitoring. Datadog excels at correlation across logs/metrics/traces with Live Tail feature (~$0.10/GB+ pricing). New Relic offers generous free tier and developer-friendly interface but less comprehensive log analysis.
Choose Datadog if: Need deep log correlation, already use Datadog platform
Choose New Relic if: Application-focused, want free tier, developer workflows
Self-Hosted vs Commercial
Self-Hosted (Uptrace, Loki, ELK, Graylog): More control, lower software cost, and less vendor lock-in. Requires technical expertise for setup, scaling, and maintenance.
Commercial SaaS (Splunk, Datadog, Sumo Logic): Managed service, support, and easier setup. Higher cost, potential vendor lock-in, and less infrastructure control.
Log Analyzer vs SIEM
Log Analyzer: General-purpose log search, visualization, troubleshooting (ELK, Loki)
SIEM: Security-focused with threat intelligence, compliance, incident response (Splunk, Sumo Logic)
AI-Powered Log Analysis
Traditional log analyzers require you to know what to search for. AI-native tools shift from reactive querying to proactive anomaly detection — automatically surfacing root causes without manual correlation rules.
Dynatrace Davis AI: Correlates log events with infrastructure topology and traces. No query rules required — the AI links anomalies to specific deployments, services, or configuration changes across your full monitored stack.
Coralogix: Streaming analytics with ML-powered anomaly detection and a tiered storage model. Logs not immediately needed are archived cheaply and queried on-demand — competitive with Datadog on effective cost.
Logmind: Recognized in Gartner's 2025 Log Analytics Market Guide. Uses generative AI for natural language queries ("show me critical errors from the last hour") converted to precise search queries — accessible for non-technical teams.
Choose AI-powered tools if: You manage 50+ services, want to reduce alert fatigue, or need automated incident correlation. Expect enterprise pricing above traditional log analyzers.
Conclusion
Log analysis tools range from open source and source-available self-hosted stacks (Uptrace, Loki, ELK, Graylog) to commercial platforms (Splunk, Datadog, Dynatrace, Coralogix) with different trade-offs in cost, features, and complexity. Choose based on budget, technical expertise, security requirements, and whether you need unified observability or pure log analysis.
For complete observability, combine log analysis with distributed tracing tools and infrastructure monitoring.
FAQ
What is a log analyzer? A log analyzer is software that parses, searches, and visualizes log files from servers, applications, and networks. Log analyzers help identify errors, security threats, and performance issues by querying log data using search languages (SPL, Elasticsearch, LogQL) and displaying results in dashboards.
What are the best log analysis tools? Best log analysis tools: Uptrace (unified logs+traces+metrics, OTel-native), Splunk (enterprise SIEM, SPL search), Dynatrace (AI-powered root cause analysis), ELK Stack (self-managed Elasticsearch stack), Datadog (unified observability), Graylog (stream processing), and Grafana Loki (cost-efficient). Choose based on budget, technical expertise, and security requirements.
What is log file analysis? Log file analysis examines individual log files or aggregated logs to find patterns, errors, and anomalies. Analysis includes parsing structured/unstructured logs, searching for keywords or regex patterns, correlating events across multiple logs, and visualizing trends over time.
What are free log analysis tools? Free self-hosted log analyzers: ELK Stack (Elasticsearch + Kibana), Grafana Loki, Graylog Open, Uptrace (AGPL), and LOGalyze. These provide search, visualization, and alerting without SaaS licensing costs but require technical expertise for setup and operations.
What is the difference between log analysis and log management? Log analysis focuses on searching, querying, and visualizing logs to extract insights (Splunk, ELK). Log management handles collection, storage, and retention of logs from multiple sources (Fluentd, Vector). Most modern tools combine both capabilities.
How do log analysis tools work? Log analysis tools collect logs via agents or APIs, parse structured/unstructured formats, index content for fast search, provide query languages (SPL, Elasticsearch, SQL), visualize data in dashboards, and trigger alerts on patterns. Advanced tools add machine learning for anomaly detection.
What is the best log analyzer for Windows? Best Windows log analyzers: Splunk (Windows event log parsing), ELK Stack (Winlogbeat shipper), Graylog (Sidecar collector), Datadog (Windows Agent), and Coralogix (Windows agent + automatic parsing). Choose based on whether you need cloud/on-premise and Windows-only vs multi-platform support.
What are log analysis tools used for? Log analysis tools troubleshoot application errors, detect security threats (intrusions, malware), monitor system performance, ensure compliance (GDPR, HIPAA, SOX), debug microservices, analyze user behavior, and correlate events across distributed systems for root cause analysis.
How to choose a log analyzer? Consider: (1) volume (GB/day ingested), (2) search capabilities (query language flexibility), (3) budget (free self-hosted vs usage-based commercial pricing), (4) technical expertise (managed SaaS vs self-hosted), (5) integration needs (APM, metrics, SIEM), (6) retention requirements (compliance mandates).
What is the best free log analyzer? Best free self-hosted options: ELK Stack (widely used, Elasticsearch search), Grafana Loki (cost-efficient storage), Graylog Open (stream processing), Uptrace (unified logs+traces), and LOGalyze (security-focused). ELK offers the richest feature set; Loki is often best for high volumes.
Can log analyzers detect security threats? Yes. Log analyzers detect threats by searching for suspicious patterns (failed logins, privilege escalation), correlating events across logs (attack chains), using machine learning for anomaly detection, integrating threat intelligence feeds, and triggering alerts on SIEM rules. Splunk and Sumo Logic excel at security analysis.
What is the difference between Splunk and ELK? Splunk is commercial with SPL query language, managed service, advanced SIEM features, and volume-based pricing. ELK is typically self-managed with Elasticsearch search and Kibana dashboards under Elastic's ELv2 release license, but requires DevOps expertise for setup and scaling. Both handle petabyte-scale logs.