New Relic Alternatives and Competitors for 2025
New Relic alternatives include commercial platforms (Datadog, Dynatrace) and open source solutions (Elastic APM, Prometheus + Grafana, Uptrace). Organizations seek alternatives for cost optimization, specific features, or open source flexibility. This comparison covers features, pricing, and use cases to help select the right APM tool.
Quick Comparison
| Alternative | Type | License | Best For | Pricing | Open Source |
|---|---|---|---|---|---|
| Datadog | Commercial | Proprietary | Unified observability | $15/host/month | No |
| Dynatrace | Commercial | Proprietary | AI-powered insights | Usage-based | No |
| Elastic APM | Open Core | Apache 2.0/Elastic | Open source flexibility | Free/Paid | Yes |
| Prometheus + Grafana | Open Source | Apache 2.0 | Kubernetes monitoring | Free | Yes |
| Uptrace | Open Core | AGPL/Commercial | Cost-effective APM | Free/Paid | Yes |
New Relic Alternatives and Competitors
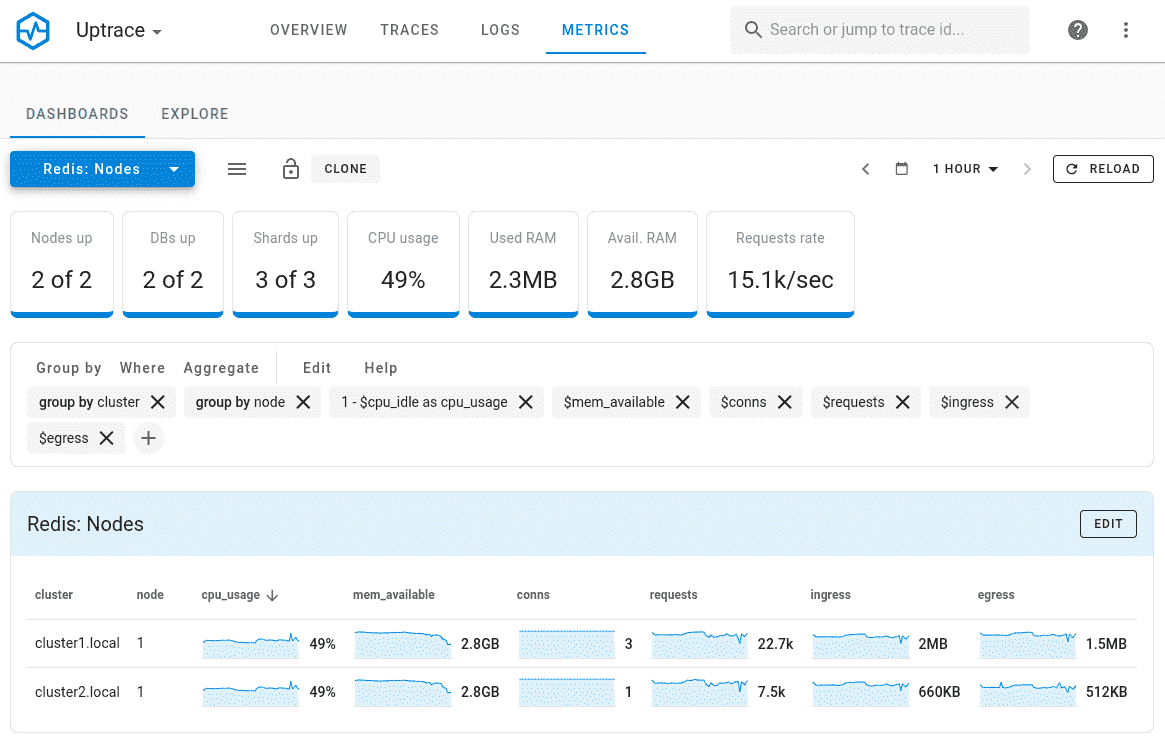
Uptrace
Market Position: Cost-effective OpenTelemetry-native APM platform
Uptrace provides unified observability with distributed tracing, metrics, and logs through OpenTelemetry standards. ClickHouse-based storage enables 10-20x data compression for cost-efficient monitoring.
Key Features:
- OpenTelemetry Native: Built-in support for modern observability standards
- Unified Platform: Traces, metrics, and logs in single interface
- Cost-Efficient Storage: ClickHouse compression reduces infrastructure costs
- SQL Performance Monitoring: Query-level visibility across databases
Best For: Teams adopting OpenTelemetry and organizations prioritizing cost-efficiency
Pros: Transparent pricing, OpenTelemetry standards, low infrastructure costs, self-hosted option
Cons: Smaller ecosystem than established vendors, newer platform
Pricing: Free open source (AGPL); commercial licenses with transparent pricing
Datadog
Market Position: Leading unified observability platform with 30,500+ customers
Datadog offers comprehensive monitoring across infrastructure, applications, and logs. Strong cloud integration and AI-powered insights make it a primary New Relic competitor for organizations requiring full-stack visibility.
Key Features:
- Unified Observability: Metrics, traces, and logs in single platform
- Cloud Integration: Native support for AWS, Azure, GCP, and Kubernetes
- AI-Powered Alerting: Machine learning for anomaly detection and forecasting
- Extensive Integrations: 600+ integrations with third-party services
Best For: Organizations needing comprehensive observability across hybrid and multi-cloud environments
Pros: Powerful correlation capabilities, extensive integrations, user-friendly interface
Cons: Costs can escalate with scale, complex pricing model
Pricing: Infrastructure monitoring starts at $15/host/month (Pro plan), APM from $31/host/month
Dynatrace
Market Position: Enterprise APM platform with AI-powered automation
Dynatrace differentiates itself through Davis AI engine, which automates performance monitoring, problem detection, and root cause analysis. Enterprise-focused solution for organizations requiring advanced automation.
Key Features:
- Davis AI Engine: Automated root cause analysis and anomaly detection
- Automatic Topology Mapping: Real-time discovery of application dependencies
- Full-Stack Monitoring: Infrastructure, applications, and user experience
- Cloud-Native Support: Strong Kubernetes and hybrid environment capabilities
Best For: Large enterprises requiring automated problem detection and analysis
Pros: Advanced AI automation, comprehensive topology mapping, minimal manual configuration
Cons: Premium pricing, complex for smaller deployments
Pricing: Usage-based model starting at $0.08/hour for full-stack monitoring (~$58-115/month per 8 GiB host)
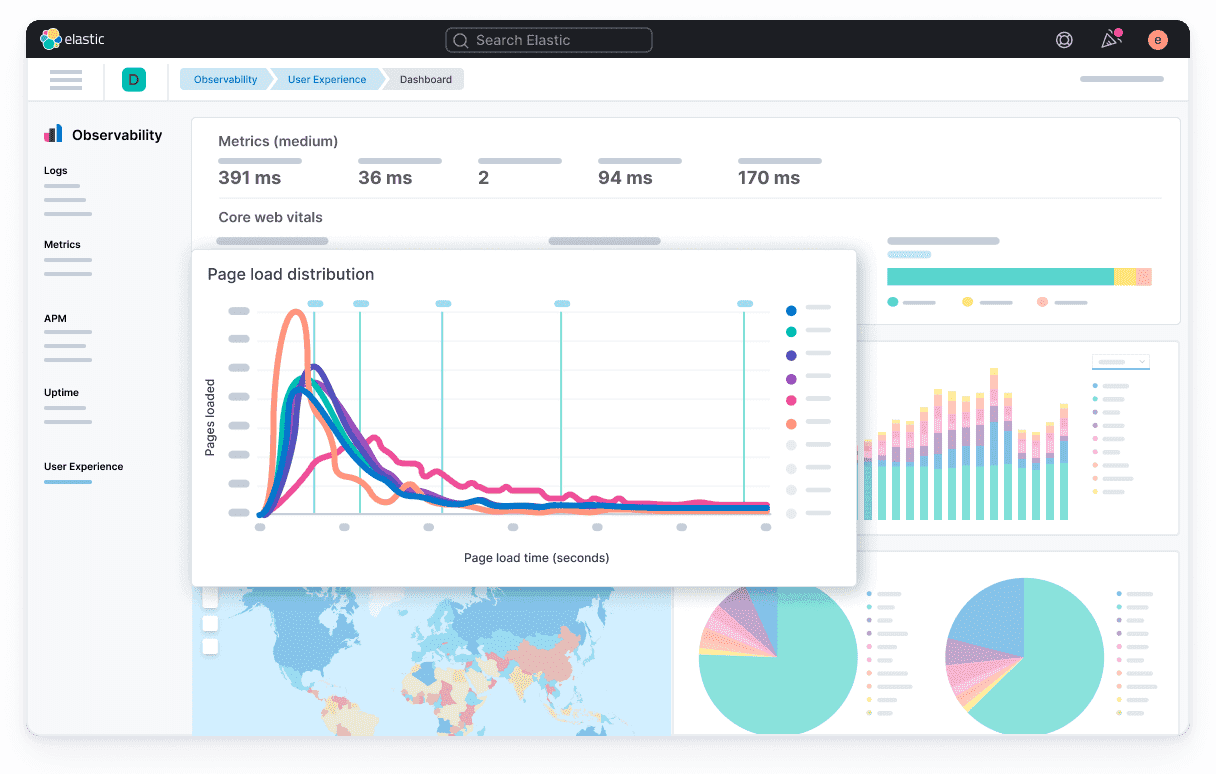
Elastic APM
Market Position: Popular open source alternative with flexible deployment options
Elastic APM (version 9.2.2) is part of the Elastic Stack, providing open-core APM capabilities with integrated logs, metrics, and traces. Self-hosted or managed cloud deployment options appeal to organizations prioritizing data control.
Key Features:
- Integrated Observability: Logs, metrics, and traces in Elasticsearch
- Machine Learning: Built-in anomaly detection and forecasting
- Flexible Deployment: Self-hosted, Elastic Cloud, or hybrid options
- Powerful Search: Elasticsearch query capabilities across telemetry data
Best For: Organizations wanting open source flexibility with option for commercial support
Pros: Open source core, powerful search, flexible deployment, no vendor lock-in
Cons: Requires Elasticsearch expertise, operational overhead for self-hosted deployments
Pricing: Free open source version; Elastic Cloud from $95/month
Prometheus + Grafana
Market Position: De facto standard for Kubernetes and cloud-native monitoring
The combination of Prometheus for metrics collection and Grafana for visualization has become the standard open source monitoring stack, especially in Kubernetes environments. Fully open source with strong community support.

Key Features:
- Scalable Metrics Collection: Pull-based architecture with service discovery
- PromQL Query Language: Powerful querying and aggregation capabilities
- Extensive Exporters: 200+ community exporters for various systems
- Flexible Dashboards: Grafana's customizable visualization and templating
Best For: Kubernetes environments and organizations preferring fully open source solutions
Pros: Completely free, strong community, excellent Kubernetes integration, no vendor lock-in
Cons: Requires operational expertise, limited out-of-box APM features, separate tools needed for logs and traces
Pricing: Free and open source
Tool Comparisons
Datadog vs New Relic
Datadog offers unified observability with 600+ integrations and AI-powered insights at $15/host/month (infrastructure). New Relic provides usage-based pricing but can become expensive at scale. Choose Datadog for extensive integrations and cloud-native focus, or New Relic for application-centric monitoring.
Dynatrace vs New Relic
Dynatrace excels with Davis AI for automated root cause analysis and automatic topology mapping. New Relic offers broader language support and easier onboarding. Choose Dynatrace for large enterprises requiring automation, or New Relic for development teams prioritizing developer experience.
Elastic APM vs New Relic
Elastic APM provides open source flexibility with powerful Elasticsearch search capabilities. New Relic offers managed SaaS convenience but with vendor lock-in. Choose Elastic for data sovereignty and customization, or New Relic for managed service simplicity.
Prometheus + Grafana vs New Relic
Prometheus + Grafana is completely free and open source, ideal for Kubernetes. New Relic provides integrated APM features beyond metrics. Choose Prometheus + Grafana for cost-conscious Kubernetes deployments, or New Relic for comprehensive out-of-box APM capabilities.
Open Source vs Commercial
Open Source (Elastic APM, Prometheus, Uptrace): Free, customizable, no vendor lock-in. Requires operational expertise and self-management.
Commercial (Datadog, Dynatrace, New Relic): Managed service, enterprise support, faster setup. Higher costs, potential vendor lock-in.
FAQ
What are the best New Relic alternatives? Best New Relic alternatives include Datadog (unified observability, $15/host/month), Dynatrace (AI-powered automation), Elastic APM (open source flexibility), Prometheus + Grafana (free Kubernetes monitoring), and Uptrace (cost-effective OpenTelemetry). Choose based on budget, deployment preferences, and feature requirements.
Who are New Relic's main competitors? New Relic's main competitors are Datadog (30,500+ customers, comprehensive integrations), Dynatrace (Davis AI automation), AppDynamics (Cisco-backed enterprise APM), Elastic APM (open source alternative), and Splunk APM. Each offers different strengths in observability and monitoring capabilities.
What is the best open source alternative to New Relic? Best open source New Relic alternatives: Elastic APM (Elasticsearch-based with version 9.2.2), Prometheus + Grafana (Kubernetes standard), Uptrace (OpenTelemetry-native with AGPL license), and Apache SkyWalking. Elastic APM offers richest features; Prometheus + Grafana best for Kubernetes.
Is there a free alternative to New Relic? Yes, free alternatives include Prometheus + Grafana (completely open source), Elastic APM open source version, Uptrace AGPL edition, and Grafana Cloud free tier. These require self-hosting and technical expertise but provide APM capabilities without licensing costs.
How does Datadog compare to New Relic? Datadog offers 600+ integrations, unified metrics/traces/logs, and AI-powered insights at $15/host/month. New Relic provides usage-based pricing and strong APM features but can be expensive at scale. Both support similar technologies; choose Datadog for integrations or New Relic for application focus.
What is cheaper than New Relic? Cheaper alternatives: Prometheus + Grafana (free), Elastic APM open source (free), Uptrace (transparent pricing, lower infrastructure costs), and Grafana Cloud (free tier + usage-based). Open source options require operational expertise. Uptrace offers lowest cost for managed solution with OpenTelemetry.
Can I migrate from New Relic to another APM tool? Yes, migration is possible through OpenTelemetry instrumentation (vendor-neutral standard). Replace New Relic agents with OpenTelemetry SDKs, configure new backend (Uptrace, Elastic APM, etc.), run parallel monitoring during transition, then deprecate New Relic. Most distributed tracing tools support OpenTelemetry for easier migration.
Which New Relic alternative is best for Kubernetes? Best Kubernetes alternatives: Prometheus + Grafana (de facto standard, native integration), Datadog (strong Kubernetes support with auto-discovery), Elastic APM (Kubernetes monitoring with logs/metrics/traces), and Uptrace (OpenTelemetry-native). Prometheus + Grafana offers most mature Kubernetes integration.
Conclusion
Ready to switch from New Relic? Follow our Get New Relic migration guide to move agents, dashboards, and alerts to Uptrace without losing visibility.
You may also be interested in:
For complete observability, modern SRE tools combine APM with infrastructure monitoring and incident management. OpenTelemetry adoption provides vendor neutrality for future migrations. Organizations seeking comprehensive monitoring across applications and infrastructure should evaluate APM tools alongside other observability platforms like Datadog alternatives and Dynatrace competitors.