Evaluating Synthetic Monitoring Platforms: What to Look for in 2025
Synthetic monitoring simulates user interactions with applications to proactively identify performance issues before they impact real users. Modern distributed systems require sophisticated monitoring capabilities to effectively test microservices, APIs, and complex user journeys across diverse environments. This article provides a framework to evaluate synthetic monitoring platforms in 2025.
Fundamentals
Synthetic monitoring uses automated scripts to simulate user interactions at regular intervals, measuring performance, availability, and functionality from various locations. Its core purpose is to proactively detect issues before they affect actual users by consistently testing critical business functions.
Unlike Real User Monitoring (RUM) which passively captures actual user experiences, synthetic monitoring provides controlled, consistent testing on predetermined schedules. It measures availability even when no users are present and benchmarks performance under consistent conditions.
Key use cases include business-critical pathway monitoring, SLA verification, competitor benchmarking, pre-release validation, global performance evaluation, and third-party service monitoring.
Evaluation Criteria
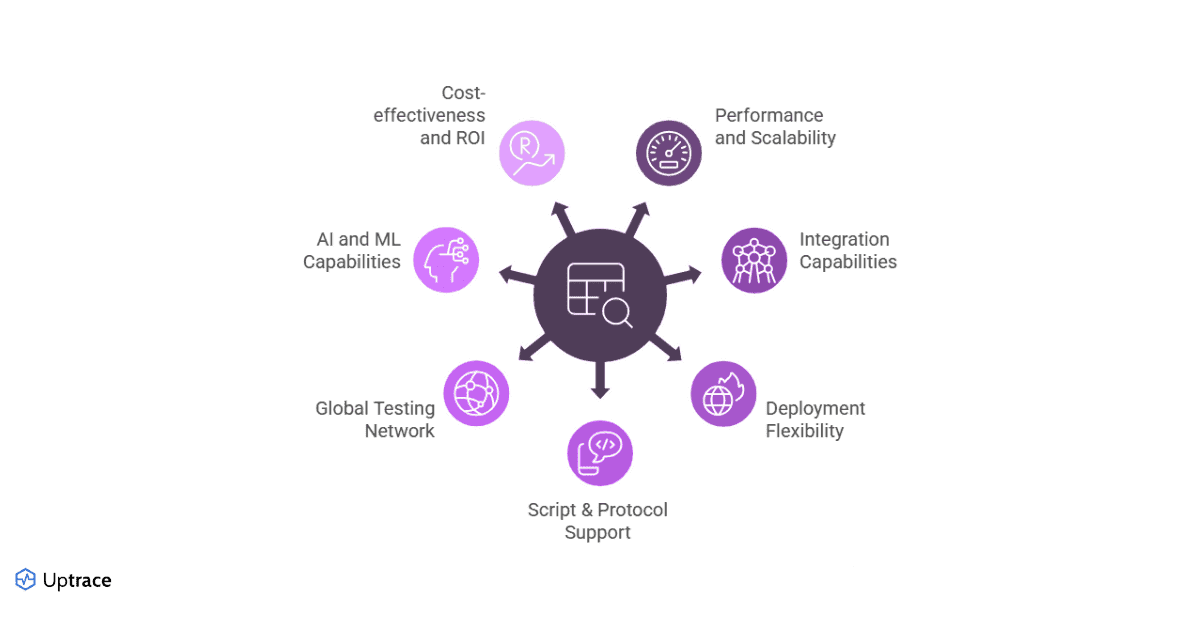
Performance and Scalability
Modern platforms must support frequent test execution, concurrent test runs, and maintain performance under load. Evaluate test frequency capabilities, concurrent execution limits, and the platform's own performance during peak testing periods.
Integration Capabilities
Effective synthetic monitoring platforms seamlessly connect with broader observability tools like Uptrace, Datadog, and New Relic. They should integrate with alerting systems, provide comprehensive APIs, and support CI/CD pipeline integration for automated testing.
Deployment Flexibility
Platforms should offer cloud-based options, on-premise deployment for data sovereignty, hybrid capabilities, and edge deployment options for testing from diverse network locations.
Script & Protocol Support
Evaluate supported languages (JavaScript, Python, Go), protocol coverage (HTTP/HTTPS, WebSocket, gRPC, MQTT), low-code options for non-technical users, and custom scripting flexibility for complex scenarios.
Global Testing Network
Consider geographic coverage, private location support, backbone versus last-mile testing capabilities, and IPv6 support when evaluating platforms.
AI and ML Capabilities
Modern platforms use AI for anomaly detection without manual thresholds, baseline automation, root cause analysis, and predictive alerts to identify potential issues before they occur.
Cost-effectiveness and ROI
Evaluate pricing models, total cost of ownership, value metrics, and resource efficiency to ensure the platform delivers measurable business value.
Must-Have Capabilities
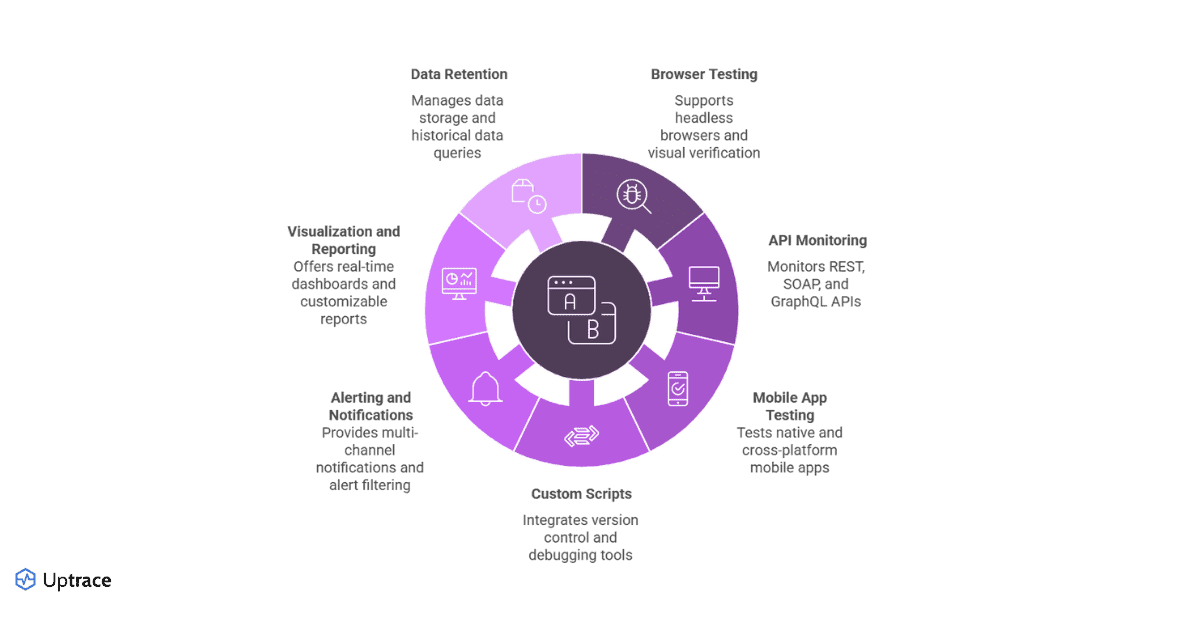
Browser Testing
Essential capabilities include headless browser support, visual verification, DOM interaction, JavaScript execution, multi-step workflow testing, and mobile browser emulation.
API Monitoring
Look for REST, SOAP, and GraphQL support, authentication methods, response validation, performance metrics collection, contract testing, and payload inspection capabilities.
Mobile Application Testing
Modern platforms should support native app testing, cross-platform capabilities, geolocation simulation, device-specific testing, network condition emulation, and app store monitoring.
Custom Scripts
Evaluate version control integration, script debugging tools, parameterization capabilities, data-driven testing support, reusable component libraries, and environment variable management.
Alerting and Notifications
Effective platforms provide multi-channel notifications, alert filtering and prioritization, escalation policies, alert correlation, status page integration, and on-call schedule management.
Visualization and Reporting
Look for real-time dashboards, customizable reports, trend analysis, SLA compliance reporting, performance comparison tools, and stakeholder-specific views.
Data Retention
Consider data storage duration, data resolution, query capabilities for historical data, export options, retention policy management, and storage efficiency.
Advanced Features
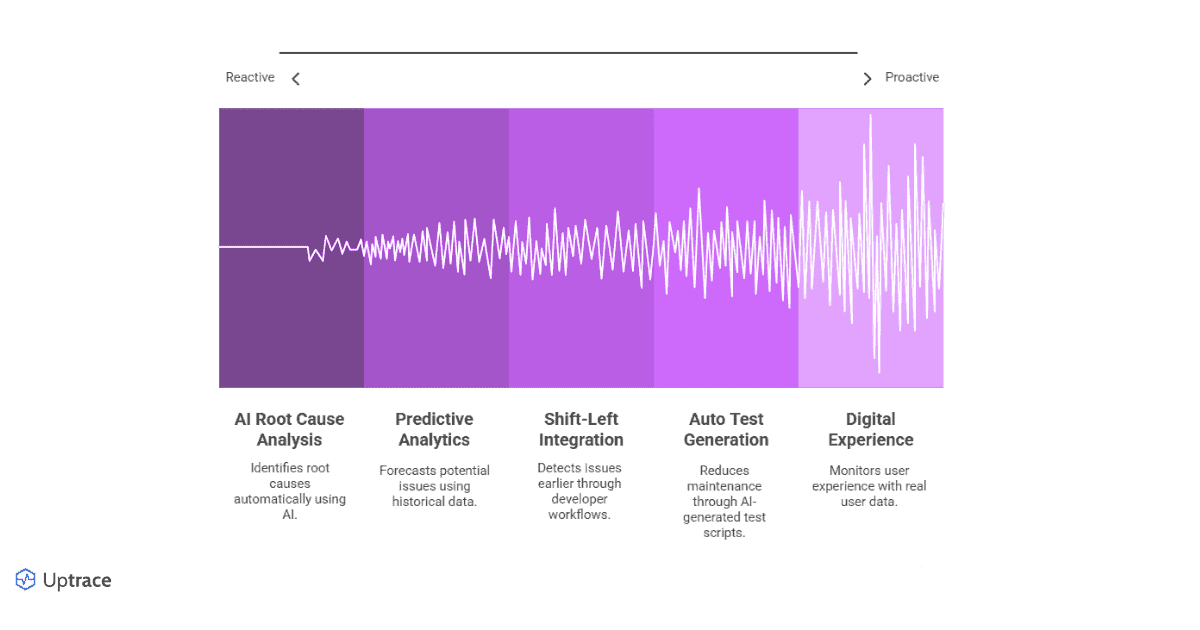
AI Root Cause Analysis
Advanced platforms employ AI to automatically identify root causes of detected issues by analyzing patterns across metrics, logs, and traces. This significantly reduces mean time to resolution (MTTR).
Predictive Analytics
Predictive capabilities use historical data to forecast potential issues before they impact users through trend analysis, seasonal pattern recognition, anomaly prediction, and early warning systems.
Auto Test Generation
Modern platforms reduce maintenance through AI-generated test scripts based on user sessions, self-healing tests that adapt to UI changes, automatic updates when applications change, and test coverage improvement suggestions.
Shift-left Integration
Integration with development workflows enables earlier detection through developer-friendly APIs, Git integration, pre-commit hooks, automated test generation from specifications, and performance regression detection.
Digital Experience
Comprehensive user experience monitoring combines Core Web Vitals measurements, user journey analytics, synthetic and real user data correlation, third-party script impact analysis, and frontend optimization recommendations.
Effective Synthetic Monitoring
Observability Integration
Effective synthetic monitoring connects with broader observability tools to provide context when issues occur, enabling correlation between test failures and backend traces, unified alerting, combined dashboards, and shared metadata.
Uptrace + k6
Uptrace's integration with k6 exemplifies an effective synthetic monitoring pipeline, combining k6's performance testing capabilities with Uptrace's distributed tracing and metrics platform.
The integration works by sending k6 test results to Uptrace via OpenTelemetry exporters, where they're correlated with backend traces and metrics. This provides end-to-end visibility from user actions to database queries, precise identification of bottlenecks, and reduced MTTR through comprehensive context.
import http from 'k6/http'
import { check } from 'k6'
import { trace } from 'k6-opentelemetry'

// Configure OpenTelemetry to send data to Uptrace
const tracer = trace.newTracer({
  serviceName: 'checkout-synthetic-tests',
  exporter: {
    type: 'otlp',
    endpoint: 'https://uptrace.example.com:4317',
    headers: { 'uptrace-dsn': 'https://<secret>@api.uptrace.dev/1' },
  },
})

export default function () {
  // Create a span for the entire test
  const span = tracer.startSpan('checkout-flow')

  try {
    // Test the login page
    const loginRes = http.post('https://example.com/login', {
      username: 'testuser',
      password: 'password123',
    })

    check(loginRes, {
      'login successful': (r) => r.status === 200,
    })

    // Test adding item to cart
    const addToCartRes = http.post('https://example.com/cart/add', {
      productId: '12345',
      quantity: 1,
    })

    check(addToCartRes, {
      'item added to cart': (r) => r.status === 200,
    })

    // Test checkout process
    const checkoutRes = http.post('https://example.com/checkout', {
      paymentMethod: 'credit',
      shippingAddress: '123 Test St',
    })

    check(checkoutRes, {
      'checkout successful': (r) => r.status === 200,
    })
  } finally {
    // End the span regardless of success/failure
    span.end()
  }
}
Conclusion
Selecting the right synthetic monitoring platform requires evaluating both fundamental capabilities and advanced features. The ideal solution provides comprehensive testing capabilities, integrates with your observability stack, offers flexible deployment options, includes advanced AI capabilities, and demonstrates clear ROI.
When evaluating solutions, consider platforms like Uptrace that combine synthetic monitoring data with distributed tracing and metrics, offering the context needed to quickly identify and resolve performance issues.
FAQ
- What is synthetic monitoring and how does it differ from real user monitoring?
Synthetic monitoring uses automated scripts to simulate user interactions with applications at regular intervals, while real user monitoring captures actual user experiences. Synthetic monitoring is proactive, provides consistent testing conditions, runs on predetermined schedules, and measures availability even when no users are present. - What key criteria should I consider when evaluating synthetic monitoring platforms?
Key evaluation criteria include performance and scalability requirements, integration capabilities with observability tools, deployment flexibility, scripting capabilities, global testing network coverage, AI/ML features for anomaly detection, and cost-effectiveness. - How does synthetic monitoring integrate with OpenTelemetry?
Synthetic monitoring can leverage OpenTelemetry for standardized instrumentation, allowing test results to be correlated with backend traces and metrics. Platforms like Uptrace that support OpenTelemetry provide unified visibility across synthetic tests and system telemetry. - What are the must-have features for synthetic monitoring in 2025?
Essential capabilities include browser-based testing, API monitoring, mobile application testing, custom script support, comprehensive alerting systems, visualization and reporting tools, and historical data retention and analysis features. - How is AI transforming synthetic monitoring platforms?
AI capabilities now enable automated root cause analysis, predictive performance analytics, anomaly detection without manual thresholds, self-healing tests that adapt to UI changes, and predictive alerts that identify potential issues before they impact users.
Additional Resources
- Building a Simple Synthetic Monitor With OpenTelemetry - A practical guide from Honeycomb on creating a synthetic monitor using OpenTelemetry, .NET, and Azure Functions
- What is Synthetic Monitoring? - A comprehensive explanation of synthetic monitoring concepts from IBM, including benefits, applications, and best practices
You may also be interested in: