10 Best API Monitoring Tools in 2025 [Free & Open Source Options]
APIs drive 83% of internet traffic, making API monitoring essential for maintaining application reliability. With this volume of API requests, downtime or performance issues directly impact user experience and revenue. API monitoring tools track endpoint availability, response times, and error rates to help teams detect and resolve issues before they affect users.
Modern observability requires monitoring APIs alongside infrastructure metrics and centralized log management for complete system visibility.
What Is API Monitoring?
API monitoring continuously tracks the health, performance, and availability of API endpoints. Unlike basic uptime checks, API monitoring analyzes request-response cycles, measures latency, tracks error rates, and correlates performance data with infrastructure metrics. This helps developers identify bottlenecks, prevent failures, and maintain optimal API functionality across distributed systems. Key API monitoring metrics include:
- Latency: How long it takes for the API to respond.
- Error Rate: The percentage of API calls that fail.
- Throughput: The number of API requests processed in a given time.
- Uptime: The percentage of time the API is available.
API monitoring differs from traditional application monitoring because it focuses specifically on the interactions between services and external applications, ensuring seamless integration and performance across different systems.
Key API Metrics
Monitoring and analyzing the appropriate metrics is critical for ensuring the reliability and performance of APIs. Below are the key metrics that should be tracked by every development team:
Performance Metrics
- Response Time – Average, minimum, and maximum time to complete requests
- Latency – Time between request initiation and first byte received (P50, P95, P99 percentiles)
- Throughput – Number of requests processed per time unit
- Request Rate – Volume of incoming API calls over time
Reliability Metrics
- Error Rate – Percentage of failed requests (4xx and 5xx responses)
- Uptime – Service availability percentage
- Success Rate – Ratio of successful to total requests
- Timeouts – Number of requests exceeding time limits
Resource Utilization
- CPU Usage – Processing power consumed by API servers
- Memory Usage – RAM utilization across API infrastructure
- Bandwidth – Network traffic volume for API requests/responses
- Connection Pool Status – Available and active database connections
Business Impact Metrics
- Error Budget – Acceptable threshold for API failures
- SLA Compliance – Meeting service level agreement targets
- User Impact – Number of affected users during incidents
- Revenue Impact – Financial effects of API performance issues
Key API Monitoring Features
When selecting an API monitoring tool, several key features stand out:
- Real-Time Monitoring: Immediate feedback on API performance and health.
- Distributed Tracing: Track individual API requests as they pass through different services, providing deeper insights.
- Customizable Dashboards: Visualize performance data in an intuitive way.
- Log Management: Collect and analyze logs for troubleshooting.
- Security Monitoring: Detect unauthorized access or excessive API usage.
- Alerting: Real-time notifications about performance degradation or failures.
Both open-source and proprietary tools offer these features, though open-source solutions provide more customization at the cost of simplicity.
API Monitoring Tools Comparison
| Tool | Type | Pricing | OpenTelemetry | Best For |
|---|---|---|---|---|
| Uptrace | Open Source | Free / Commercial | Yes | Distributed tracing + monitoring |
| Datadog | Commercial | $5/10k tests | Partial | Enterprise observability |
| New Relic | Commercial | Usage-based | Yes | Full-stack APM |
| Postman | Commercial | $19-49/user + usage | No | API testing + monitoring |
| Prometheus + Grafana | Open Source | Free | Yes | Kubernetes monitoring |
| RapidAPI | Commercial | Varies | No | macOS API testing |
| Apitools | Commercial | Varies | No | AI-powered testing |
| Runscope | Commercial | Paid only | No | Multi-step API testing |
| Sauce Labs | Commercial | Premium | No | Cross-platform testing |
| Zabbix | Open Source | Free | Partial | Infrastructure monitoring |
Top 10 API Monitoring Tools
Open-Source Solutions
Uptrace
Uptrace is an open-source APM that specializes in distributed tracing and monitoring API performance.
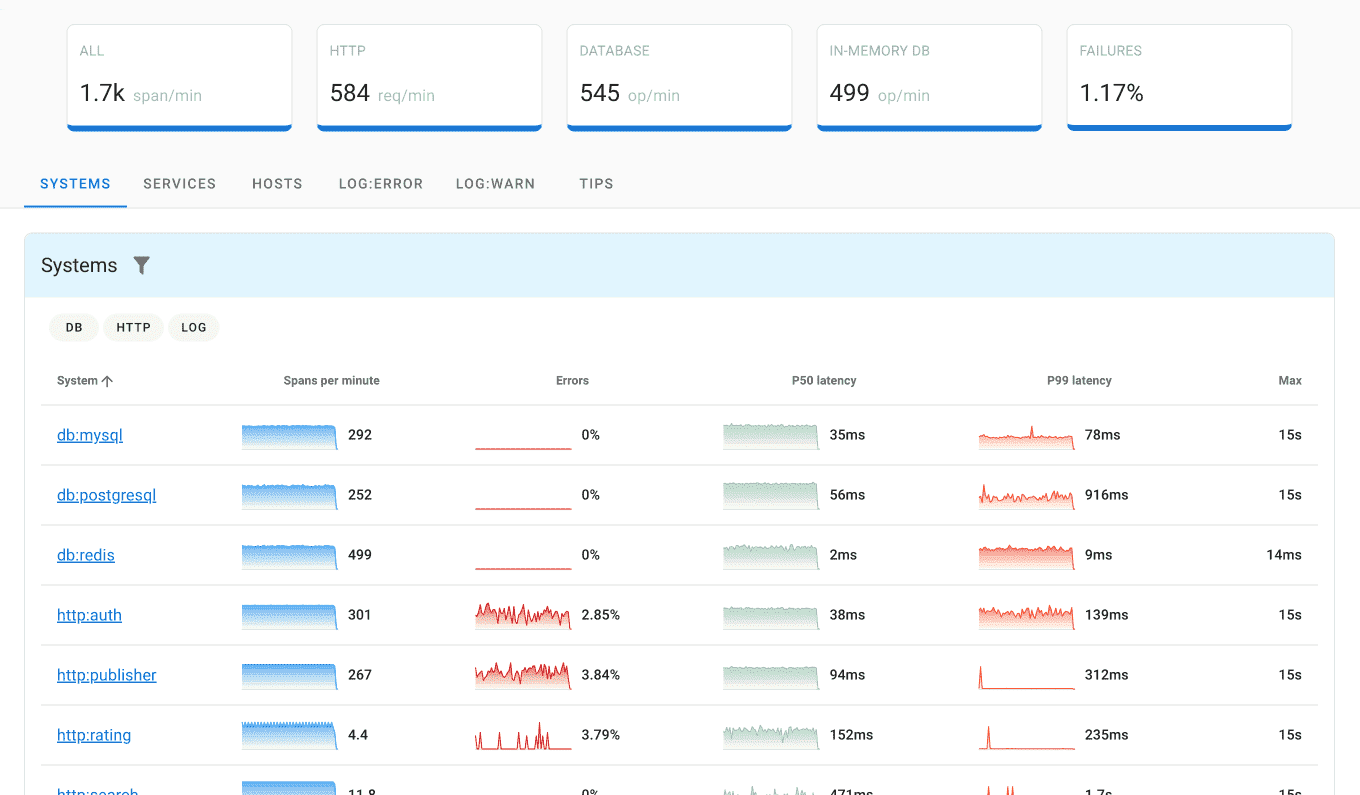
Features:
- Distributed tracing for deep insights into API requests and performance.
- Real-time monitoring of key API metrics such as latency and error rates.
- Seamless integration with Prometheus, OpenTelemetry, and Grafana.
Pros:
- Open-source with strong customization options.
- Excellent for teams looking for distributed tracing and deeper API analysis.
- Affordable solution compared to proprietary tools.
Cons:
- Requires more initial configuration than plug-and-play tools.
- Smaller community compared to Prometheus and Grafana.
Best for:
Teams that need deep tracing capabilities and an open-source solution for API monitoring.
Prometheus + Grafana
Prometheus and Grafana are open-source monitoring and visualization tools widely used for infrastructure and API monitoring.
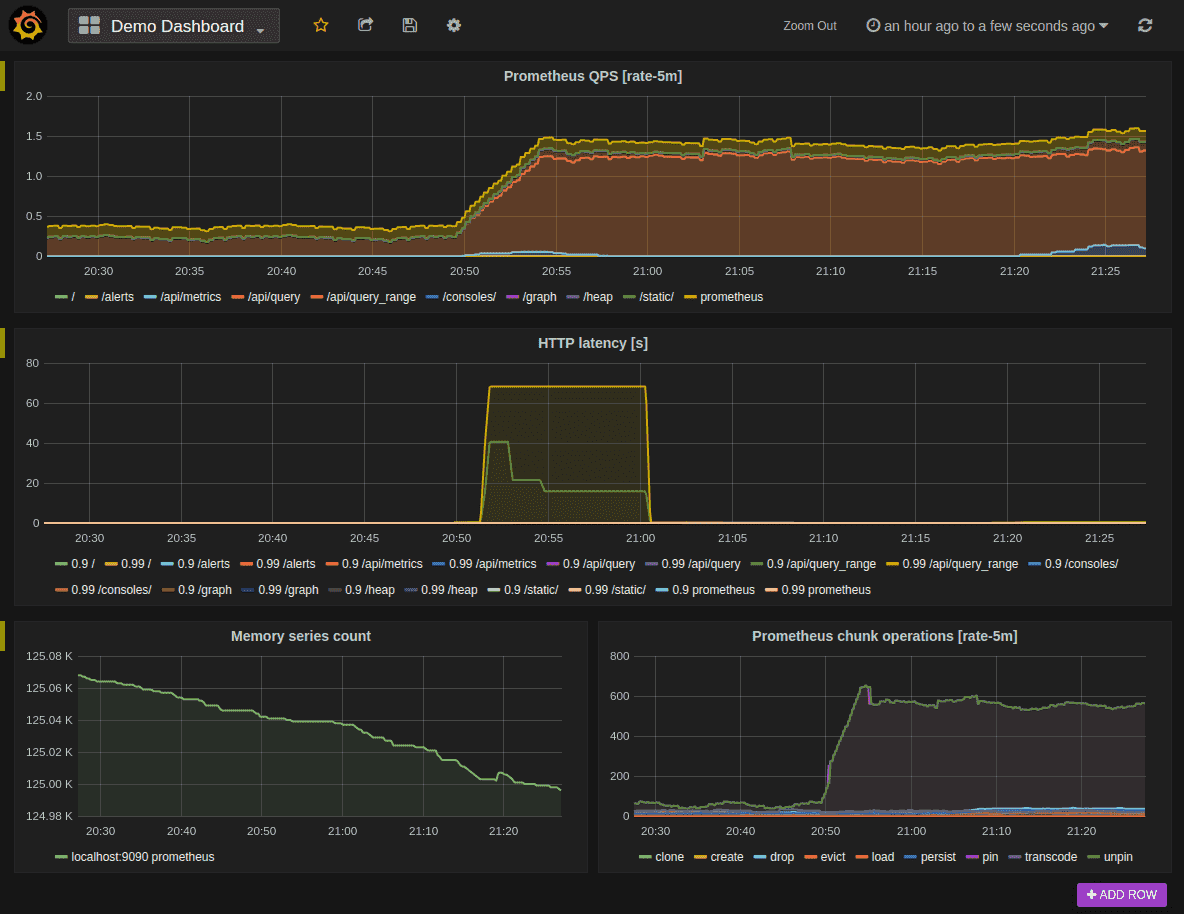
Features:
- Powerful query language (PromQL) for monitoring metrics.
- Grafana's visual dashboards for tracking API performance.
- Suitable for monitoring complex, dynamic environments.
Pros:
- Fully customizable and open-source.
- Large community and extensive documentation.
Cons:
- Requires manual setup and configuration.
- Not as user-friendly out of the box as proprietary tools.
Best for:
Teams needing highly customizable and scalable open-source monitoring.
Zabbix
Zabbix is an open-source monitoring platform with capabilities for API monitoring, infrastructure, and application performance.
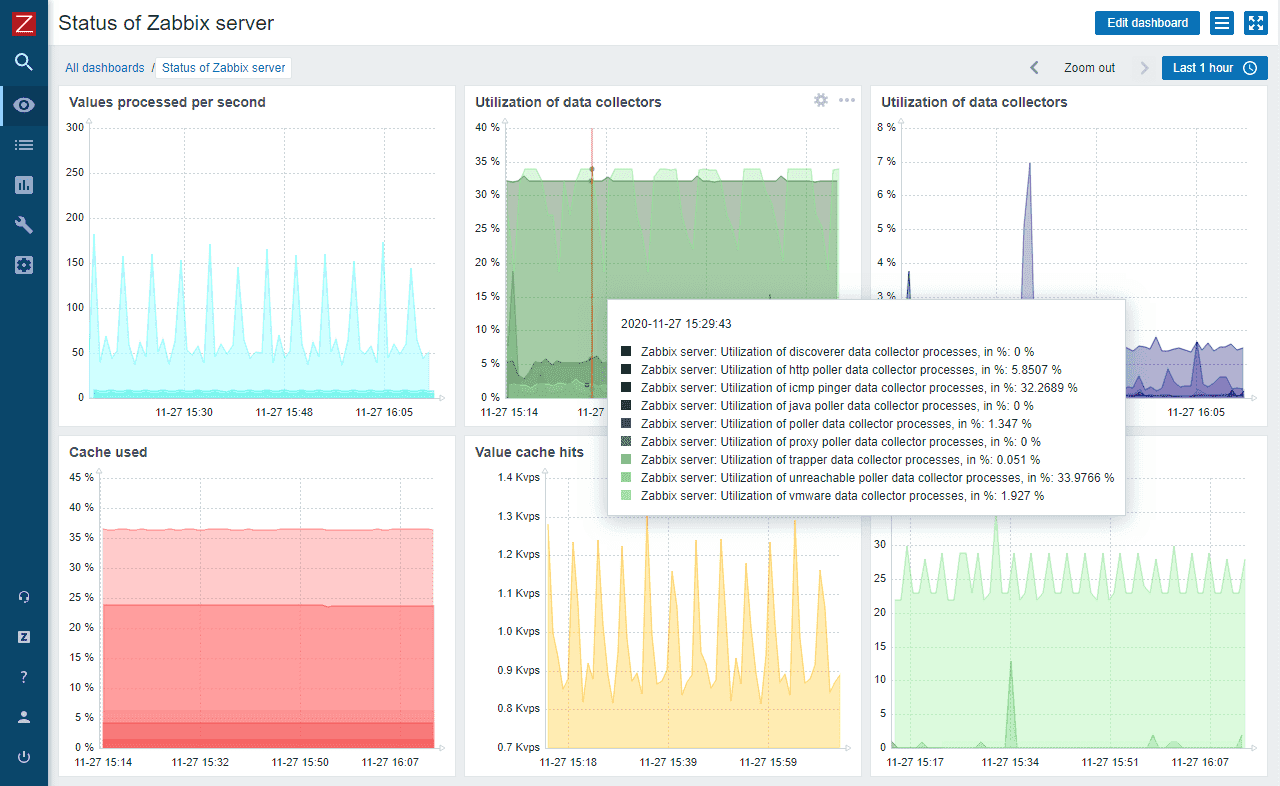
Features:
- Highly customizable for complex, large environments.
- Comprehensive monitoring and alerting system.
Pros:
- Free and open-source with strong community support.
- Scalable for large, distributed systems.
Cons:
- Steeper learning curve and more complex setup.
- Requires manual configuration for API monitoring.
Best for:
IT teams looking for a free, open-source monitoring tool with customizable alerts.
Full-Stack APM Platforms
Datadog
Datadog is a popular cloud-based monitoring and analytics tool designed for modern, distributed systems.
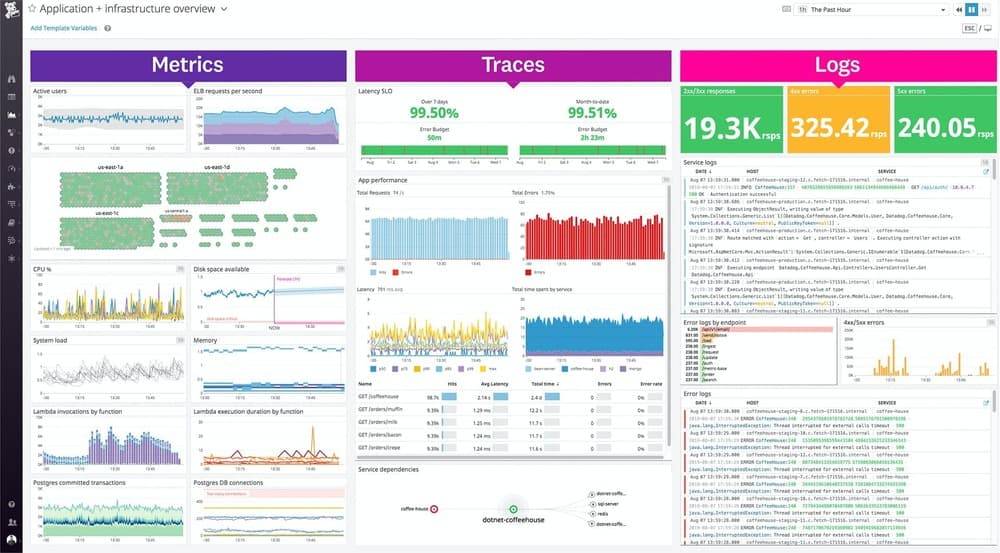
Features:
- Real-time performance monitoring for APIs and applications.
- Distributed tracing and APM (Application Performance Monitoring).
- Comprehensive dashboards and visualizations.
Pros:
- Excellent for large-scale distributed systems.
- Supports over 400 integrations with various platforms.
Cons:
- Pricing can get expensive for growing businesses.
- Steeper learning curve for beginners.
Pricing: API Testing starts at $5 per 10,000 test runs/month; APM from $69/host/month
Best for:
Large enterprises that need end-to-end monitoring across multiple services.
New Relic
New Relic offers a full-stack observability platform that includes APM, API monitoring, and infrastructure monitoring.
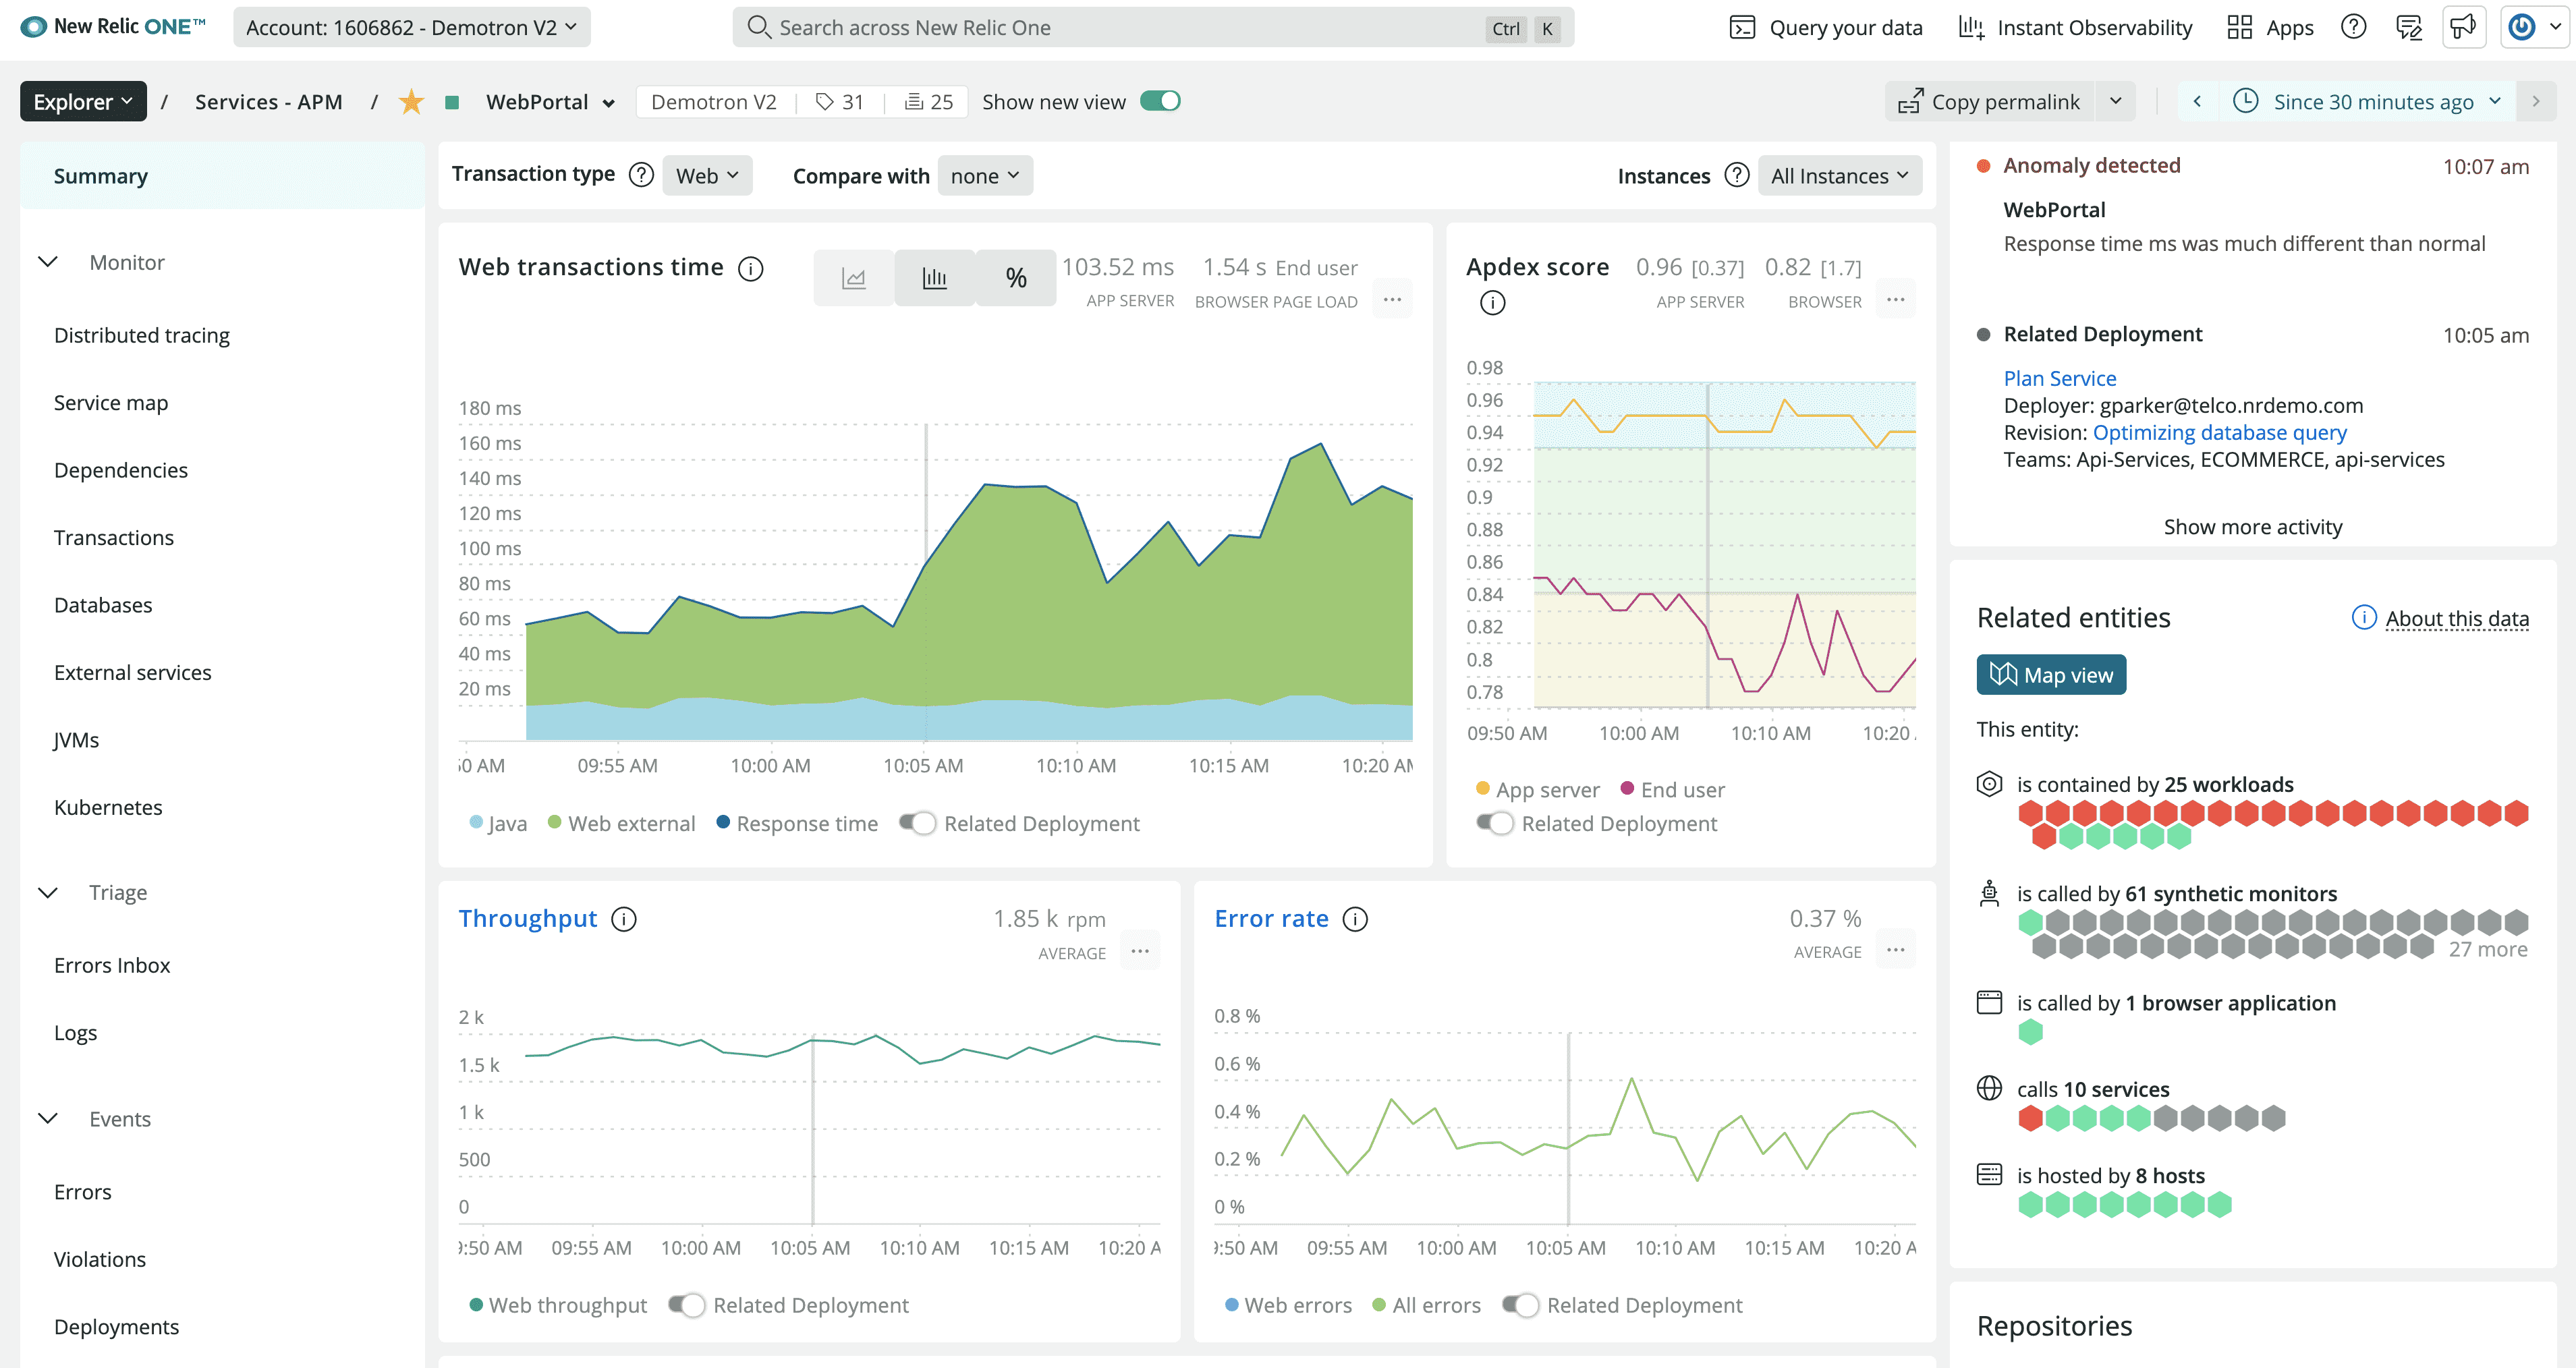
Features:
- Detailed API monitoring with real-time alerts.
- Distributed tracing and performance insights.
- Easy-to-use dashboards with flexible customization.
Pros:
- Strong integration with modern cloud services.
- Highly customizable dashboards.
Cons:
- Can be resource-intensive for smaller teams.
- Pricing can be high for additional features.
Pricing: Usage-based; free tier available with 100GB data/month
Best for:
Developers and enterprises looking for full-stack observability with application performance monitoring and API monitoring.
API-Focused Testing Tools
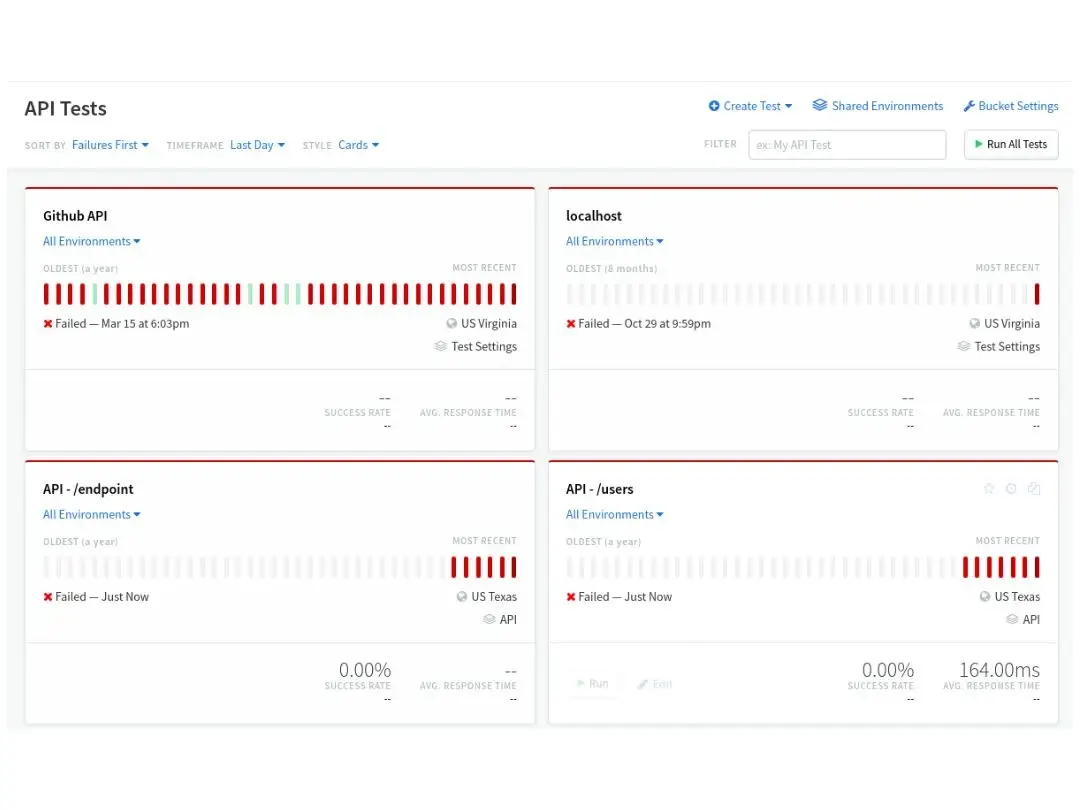
Postman API Monitoring
Postman is widely known for API testing, but it also offers robust API monitoring.
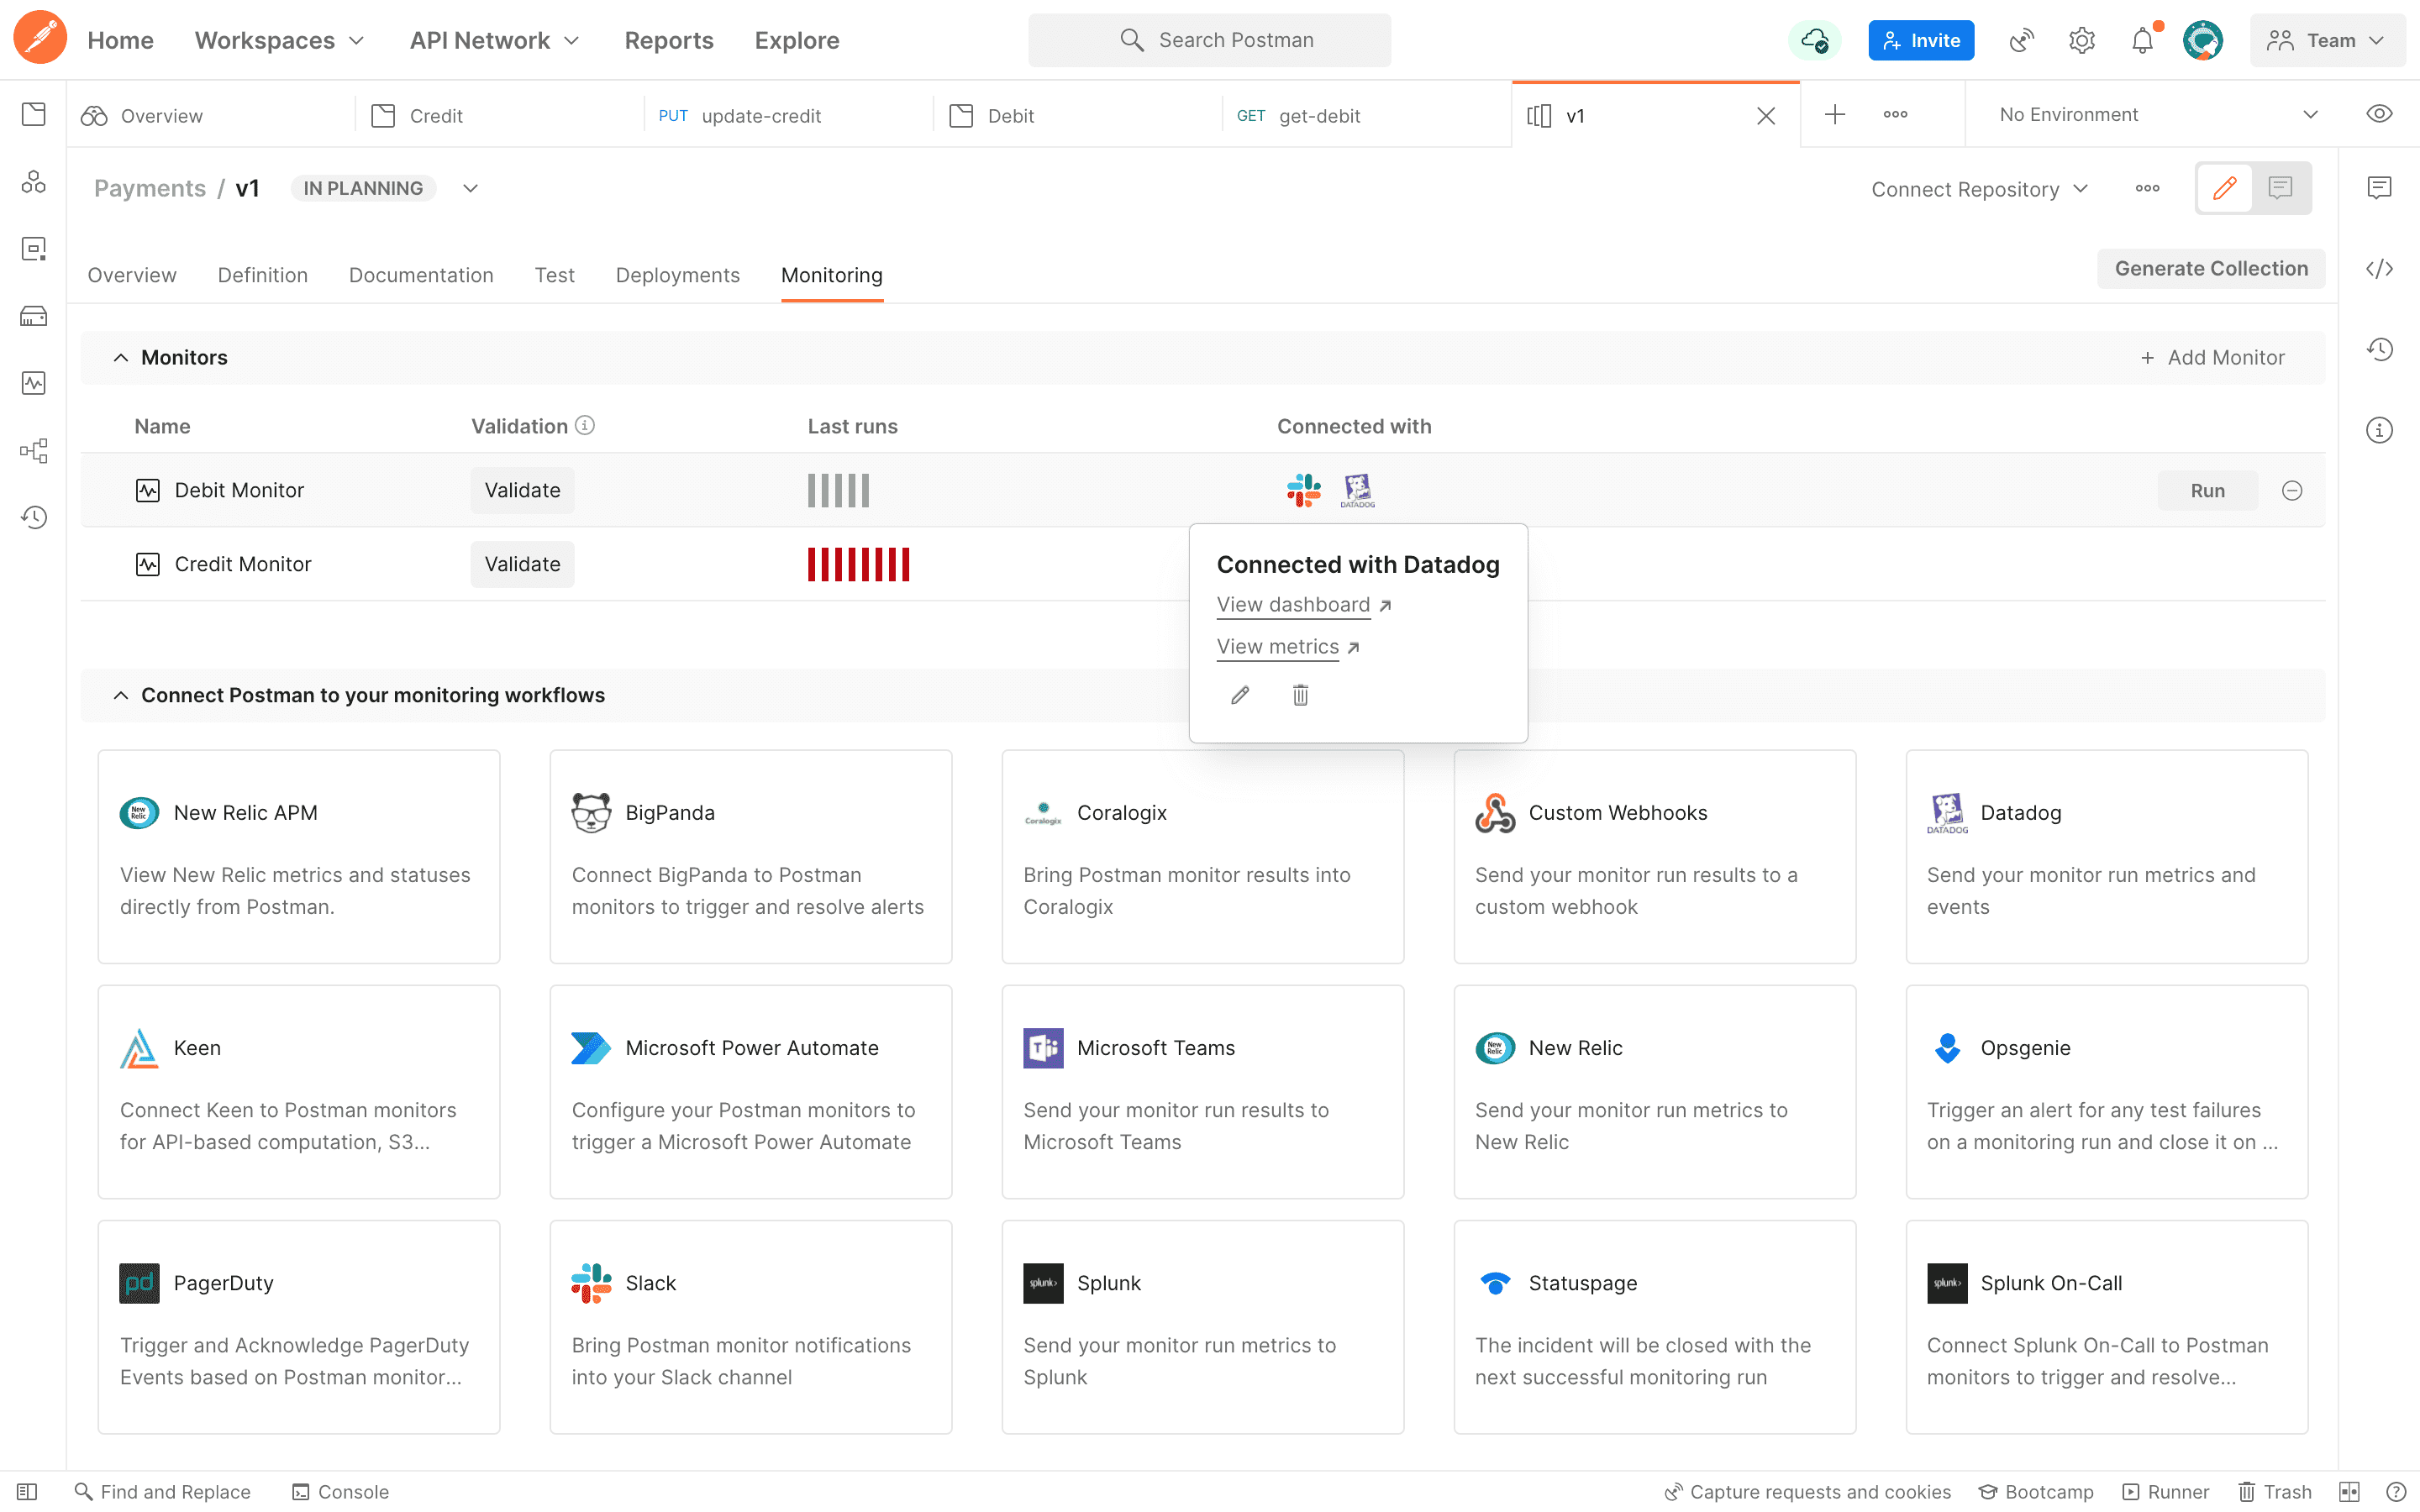
Features:
- Allows monitoring of API endpoints and performance over time.
- Integrates seamlessly with API testing workflows.
- Ideal for dev teams focused on API development.
Pros:
- Easy integration with existing API testing suites.
- Simple and intuitive interface.
Cons:
- Limited scalability for large environments.
- Lacks the depth of monitoring provided by other tools.
Pricing: Free plan available; $19-49/user/month + $20 per 50,000 monitor calls
Best for:
Development teams looking for a simple, easy-to-use monitoring solution that integrates well with existing API testing workflows and is ideal for smaller-scale environments.
RapidAPI
RapidAPI for Mac is a comprehensive HTTP client designed for testing and documenting the APIs you develop or use.
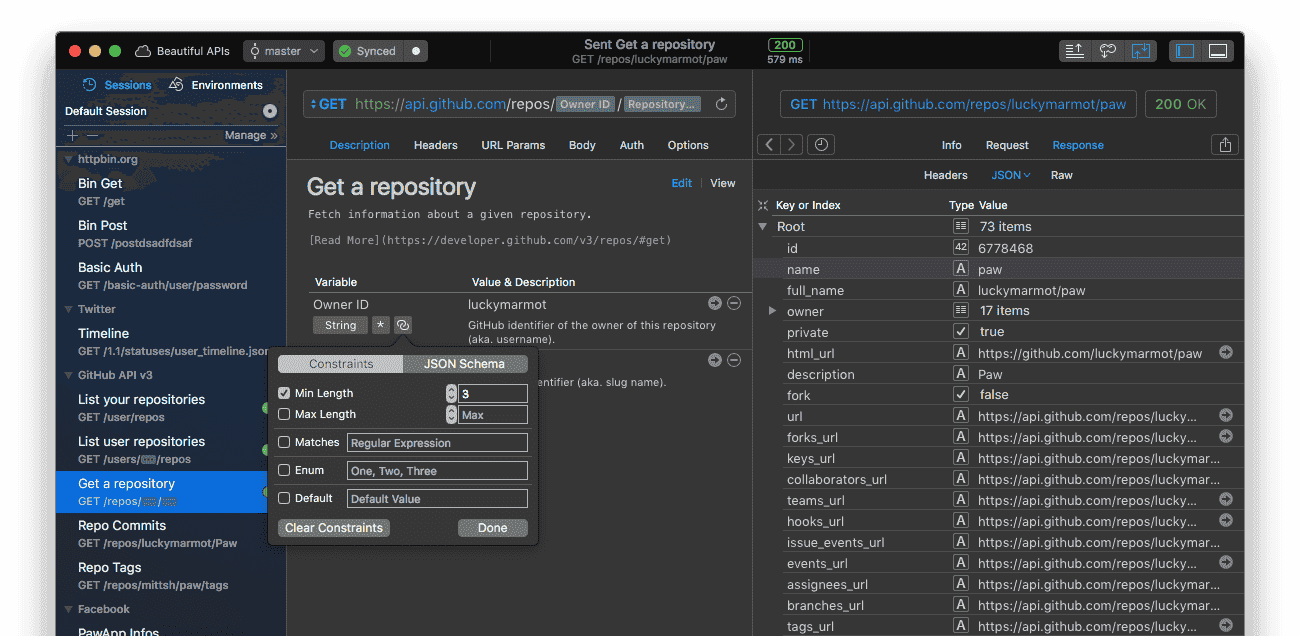
Features:
- Interactive API testing with automatic request generation.
- Built-in support for WebSocket and GraphQL.
- CI/CD integration for automated API testing.
Pros:
- User-friendly interface with scripting capabilities.
- Supports various authentication methods.
- Great for debugging and collaboration.
Cons:
- macOS-only application.
- No built-in alerting system.
Best for:
macOS users looking for an intuitive API testing and monitoring tool.
Apitools
Apitools is a powerful API testing and monitoring solution designed for developers and enterprises.
Features:
- Automated API testing with AI-driven tools.
- Real-time performance monitoring and alerting.
- Easy-to-use interface with integration into CI/CD pipelines.
Pros:
- AI-powered test optimization for faster results.
- Scalable for both small teams and large enterprises.
- Comprehensive reporting with visualizations for easy troubleshooting.
Cons:
- Requires some learning curve for advanced features.
- Can be resource-intensive for smaller teams.
Best for:
Teams looking for AI-powered API testing and scalable monitoring solutions. Ideal for those integrating into CI/CD workflows.
Runscope
Runscope provides deep API monitoring and testing with automated workflows.
Features:
- Real-time API performance monitoring.
- Multi-step API testing and validation.
- Webhook and CI/CD integration.
Pros:
- Supports multi-region API checks.
- Custom assertions for API responses.
- Comprehensive logging and debugging.
Cons:
- No free plan available.
- Can be overkill for simple uptime monitoring.
Best for:
Developers and QA teams that need multi-step API testing with monitoring capabilities.
Cross-Platform Testing
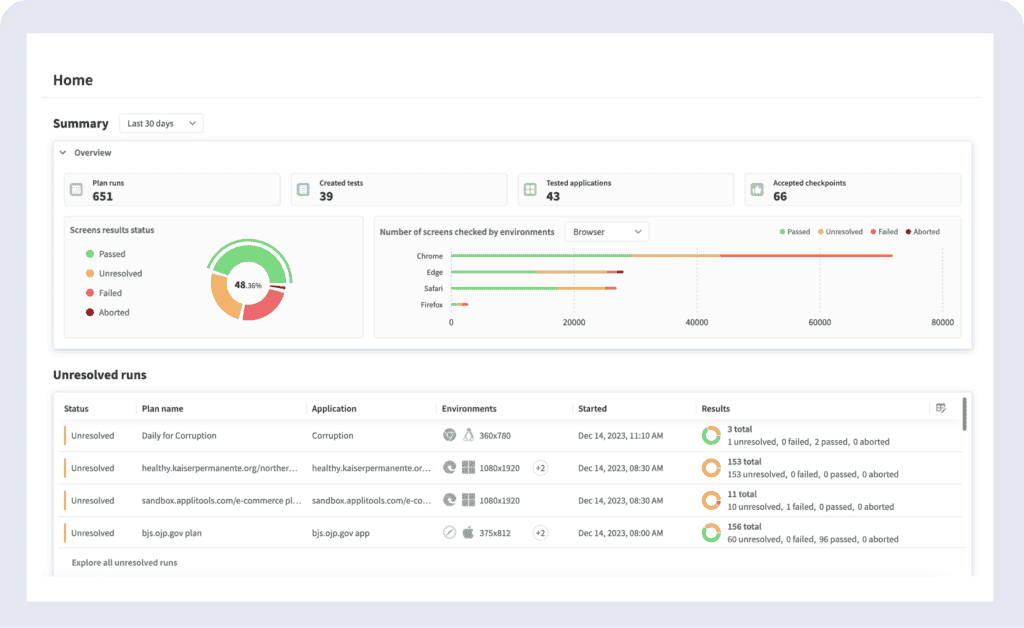
Sauce Labs
Sauce Labs is a comprehensive cloud-based testing platform that provides automated testing for web and mobile applications, including API testing.
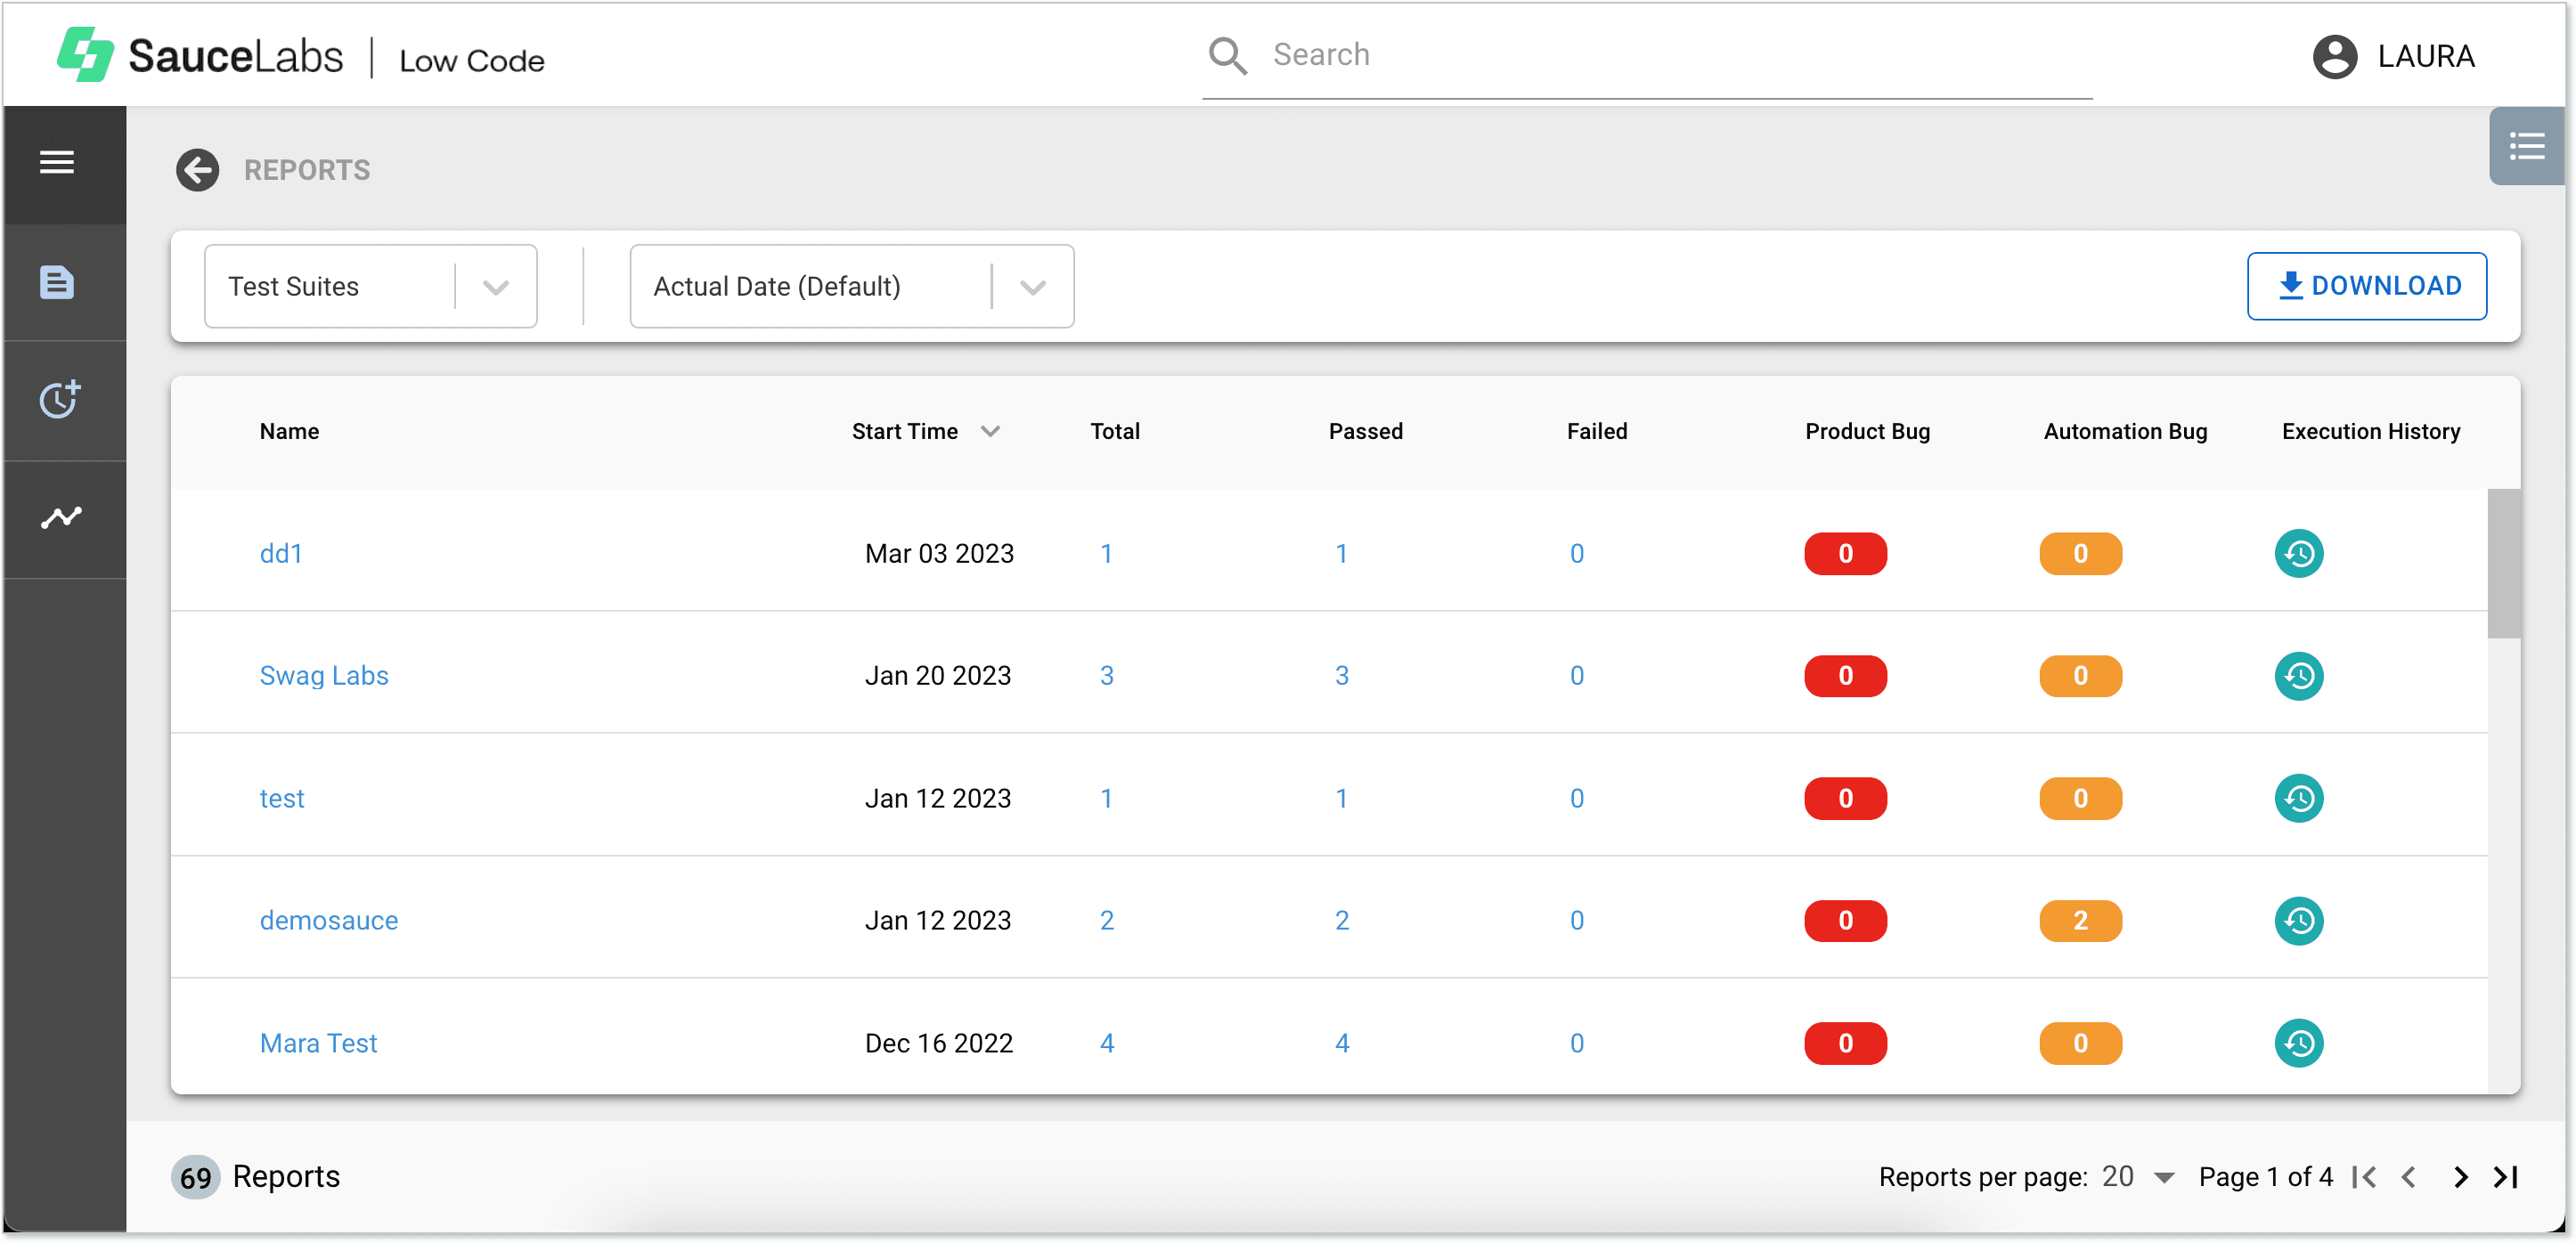
Features:
- Cross-browser and cross-device automated testing.
- Real-time and parallel testing for faster feedback.
- Integration with CI/CD tools and popular test frameworks.
Pros:
- Supports testing across a wide range of browsers and devices.
- Great for continuous testing with quick feedback loops.
- Easy integration with CI/CD pipelines and DevOps workflows.
Cons:
- Higher cost compared to some basic testing tools.
- Can be overkill for small projects or simple testing needs.
Best for:
Teams looking for a cloud-based solution for automated testing across multiple platforms and devices, with strong CI/CD integration.
Key Factors
When evaluating an API monitoring tool, consider the following factors:
- Scalability: Will the tool grow with your business?
- Ease of Use: How simple is the setup and ongoing maintenance?
- Integrations: Does it integrate with your existing tools and platforms?
- Cost: Consider both upfront costs and long-term scalability.
- Custom Alerts and Dashboards: Does it offer flexible customization to fit your specific monitoring needs?
Why Uptrace?
When it comes to API monitoring, Uptrace offers a unique advantage with its open-source approach to observability. For teams looking for advanced distributed tracing and comprehensive insights into API performance, Uptrace is an excellent choice. It provides real-time monitoring and deep visibility into the performance of your APIs, helping to track issues and optimize the user experience.
Key Features:
- Distributed Tracing: Track the journey of API calls across multiple microservices to identify performance bottlenecks.
- Real-Time Monitoring: Keep an eye on crucial API metrics like latency, error rates, and throughput in real-time.
- Seamless Integrations: Easily integrates with tools like Prometheus, Grafana, and OpenTelemetry for a comprehensive observability setup.
Pros:
- Open-source and highly customizable, offering a cost-effective solution compared to proprietary tools.
- Advanced distributed tracing provides deep insights into API performance across systems.
- More affordable and flexible than most commercial API monitoring solutions.
Cons:
- Requires more setup and configuration compared to out-of-the-box tools, which might be challenging for those without dedicated DevOps teams.
- Smaller community compared to other well-known tools like Prometheus, but growing steadily.
Best for:
Teams seeking a cost-effective, open-source solution with powerful distributed tracing capabilities and the flexibility to customize their API monitoring setup.
Open Source vs Proprietary Tools
| Aspect | Open Source Tools | Proprietary Tools |
|---|---|---|
| Cost | Free to use, potential hosting costs | Subscription or licensing fees |
| Customization | Highly customizable | Limited to vendor-provided options |
| Support | Community-driven | Dedicated professional support |
| Learning Curve | Steeper, requires technical expertise | Generally easier to set up and use |
| Integration | Flexible, but may require development | Pre-built integrations with common tools |
| Updates & Maintenance | Community-dependent, self-managed | Regular updates managed by vendor |
| Scalability | Scalable, but may require expertise | Often built-in scalability features |
| Security | Transparent, community-vetted | Vendor-managed, potentially more robust |
| Feature Development | Community-driven, can be slower | Roadmap determined by vendor |
| Data Privacy | Full control over data | May involve sharing data with vendor |
- Open-source tools (e.g., Uptrace, Prometheus) offer flexibility and customization but may require more technical knowledge for setup.
- Proprietary tools (e.g., Datadog, New Relic) offer out-of-the-box ease of use with support, but at a higher cost.
- Choose based on your team's technical expertise, budget, and long-term scalability needs.
Conclusion
API monitoring is essential for maintaining the reliability and performance of modern applications. The tools listed here are among the best in 2025, offering a variety of features suited for different business needs, from open-source platforms like Uptrace and Prometheus to enterprise solutions like Datadog and New Relic. Whether you're looking for a highly customizable, cost-effective solution or an all-in-one platform that's easy to implement, there's an API monitoring tool for you.
In making your decision, it's essential to balance ease of use, scalability, and cost. Tools like Uptrace offer flexibility and deep insights into distributed systems, making them ideal for teams that need more control over their monitoring setup. Meanwhile, proprietary solutions might be a better fit for teams that prioritize simplicity and comprehensive support.
By selecting the right API monitoring tool, you'll be able to ensure optimal API performance, reduce downtime, and provide a seamless experience for your end-users. In 2025, having a robust API monitoring solution in place isn't just an option—it's a necessity.
FAQ
What is API monitoring? API monitoring tracks the health, performance, and availability of API endpoints through continuous testing. It measures uptime, latency, error rates, and throughput to identify issues before they impact users. Unlike basic uptime checks, API monitoring analyzes request-response cycles and correlates performance with infrastructure metrics.
What is the best API monitoring tool? The best API monitoring tool depends on your needs. Uptrace and Prometheus + Grafana offer powerful open-source solutions. Datadog and New Relic provide comprehensive commercial platforms with $5-69/month pricing. Postman works well for teams focused on API testing workflows at $19-49/user/month.
What are the key metrics for API monitoring? Key API monitoring metrics include response time (P50, P95, P99 latencies), error rate (4xx/5xx responses), throughput (requests per second), uptime percentage, and resource utilization (CPU, memory, bandwidth). Track these metrics to maintain API reliability and performance.
Can open-source tools handle large-scale API monitoring? Yes, open-source tools like Prometheus, Grafana, and Uptrace can handle large-scale API monitoring when properly configured. Many large organizations use these tools for monitoring millions of requests. They require technical expertise but offer full customization without licensing costs.
How often should I monitor my APIs? Monitor critical production APIs in real-time or with 1-minute intervals. Less critical APIs can be monitored every 5-15 minutes. The monitoring frequency depends on your SLA requirements, user traffic patterns, and tolerance for downtime. 83% of internet traffic now flows through APIs, making frequent monitoring essential. For comprehensive analysis, combine API monitoring with log analysis tools and consider Datadog alternatives for cost optimization.