OpenTelemetry PostgreSQL Monitoring
Monitoring PostgreSQL is essential to ensure the optimal performance, availability, and reliability of your database. Catching issues like connection exhaustion, long-running queries, or replication lag early prevents cascading failures in your application.
This tutorial explains how to use OpenTelemetry Collector's PostgreSQL receiver to collect database metrics and export them to Uptrace for visualization and alerting.
Prerequisites
Before you begin, make sure you have:
- A running PostgreSQL 9.6+ instance
- OpenTelemetry Collector Contrib installed on a host that can reach your PostgreSQL server
- An Uptrace DSN (cloud or self-hosted)
Create a dedicated PostgreSQL user for monitoring:
CREATE USER otel WITH PASSWORD 'your_secure_password';
GRANT pg_monitor TO otel;
The pg_monitor role (available in PostgreSQL 10+) provides read access to server statistics and monitoring views. For PostgreSQL 9.6, grant individual permissions instead:
GRANT SELECT ON pg_stat_database, pg_stat_bgwriter, pg_stat_activity TO otel;
What is OpenTelemetry Collector?
OpenTelemetry Collector is a vendor-agnostic agent that pulls telemetry data from systems you want to monitor and exports the collected data to an OpenTelemetry backend.
The Collector supports a pipeline architecture with receivers (data sources), processors (data transformation), and exporters (destinations). This lets you collect PostgreSQL metrics alongside application traces and logs in a single agent.
OpenTelemetry PostgreSQL receiver
The PostgreSQL receiver connects to your PostgreSQL instance and periodically queries system statistics views like pg_stat_database, pg_stat_bgwriter, and pg_stat_user_tables.
To start monitoring PostgreSQL, configure the receiver in /etc/otel-contrib-collector/config.yaml using your Uptrace DSN:
receivers:
  otlp:
    protocols:
      grpc:
      http:
  postgresql:
    endpoint: localhost:5432
    transport: tcp
    username: otel
    password: ${env:POSTGRESQL_PASSWORD}
    databases:
      - otel
    collection_interval: 10s
    tls:
      insecure: true

exporters:
  otlp/uptrace:
    endpoint: api.uptrace.dev:4317
    headers: { 'uptrace-dsn': '<FIXME>' }

processors:
  resourcedetection:
    detectors: [env, system]
  cumulativetodelta:
  batch:
    timeout: 10s

service:
  pipelines:
    traces:
      receivers: [otlp]
      processors: [batch]
      exporters: [otlp/uptrace]
    metrics:
      receivers: [otlp, postgresql]
      processors: [cumulativetodelta, batch, resourcedetection]
      exporters: [otlp/uptrace]
Key configuration options:
| Option | Description |
|---|---|
databases | List of databases to monitor (omit to monitor all) |
collection_interval | How often to collect metrics (default: 10s) |
transport | Connection protocol: tcp or unix |
tls.insecure | Set to false and configure certificates for SSL connections |
Restart OpenTelemetry Collector to apply the configuration:
sudo systemctl restart otelcol-contrib
Check the logs to verify the receiver started successfully:
sudo journalctl -u otelcol-contrib -f
You should see a line like Receiver started with name=postgresql in the output.
Key PostgreSQL metrics
The PostgreSQL receiver collects metrics that fall into several categories:
Connection metrics track how many clients are connected and whether you're approaching the max_connections limit:
postgresql.backends— number of active backends (connections) per databasepostgresql.connection.max— configured maximum connections
Transaction and query metrics reveal database throughput and workload patterns:
postgresql.commits— number of committed transactionspostgresql.rollbacks— number of rolled-back transactionspostgresql.rows— rows affected by operations (inserted, updated, deleted, fetched)
Cache performance metrics show how effectively PostgreSQL uses shared buffers:
postgresql.blks_hit— blocks found in shared buffer cachepostgresql.blks_read— blocks read from disk- Cache hit ratio =
blks_hit / (blks_hit + blks_read)— aim for 99%+
Table maintenance metrics help track vacuum and analyze operations:
postgresql.rows(withstate=dead) — dead tuples per table (indicates bloat)postgresql.rows(withstate=live) — live tuples per tablepostgresql.table.size— disk space used by each table
Replication metrics (when applicable) monitor standby lag:
postgresql.replication.data_delay— replication lag in bytespostgresql.wal.lag— WAL lag between primary and replica
Troubleshooting
"password authentication failed": Verify the monitoring user exists and can connect. Test with psql -h localhost -U otel -d otel.
No metrics collected: Check that pg_stat_statements extension is loaded if you expect query-level metrics. Add shared_preload_libraries = 'pg_stat_statements' to postgresql.conf and restart PostgreSQL.
Missing table-level metrics: The receiver only collects table metrics for the databases listed in the databases configuration. Add all databases you want to monitor.
TLS connection errors: If PostgreSQL requires SSL, set tls.insecure: false and provide certificate paths:
postgresql:
  endpoint: localhost:5432
  tls:
    insecure: false
    ca_file: /etc/ssl/certs/ca.pem
    cert_file: /etc/ssl/certs/client.pem
    key_file: /etc/ssl/private/client-key.pem
High collection overhead on large databases: If you have hundreds of tables, increase collection_interval to 30s or 60s to reduce the query load on pg_stat_user_tables.
OpenTelemetry Backend
Once the metrics are collected and exported, you can visualize them using a compatible backend system. For example, you can use Uptrace to create dashboards that display metrics from the OpenTelemetry Collector.
Uptrace is an OpenTelemetry APM that supports distributed tracing, metrics, and logs. You can use it to monitor applications and troubleshoot issues.

Uptrace comes with an intuitive query builder, rich dashboards, alerting rules with notifications, and integrations for most languages and frameworks.
Uptrace can process billions of spans and metrics on a single server and allows you to monitor your applications at 10x lower cost.
In just a few minutes, you can try Uptrace by visiting the cloud demo (no login required) or running it locally with Docker. The source code is available on GitHub.
Available metrics
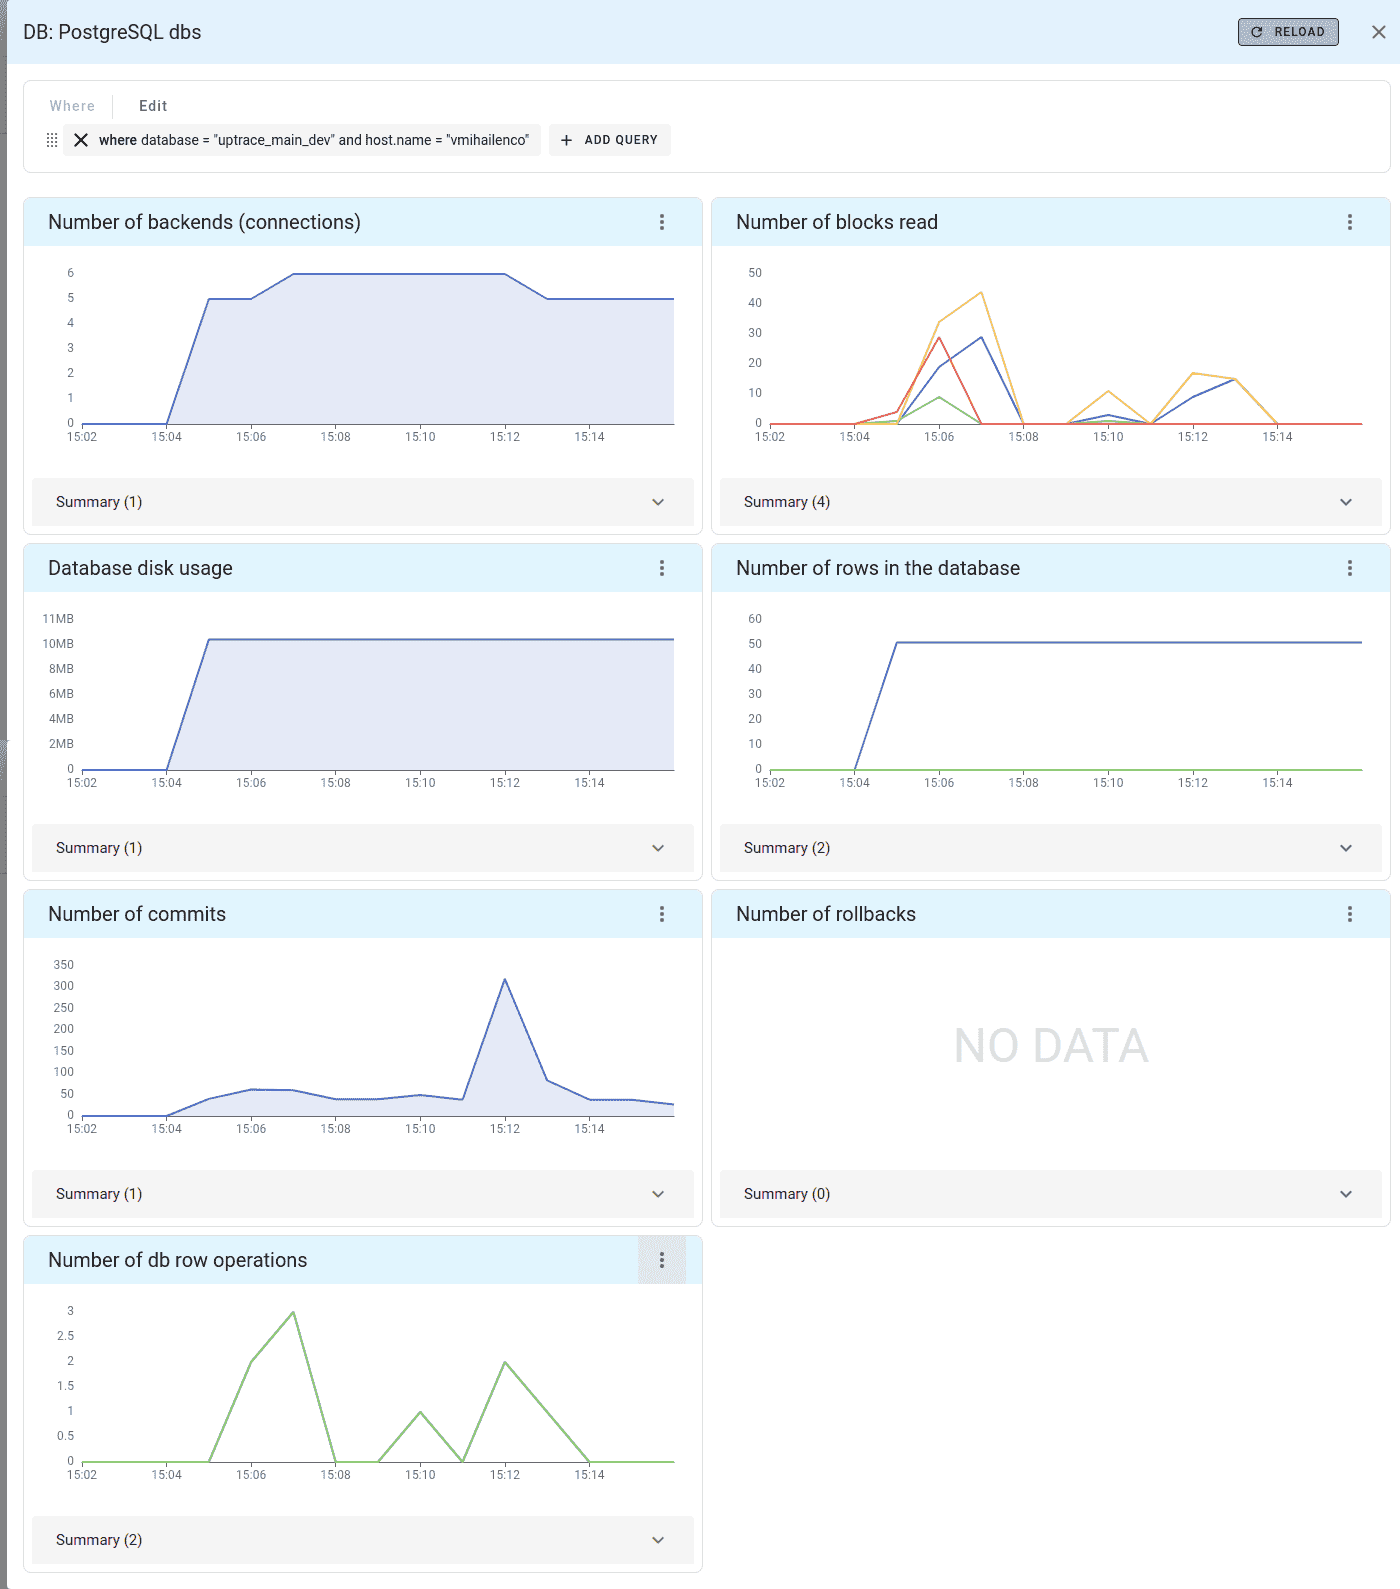
Uptrace automatically creates the following dashboard when PostgreSQL metrics are available:
What's next?
PostgreSQL metrics are now flowing into your observability platform, providing database performance insights and query analysis. Compare with MySQL monitoring for different database engines, or explore Redis monitoring for caching layer observability.