What is Distributed Tracing? How It Works with OpenTelemetry
Quick Answer: Distributed tracing is an observability technique that tracks a request's complete journey across microservices, databases, and external services. It creates a trace — a tree of spans — where each span records one operation (duration, status, attributes). A shared trace ID links all spans together across service boundaries. OpenTelemetry provides vendor-neutral APIs for implementing tracing in any language.
Key concepts in 30 seconds:
| Term | Definition | Example |
|---|---|---|
| Trace | Complete request path through your system | "User checkout: 500ms across 4 services" |
| Span | Single operation within a trace | "Query database: 50ms in payment service" |
| Trace ID | 128-bit identifier shared by all spans in a trace | 5b8efff798038103d269b633813fc60c |
| Span ID | 64-bit identifier unique to one span | eee19b7ec3c1b174 |
| Context Propagation | How trace IDs pass between services | traceparent HTTP header |
Distributed tracing creates a complete view of request flow through distributed systems, recording timing, dependencies, and failures across microservices, APIs, and databases. This visibility is essential for identifying performance bottlenecks, diagnosing issues, and understanding system behavior in microservices architectures.
How Distributed Tracing Works
Modern applications built on microservices or serverless architectures rely on multiple services interacting to fulfill a single user request. This complexity makes it challenging to identify performance bottlenecks, diagnose issues, and analyze overall system behavior.
Distributed tracing addresses these challenges by creating a trace—a representation of a single request's journey through various services and components. Each trace consists of interconnected spans, where each span represents an individual operation within a specific service or component.
When a request enters a service, the trace context propagates with the request through trace headers, allowing downstream services to participate in the same trace. As the request flows through the system, each service generates its own span and updates the trace context with information about the operation's duration, metadata, and relevant context.
Distributed tracing tools use the generated trace data to provide visibility into system behavior, identify performance issues, assist with debugging, and help ensure the reliability and scalability of distributed applications.
Distributed Tracing vs Logging vs Metrics vs Profiling
The four pillars of observability each serve a distinct purpose. Understanding when to use each — and how they complement each other — is essential for effective monitoring.
| Aspect | Distributed Tracing | Logging | Metrics | Profiling |
|---|---|---|---|---|
| Scope | Cross-service request journey | Events within one service | Aggregate system measurements | Code execution paths |
| Structure | Hierarchical span tree | Timestamped event records | Time-series numbers | Call-stack samples |
| Context | Trace ID propagated across services | Local to service | Aggregated, no request context | No request context |
| Primary Use Case | Latency breakdown, request flow, service dependencies | Error debugging, audit trails, application state | Dashboards, SLOs, capacity planning | CPU and memory bottlenecks |
| Data Volume | Low (sampled) | High | Low | High |
| Query Pattern | "Why was request X slow across services?" | "Show all errors with message Y" | "Is p99 latency above 500ms?" | "Which function consumes the most CPU?" |
When to use tracing: Analyzing cross-service latency, understanding request dependencies, measuring end-to-end duration, identifying which service causes cascading failures.
When to use logging: Debugging specific errors with detailed context, auditing user actions, capturing application state changes, troubleshooting within a single service.
When to use metrics: Monitoring system health at scale, setting SLO alerts, tracking throughput and error rates, capacity planning.
When to use profiling: Identifying hot code paths, diagnosing memory leaks, optimizing CPU-intensive functions.
Best practice: Use all four together. OpenTelemetry logs can include trace IDs and span IDs, allowing you to jump from a trace span directly to related log entries. Traces tell you where a bottleneck is; profiling tells you why.
Distributed Tracing in Microservices
Microservices architectures present unique observability challenges that make distributed tracing essential rather than optional. When a monolithic application becomes dozens of independent services, understanding system behavior requires tracking requests across service boundaries.
Why microservices need distributed tracing:
- Request path complexity: A single user action may trigger calls to 5-15 different services. Without tracing, identifying which service caused a 500ms delay becomes guesswork.
- Distributed failures: When Service A fails, the root cause might be in Service C three hops away. Traces show the complete failure chain.
- Cross-team ownership: Different teams own different services. Shared trace IDs allow teams to collaborate on performance issues without accessing each other's logs.
- Dynamic service mesh: Services scale independently, run in containers, and change IP addresses. Traditional logging with static hostnames breaks; trace IDs remain consistent.
Common microservices tracing patterns:
- API Gateway as root span: Gateway creates the initial trace ID and propagates it to all downstream services
- Service-to-service spans: Each internal API call creates a CLIENT span in the caller and SERVER span in the callee
- Async operations: Producer/Consumer spans for message queues ensure background jobs appear in the same trace
- Database instrumentation: Client spans for SQL queries show which service caused expensive database operations
Key benefits for microservices:
- Latency attribution: Trace waterfalls show exactly which service contributed how much latency to the total request time
- Dependency mapping: Automatic service topology graphs based on observed span relationships
- Cascading failure analysis: Identify which upstream service failure caused downstream 503 errors
- Cross-service debugging: Navigate from a slow endpoint to the specific database query in a different service
For microservices running on Kubernetes, OpenTelemetry Kubernetes Operator can automatically inject trace context propagation into all services without code changes.
Span Kinds
OpenTelemetry defines five span kinds that describe how services interact within a trace:
| Span Kind | Type | When to Use | Common Examples |
|---|---|---|---|
| Server | Synchronous | Handling incoming requests | HTTP server, gRPC server, GraphQL resolvers |
| Client | Synchronous | Making outbound requests | HTTP client, database queries, Redis calls |
| Producer | Asynchronous | Publishing messages (ends when message accepted) | Kafka publish, RabbitMQ send, SQS enqueue |
| Consumer | Asynchronous | Processing messages (from receive to completion) | Kafka consume, background job processing |
| Internal | In-process | Operations within a service (no network calls) | Business logic, calculations, data transform |
Choosing the correct span kind ensures accurate visualization in trace waterfalls and helps backends understand service dependencies.
Core Concepts
Spans
A span represents a unit of work in a trace, such as a remote procedure call (RPC), database query, or in-process function call. Each span contains:
- A span name (operation name)
- A parent span ID (except for root spans)
- A span kind
- Start and end timestamps
- A status indicating success or failure
- Key-value attributes describing the operation
- A timeline of events
- Links to other spans
- A span context that propagates trace ID and other data between services
A trace is a tree of spans showing the path of a request through an application. The root span is the first span in a trace.
Span Names
OpenTelemetry backends use span names and attributes to group similar spans together. To ensure proper grouping, use short, concise names. Keep the total number of unique span names below 1,000 to avoid creating excessive span groups that can degrade performance.
Good span names (short, distinctive, and groupable):
| Span name | Comment |
|---|---|
GET /projects/:id | Route name with parameter placeholders |
select_project | Function name without arguments |
SELECT * FROM projects WHERE id = ? | Database query with placeholders |
Poor span names (contain variable parameters):
| Span name | Comment |
|---|---|
GET /projects/42 | Contains variable parameter 42 |
select_project(42) | Contains variable argument 42 |
SELECT * FROM projects WHERE id = 42 | Contains variable value 42 |
Span Kind
Span kind describes the relationship between the span and its callers or callees.
Server
Covers the time from receiving an incoming request to sending the response — used for HTTP servers, gRPC handlers, and GraphQL resolvers.
ctx, span := tracer.Start(ctx, "handle_request",
    trace.WithSpanKind(trace.SpanKindServer),
    trace.WithAttributes(
        semconv.HTTPMethod("GET"),
        semconv.HTTPRoute("/api/users/:id"),
    ))
defer span.End()
Client
Covers the time from sending an outbound request to receiving the response — used for HTTP calls, database queries, and cache operations.
ctx, span := tracer.Start(ctx, "database_query",
    trace.WithSpanKind(trace.SpanKindClient),
    trace.WithAttributes(
        semconv.DBSystemPostgreSQL,
        semconv.DBQueryText("SELECT * FROM users WHERE id = ?"),
    ))
defer span.End()
Producer
Ends when the message is accepted by the broker (not when consumed) — used for Kafka publish, RabbitMQ send, SQS enqueue.
ctx, span := tracer.Start(ctx, "publish_event",
    trace.WithSpanKind(trace.SpanKindProducer),
    trace.WithAttributes(
        semconv.MessagingSystemKafka,
        semconv.MessagingDestinationName("user.events"),
    ))
defer span.End()
Consumer
Covers the full processing time from receiving a message to completing its handling — used for Kafka consumers, queue workers, and background jobs.
ctx, span := tracer.Start(ctx, "process_message",
    trace.WithSpanKind(trace.SpanKindConsumer),
    trace.WithAttributes(
        semconv.MessagingSystemKafka,
        semconv.MessagingOperationProcess,
    ))
defer span.End()
Internal
In-process operations with no network calls — used for business logic, data transformations, and calculations.
ctx, span := tracer.Start(ctx, "calculate_total",
    trace.WithSpanKind(trace.SpanKindInternal),
    trace.WithAttributes(
        attribute.Int("item_count", len(items)),
    ))
defer span.End()
Status Code
Status code indicates whether an operation succeeded or failed:
ok– Successerror– Failureunset– Default value, allowing backends to assign status
Attributes
Attributes provide contextual information about spans. For example, an HTTP endpoint might have attributes like http.method = GET and http.route = /projects/:id.
While you can name attributes freely, use semantic attribute conventions for common operations to ensure consistency across systems.
Events
Events are timestamped annotations with attributes that lack an end time (and therefore no duration). They typically represent exceptions, errors, logs, and messages, though you can create custom events as well.
Context
Span context carries information about a span as it propagates through different components and services. It includes:
- Trace ID: Globally unique identifier for the entire trace (128-bit / 16 bytes, shared by all spans in the trace)
- Span ID: Unique identifier for a specific span within a trace (64-bit / 8 bytes)
- Trace flags: Properties such as sampling status (8-bit field, where
01= sampled) - Trace state: Optional vendor-specific or application-specific data
Context maintains continuity and correlation of spans within a distributed system, allowing services to associate their spans with the correct trace and providing end-to-end visibility.
Span Structure Example
Here's a complete JSON representation of a span showing all key fields:
{
  "traceId": "5b8efff798038103d269b633813fc60c",
  "spanId": "eee19b7ec3c1b174",
  "parentSpanId": "eee19b7ec3c1b173",
  "name": "GET /api/users/:id",
  "kind": "SERVER",
  "startTimeUnixNano": 1704067200000000000,
  "endTimeUnixNano": 1704067200150000000,
  "attributes": [
    {
      "key": "http.method",
      "value": { "stringValue": "GET" }
    },
    {
      "key": "http.route",
      "value": { "stringValue": "/api/users/:id" }
    },
    {
      "key": "http.status_code",
      "value": { "intValue": 200 }
    },
    {
      "key": "service.name",
      "value": { "stringValue": "user-service" }
    }
  ],
  "events": [
    {
      "timeUnixNano": 1704067200050000000,
      "name": "database.query.start",
      "attributes": [
        {
          "key": "db.statement",
          "value": { "stringValue": "SELECT * FROM users WHERE id = ?" }
        }
      ]
    },
    {
      "timeUnixNano": 1704067200100000000,
      "name": "cache.lookup",
      "attributes": [
        {
          "key": "cache.hit",
          "value": { "boolValue": true }
        }
      ]
    }
  ],
  "status": {
    "code": "STATUS_CODE_OK"
  },
  "resource": {
    "attributes": [
      {
        "key": "service.name",
        "value": { "stringValue": "user-service" }
      },
      {
        "key": "service.version",
        "value": { "stringValue": "1.2.3" }
      },
      {
        "key": "host.name",
        "value": { "stringValue": "prod-server-01" }
      }
    ]
  }
}
This span shows:
- Duration: 150ms (from start to end time)
- Parent relationship: Connected to parent span via
parentSpanId - Attributes: HTTP request details and service information
- Events: Two timestamped events during execution (database query and cache lookup)
- Status: Successful operation
- Resource: Service and host metadata
Context Propagation
Context propagation ensures that trace IDs, span IDs, and other metadata consistently propagate across services and components. OpenTelemetry handles both in-process and distributed propagation.
In-Process Propagation
- Implicit: Automatic storage in thread-local variables (Java, Python, Ruby, Node.js)
- Explicit: Manual passing of context as function arguments (Go)
Distributed Propagation
OpenTelemetry supports several protocols for serializing and passing context data:
- W3C Trace Context (recommended, enabled by default): Uses
traceparentheader
Example:traceparent=00-84b54e9330faae5350f0dd8673c98146-279fa73bc935cc05-01 - B3 Zipkin: Uses headers starting with
x-b3-
Example:X-B3-TraceId
W3C Trace Context Format
The traceparent header contains four fields separated by dashes:
traceparent: 00-5b8efff798038103d269b633813fc60c-eee19b7ec3c1b174-01
             ││ │                                │                  └─ Trace flags (01 = sampled, 00 = not sampled)
             ││ │                                └──────────────────── Parent ID (16 hex chars, 8 bytes)
             ││ └───────────────────────────────────────────────────── Trace ID (32 hex chars, 16 bytes)
             │└─────────────────────────────────────────────────────── Version (00 - current W3C standard)
Example HTTP Request with Context:
GET /api/users/123 HTTP/1.1
Host: api.example.com
traceparent: 00-5b8efff798038103d269b633813fc60c-eee19b7ec3c1b174-01
tracestate: uptrace=t61rcWkgMzE
Most OpenTelemetry instrumentation libraries automatically handle context propagation for HTTP requests, gRPC calls, and message queues. For manual propagation examples, message queue patterns, troubleshooting broken traces, and baggage usage, see the full context propagation guide.
Baggage
Baggage propagates custom key-value pairs (user IDs, tenant IDs, feature flags) alongside trace context across service boundaries. Part of the W3C TraceContext specification, baggage enables cross-cutting concerns like multi-tenant filtering or A/B testing without modifying service APIs. See context propagation guide for usage examples and best practices.
Instrumentation
OpenTelemetry instrumentations are plugins for popular frameworks and libraries that use the OpenTelemetry API to record important operations such as HTTP requests, database queries, logs, and errors. After instrumenting, you'll need an OpenTelemetry APM to collect, store, and visualize your trace data. Uptrace is an open source option that accepts OTLP out of the box and requires no additional configuration.
What to Instrument
Focus instrumentation efforts on operations that provide the most value:
- Network operations: HTTP requests, RPC calls
- Filesystem operations: Reading and writing files
- Database queries: Combined network and filesystem operations
- Errors and logs: Using structured logging
Automatic Instrumentation
Automatic instrumentation adds tracing to popular frameworks and libraries without modifying application code. It's the fastest way to get span coverage for HTTP servers, database clients, and message queues.
# Install packages
# pip install opentelemetry-distro opentelemetry-exporter-otlp
# opentelemetry-bootstrap -a install

# Option 1 — CLI agent (zero code changes)
# opentelemetry-instrument --service_name my-service python app.py

# Option 2 — programmatic setup
from opentelemetry.instrumentation.flask import FlaskInstrumentor
from opentelemetry.instrumentation.requests import RequestsInstrumentor
from opentelemetry.instrumentation.sqlalchemy import SQLAlchemyInstrumentor

FlaskInstrumentor().instrument()     # All Flask routes → SERVER spans
RequestsInstrumentor().instrument()  # All HTTP calls → CLIENT spans
SQLAlchemyInstrumentor().instrument() # All SQL queries → CLIENT spans
| Library Type | What gets traced automatically |
|---|---|
| HTTP servers | All incoming requests as SERVER spans |
| HTTP clients | All outbound calls as CLIENT spans |
| SQL databases | All queries as CLIENT spans with db.statement |
| gRPC | Client and server calls |
| Message queues | Kafka, RabbitMQ produce/consume spans |
Use manual instrumentation on top of automatic instrumentation to add business context (order IDs, user tiers, custom events) that auto-instrumentation cannot capture.
Manual Instrumentation
While automatic instrumentation covers common frameworks, manual instrumentation gives you fine-grained control over what gets traced. Here are comprehensive examples for creating and managing spans.
Creating Spans
import (
    "context"
    "go.opentelemetry.io/otel"
    "go.opentelemetry.io/otel/attribute"
    "go.opentelemetry.io/otel/codes"
    "go.opentelemetry.io/otel/trace"
)

// Get tracer (typically done once at startup)
tracer := otel.Tracer("my-service")

func processOrder(ctx context.Context, orderID string) error {
    // Create a span
    ctx, span := tracer.Start(ctx, "process_order",
        trace.WithSpanKind(trace.SpanKindInternal),
    )
    defer span.End()

    // Add attributes
    span.SetAttributes(
        attribute.String("order.id", orderID),
        attribute.String("customer.tier", "premium"),
    )

    // Do work
    if err := validateOrder(ctx, orderID); err != nil {
        // Record error
        span.RecordError(err)
        span.SetStatus(codes.Error, "order validation failed")
        return err
    }

    // Record event
    span.AddEvent("order_validated",
        trace.WithAttributes(
            attribute.String("validation.result", "success"),
        ))

    span.SetStatus(codes.Ok, "order processed successfully")
    return nil
}
Creating Nested Spans
Nested spans show parent-child relationships and help visualize the breakdown of operations.
func processOrder(ctx context.Context, orderID string) error {
    ctx, span := tracer.Start(ctx, "process_order")
    defer span.End()

    // Child span 1: Validate
    if err := validateOrder(ctx, orderID); err != nil {
        return err
    }

    // Child span 2: Calculate
    total, err := calculateTotal(ctx, orderID)
    if err != nil {
        return err
    }

    // Child span 3: Save
    return saveOrder(ctx, orderID, total)
}

func validateOrder(ctx context.Context, orderID string) error {
    ctx, span := tracer.Start(ctx, "validate_order")
    defer span.End()

    // Validation logic
    return nil
}

func calculateTotal(ctx context.Context, orderID string) (float64, error) {
    ctx, span := tracer.Start(ctx, "calculate_total")
    defer span.End()

    // Calculation logic
    return 99.99, nil
}

func saveOrder(ctx context.Context, orderID string, total float64) error {
    ctx, span := tracer.Start(ctx, "save_order",
        trace.WithSpanKind(trace.SpanKindClient),
    )
    defer span.End()

    span.SetAttributes(
        attribute.Float64("order.total", total),
        attribute.String("db.system", "postgresql"),
    )

    // Database save logic
    return nil
}
The resulting trace will show:
process_order (200ms)
├── validate_order (50ms)
├── calculate_total (30ms)
└── save_order (120ms)
Adding Semantic Attributes
Use semantic conventions for consistent attribute naming:
import "go.opentelemetry.io/otel/semconv/v1.24.0"

// HTTP attributes
span.SetAttributes(
    semconv.HTTPMethod("GET"),
    semconv.HTTPRoute("/api/users/:id"),
    semconv.HTTPStatusCode(200),
)

// Database attributes
span.SetAttributes(
    semconv.DBSystemPostgreSQL,
    semconv.DBNamespace("production"),
    semconv.DBQueryText("SELECT * FROM users WHERE id = ?"),
)

// Messaging attributes
span.SetAttributes(
    semconv.MessagingSystemKafka,
    semconv.MessagingDestinationName("user.events"),
)

// RPC attributes
span.SetAttributes(
    semconv.RPCSystemGRPC,
    semconv.RPCService("UserService"),
    semconv.RPCMethod("GetUser"),
)
Recording Events and Errors
Events capture point-in-time occurrences within a span:
// Record a simple event
span.AddEvent("cache_miss")

// Event with attributes
span.AddEvent("retry_attempt",
    trace.WithAttributes(
        attribute.Int("attempt.number", 3),
        attribute.String("retry.reason", "connection_timeout"),
    ))

// Record an error
if err != nil {
    span.RecordError(err,
        trace.WithAttributes(
            attribute.String("error.type", "ValidationError"),
        ))
    span.SetStatus(codes.Error, err.Error())
}
Sampling
Sampling controls what fraction of traces gets recorded and exported. Without sampling, high-traffic services produce millions of spans per minute — too expensive to store and too noisy to analyze.
Head-Based vs Tail-Based Sampling
Head-based sampling (the default) makes the sampling decision at the trace root before any child spans are created. All downstream services inherit the same decision, so a trace is either fully captured or entirely dropped.
Tail-based sampling defers the decision until the complete trace is assembled. This lets you always capture error and slow traces while sampling fast, successful ones — but requires a stateful component (like the OpenTelemetry Collector) to buffer and evaluate complete traces.
Sampling Strategies
| Strategy | Description | Best For |
|---|---|---|
AlwaysOn | Record every trace (100%) | Development, low-traffic services |
AlwaysOff | Record no traces (0%) | Temporarily disabling tracing |
TraceIDRatioBased | Record a fixed percentage (e.g., 1%) | High-traffic production services |
ParentBased | Inherit sampling decision from parent | Consistent sampling across services |
| Tail-based (Collector) | Decide after full trace is available | Capturing all errors, sampling successes |
import "go.opentelemetry.io/otel/sdk/trace"

// Sample 5% of requests
sampler := sdktrace.TraceIDRatioBased(0.05)

// Respect parent's decision; fall back to 5% for root spans
sampler := sdktrace.ParentBased(sdktrace.TraceIDRatioBased(0.05))

tp := sdktrace.NewTracerProvider(
    sdktrace.WithSampler(sampler),
)
For tail-based sampling with the OpenTelemetry Collector — including always capturing errors and slow traces — see the full sampling guide.
Distributed Tracing for AI and LLM Applications
The rise of LLM-based applications and AI agents introduces new distributed tracing requirements. Unlike traditional microservices, AI workloads involve non-deterministic operations, token-based costs, and multi-step agent chains that require specialized observability.
OpenTelemetry's GenAI semantic conventions standardize attribute names for AI/LLM instrumentation:
| Attribute | Description | Example |
|---|---|---|
gen_ai.system | LLM provider | openai, anthropic |
gen_ai.request.model | Model name | gpt-4o, claude-3-5-sonnet |
gen_ai.usage.input_tokens | Tokens consumed in the prompt | 512 |
gen_ai.usage.output_tokens | Tokens in the response | 128 |
gen_ai.request.temperature | Model temperature setting | 0.7 |
AI Agent Tracing
Multi-step AI agent workflows create deeply nested traces where each tool call, LLM invocation, and retrieval operation becomes a span. This gives you:
- Latency attribution: Which LLM call or tool takes the most time in the chain
- Token cost tracking: Map token usage to specific operations and users
- Failure debugging: See exactly which step in an agent chain caused an error
- Prompt correlation: Link input prompts to outputs via trace IDs for regression analysis
from opentelemetry import trace
from opentelemetry.semconv._incubating.attributes import gen_ai_attributes

tracer = trace.get_tracer("ai-service")

def call_llm(prompt: str, model: str = "gpt-4o"):
    with tracer.start_as_current_span("llm.chat") as span:
        span.set_attributes({
            gen_ai_attributes.GEN_AI_SYSTEM: "openai",
            gen_ai_attributes.GEN_AI_REQUEST_MODEL: model,
            "gen_ai.request.temperature": 0.7,
        })

        response = openai_client.chat.completions.create(
            model=model,
            messages=[{"role": "user", "content": prompt}],
        )

        span.set_attributes({
            gen_ai_attributes.GEN_AI_USAGE_INPUT_TOKENS: response.usage.prompt_tokens,
            gen_ai_attributes.GEN_AI_USAGE_OUTPUT_TOKENS: response.usage.completion_tokens,
        })

        return response.choices[0].message.content
A trace for an AI agent chain might look like:
agent.run (1200ms)
├── retrieve_context (80ms)       ← vector DB lookup
├── llm.chat (950ms)              ← GPT-4o call (1024 input tokens, 312 output)
│   └── tool_call: search (120ms) ← tool invoked by the model
└── format_response (15ms)
For a comprehensive implementation guide, see OpenTelemetry for AI systems.
Challenges and Solutions
Implementing distributed tracing presents several common challenges. Understanding these issues and their solutions helps ensure a successful deployment.
Performance Overhead
Adding tracing to production systems introduces latency and resource consumption. The key is balancing observability with performance.
Challenge: Application latency increases after enabling tracing, especially in high-throughput services processing thousands of requests per second.
Solutions:
- Use asynchronous batch exporters: Never block application threads waiting for span export. OpenTelemetry SDKs default to async batch exporters that queue spans in memory and export in batches.
- Implement smart sampling: Sample 1-5% of requests in high-traffic applications, 100% in low-traffic services. Consider tail-based sampling to capture all errors while sampling successful requests.
- Instrument selectively: Focus on critical paths (API endpoints, database queries, external calls) rather than every function. Over-instrumentation creates more overhead than value.
- Limit attribute sizes: Cap string attribute lengths to prevent large payloads. Remove high-cardinality attributes like full SQL queries or request bodies.
Data Volume and Cardinality
High cardinality in span names or attributes causes storage bloat and query performance degradation in tracing backends.
Challenge: Hundreds of thousands of unique span names appear because span names include variable data like IDs or timestamps.
Solutions:
- Parameterize span names: Use
GET /users/{id}instead ofGET /users/12345. Follow semantic conventions for consistent naming patterns. - Bucket attribute values: Convert numeric values into ranges (e.g.,
latency_bucket=100-200msinstead oflatency=127ms). - Avoid unique identifiers in span names: Put request IDs, user IDs, and transaction IDs in attributes, not span names.
Missing or Disconnected Spans
Incomplete traces make it difficult to understand request flow and identify bottlenecks.
Challenge: Expected spans don't appear, or spans appear disconnected across services instead of forming a single trace.
Common causes and solutions:
- SDK initialized too late: Initialize OpenTelemetry before importing libraries that require instrumentation. Place initialization at application startup, before HTTP server or database connections start.
- Broken context propagation: Context fails to propagate across service boundaries, creating orphaned spans.
- Verify HTTP client/server instrumentation is active
- Configure propagators globally:
otel.SetTextMapPropagator(propagation.TraceContext{}) - For async operations (goroutines, threads, workers), explicitly pass context
- See context propagation troubleshooting for detailed debugging steps
- Aggressive sampling: Sampling drops spans before export. Temporarily set sampling to 100% during debugging to verify instrumentation works.
- Export failures: Spans generate but fail to reach the backend due to network issues, authentication problems, or backend unavailability. Enable debug logging and monitor exporter metrics to identify export failures.
Resource Management
Improper span lifecycle management leads to memory leaks and resource exhaustion.
Challenge: Memory usage grows over time or spans accumulate in buffers without being exported.
Solutions:
- Always end spans: Use
defer span.End()(Go),try-finally(Java/Python), orfinallyblocks (JavaScript) to ensure spans close even when errors occur. - Configure appropriate export intervals: Balance between real-time observability and export overhead. Default batch exporters typically export every 5 seconds or when buffer reaches 512 spans.
- Monitor buffer sizes: Set maximum queue sizes to prevent unbounded memory growth. Configure
OTEL_BSP_MAX_QUEUE_SIZEenvironment variable. - Review span lifecycle: Long-running spans (hours or days) hold memory until export. Consider splitting long operations into shorter spans.
Visualizing Traces with Uptrace
Once your services are instrumented, you need a backend to store and explore trace data. Uptrace is an open source OpenTelemetry APM built on ClickHouse that gives you trace visualization, service maps, and alerting — with no vendor lock-in.
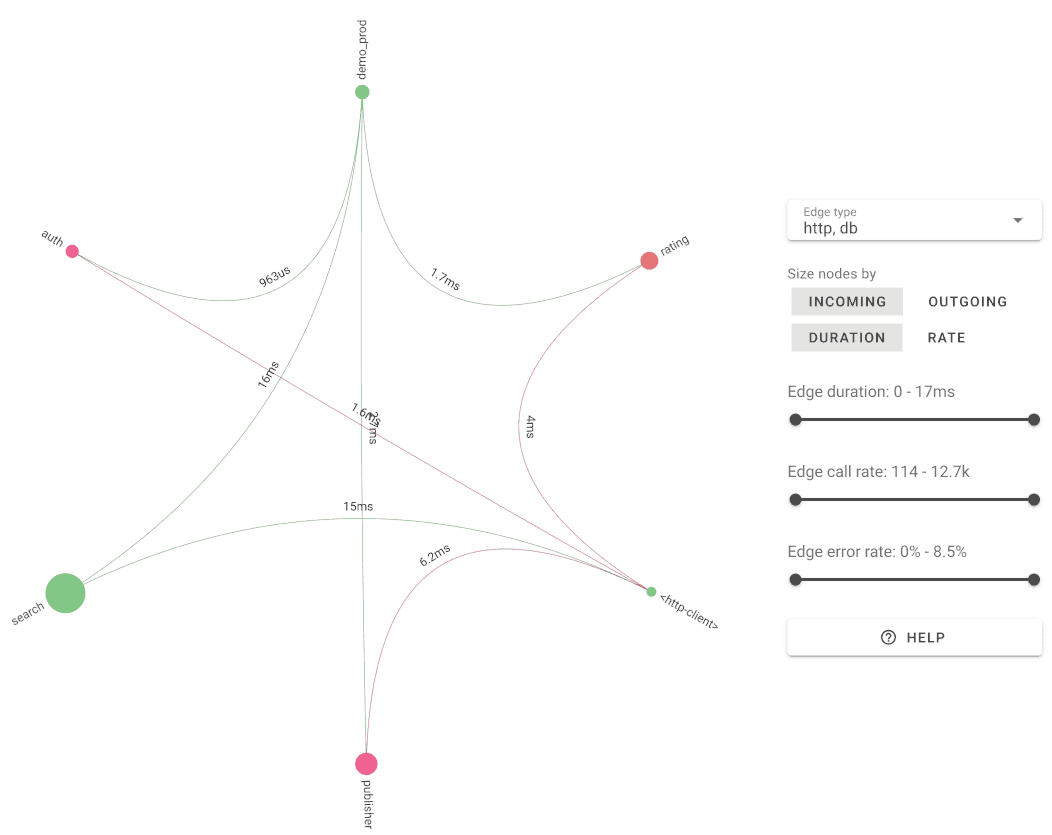
Uptrace automatically builds a service map from your trace data — showing dependencies, request rates, and error rates across all services without any extra configuration.
Key tracing features in Uptrace:
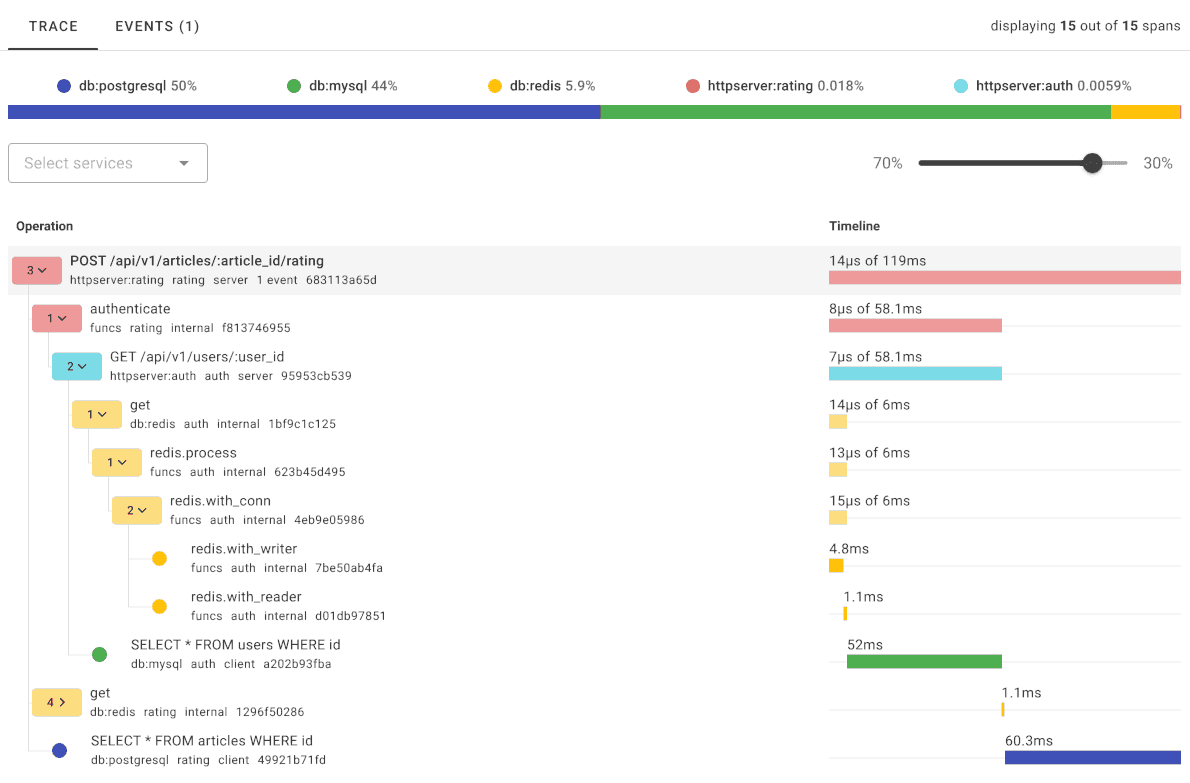
- Trace waterfall: Visual breakdown of span durations, errors, and attributes per request
- Service map: Auto-generated topology from observed span relationships
- Alerting: Notify on p99 latency spikes, error rate thresholds, or missing spans
- Correlated logs: Jump from a slow span directly to related log entries via trace ID
- ClickHouse storage: Query billions of spans in milliseconds on a single server
You can try Uptrace without creating an account, or self-host it for free.
Next Steps
Distributed tracing provides valuable insights for understanding end-to-end application behavior, identifying performance issues, and optimizing system resources.
Explore the OpenTelemetry tracing API for your programming language: