Monitor Redis with OpenTelemetry Collector
This guide shows you how to implement Redis monitoring using OpenTelemetry Collector and Uptrace. It covers both monitoring approaches:
| Approach | How it works | What you get |
|---|---|---|
| Server-side (Collector receiver) | OTel Collector runs INFO on your Redis server | Broker metrics: memory, connections, replication, persistence |
| Client-side (SDK instrumentation) | Instrument your app's Redis client library | Per-command traces, latency, errors linked to your application spans |
Use both together for full observability: the Collector gives you cluster health, SDK instrumentation shows you how your code interacts with Redis. You will configure the Redis receiver to collect server metrics and optionally add application-level tracing with OpenTelemetry SDKs.
Quick Setup
| Step | Action | Details |
|---|---|---|
| 1. Install Collector | Install OTel Collector | Use the otelcol-contrib distribution |
| 2. Configure receiver | Add Redis receiver to config | Set endpoint, password, and collection_interval |
| 3. Set exporter | Point exporter to backend | Configure OTLP exporter with your Uptrace DSN |
| 4. Restart service | Apply changes | sudo systemctl restart otelcol-contrib |
Prerequisites
Before you begin, make sure you have:
- A running Redis instance (2.8 or later; Redis 7.x/8.x recommended)
- OpenTelemetry Collector Contrib installed on a host that can reach your Redis server
- An Uptrace DSN (cloud or self-hosted)
Verify that your Redis server is running and reachable:
redis-cli -h localhost -p 6379 ping
For Redis instances that require authentication:
redis-cli -h localhost -p 6379 -a "$REDIS_PASSWORD" ping
What is OpenTelemetry Collector?
OpenTelemetry Collector is a vendor-agnostic agent that collects telemetry data from systems you want to monitor and exports it to an OpenTelemetry backend. It uses a pipeline architecture with receivers, processors, and exporters, letting you collect Redis metrics alongside application traces and logs in a single agent.
OpenTelemetry Redis receiver
The Redis receiver connects to your Redis instance and periodically runs the INFO command to collect server statistics. It requires no special Redis configuration or modules.
To start monitoring Redis, configure the receiver in /etc/otel-contrib-collector/config.yaml using your Uptrace DSN:
receivers:
  otlp:
    protocols:
      grpc:
      http:
  redis:
    endpoint: localhost:6379
    collection_interval: 10s
    password: ${env:REDIS_PASSWORD}  # Optional: use env var for security

exporters:
  otlp/uptrace:
    endpoint: api.uptrace.dev:4317
    headers: { 'uptrace-dsn': '<FIXME>' }

processors:
  resourcedetection:
    detectors: [env, system]        # Adds hostname and OS as resource attributes
  cumulativetodelta:                 # Converts cumulative counters to deltas
  batch:
    timeout: 10s

service:
  pipelines:
    traces:
      receivers: [otlp]
      processors: [batch]
      exporters: [otlp/uptrace]
    metrics:
      receivers: [otlp, redis]
      processors: [cumulativetodelta, batch, resourcedetection]
      exporters: [otlp/uptrace]
Restart the Collector and check the logs:
sudo systemctl restart otelcol-contrib
sudo journalctl -u otelcol-contrib -f
You should see Receiver started with name=redis in the output.
Advanced Redis receiver configuration
The Redis receiver supports additional options for secured or customized deployments:
receivers:
  redis:
    endpoint: localhost:6379
    collection_interval: 30s
    password: ${env:REDIS_PASSWORD}
    username: ${env:REDIS_USERNAME}    # Redis 6.0+ ACL
    tls:
      insecure: false
      ca_file: /etc/ssl/certs/ca.pem
      cert_file: /etc/ssl/certs/client.pem
      key_file: /etc/ssl/private/client-key.pem
    initial_delay: 1s
    timeout: 10s
See the full configuration reference for all available options.
Monitoring multiple Redis instances
To monitor several Redis servers from a single Collector, define multiple Redis receivers with unique names:
receivers:
  redis/primary:
    endpoint: primary.redis.local:6379
    collection_interval: 10s
    password: ${env:REDIS_PRIMARY_PASSWORD}
  redis/replica:
    endpoint: replica.redis.local:6379
    collection_interval: 10s
    password: ${env:REDIS_REPLICA_PASSWORD}

service:
  pipelines:
    metrics:
      receivers: [redis/primary, redis/replica]
      processors: [cumulativetodelta, batch, resourcedetection]
      exporters: [otlp/uptrace]
Each receiver instance reports metrics with a different server.address resource attribute, so you can filter and group dashboards by instance.
For Redis Cluster deployments, configure a separate receiver for each node in the cluster. The receiver collects node-level metrics; there is no built-in cluster topology discovery.
Redis Sentinel monitoring
Redis Sentinel provides high availability through automatic failover. To monitor Sentinel instances, point receivers at each Sentinel process (default port 26379) alongside the actual Redis nodes:
receivers:
  redis/sentinel-1:
    endpoint: sentinel-1.redis.local:26379
    collection_interval: 15s
  redis/sentinel-2:
    endpoint: sentinel-2.redis.local:26379
    collection_interval: 15s
  redis/master:
    endpoint: master.redis.local:6379
    collection_interval: 10s
    password: ${env:REDIS_PASSWORD}

service:
  pipelines:
    metrics:
      receivers: [redis/sentinel-1, redis/sentinel-2, redis/master]
      processors: [cumulativetodelta, batch, resourcedetection]
      exporters: [otlp/uptrace]
Sentinel instances expose standard Redis metrics through the INFO command. Monitor redis.clients.connected on Sentinel nodes to detect connectivity issues, and watch redis.slaves.connected on the master to detect replica failures before failover triggers.
Available metrics
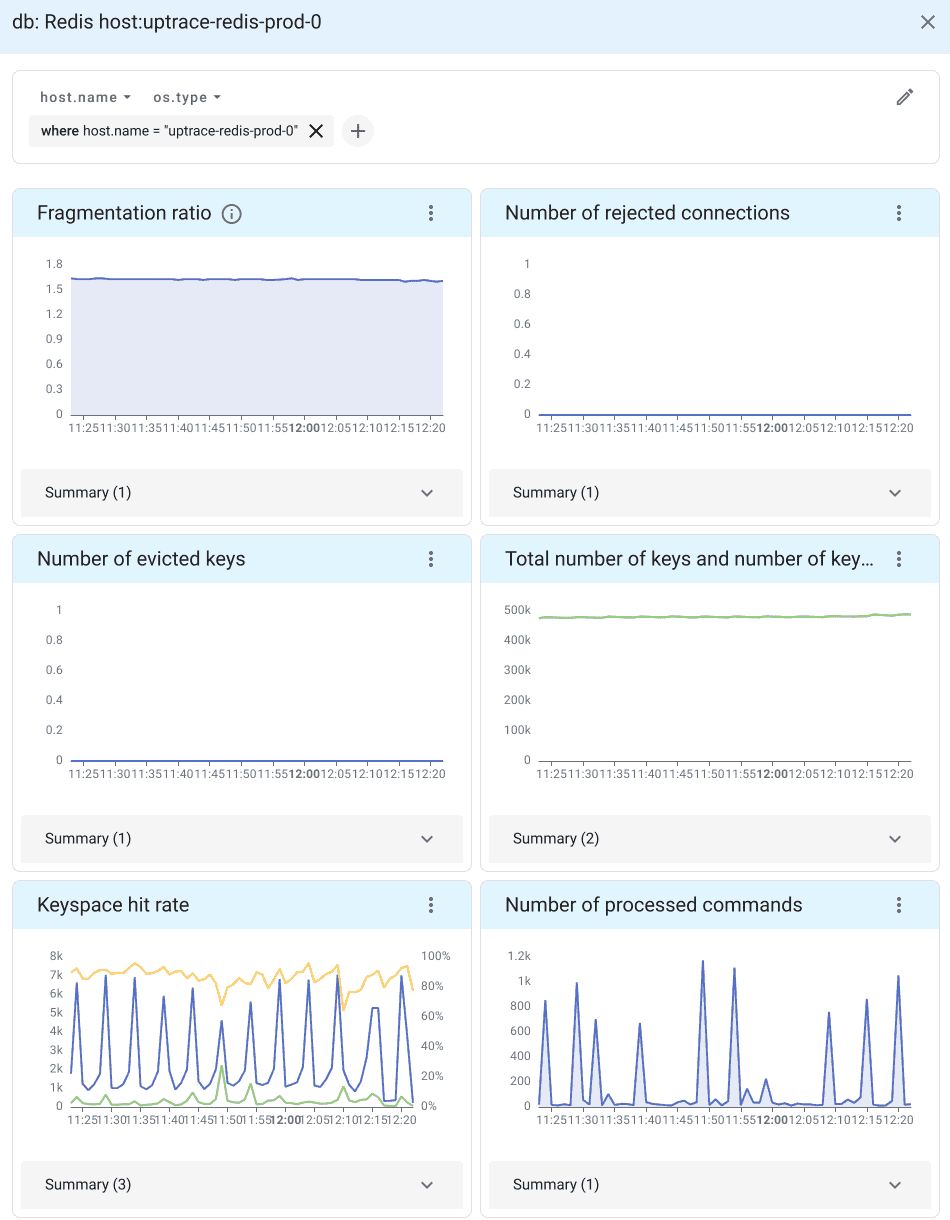
When telemetry data reaches Uptrace, it automatically generates a Redis dashboard from a pre-defined template.
Connection metrics
Connection metrics reveal how clients interact with your Redis server:
| Metric | Description |
|---|---|
redis.clients.connected | Number of connected clients (excluding replicas) |
redis.clients.blocked | Clients blocked on a blocking call (BLPOP, BRPOP) |
redis.clients.max_input_buffer | Largest input buffer among current connections |
redis.clients.max_output_buffer | Largest output buffer among current connections |
redis.connections.rejected | Connections rejected due to maxclients limit |
Non-zero redis.connections.rejected indicates you need to raise maxclients or investigate connection leaks.
Memory metrics
Memory is often the primary constraint for Redis. These metrics help you track usage and detect fragmentation:
| Metric | Description |
|---|---|
redis.memory.used | Total bytes allocated by the Redis allocator |
redis.memory.peak | Peak memory consumed since the server started |
redis.memory.rss | Resident set size (memory as seen by the OS) |
redis.memory.fragmentation_ratio | Ratio of RSS to used memory (ideal: 1.0-1.5) |
redis.memory.lua | Memory used by the Lua engine |
A fragmentation_ratio above 1.5 means Redis is wasting memory. Values below 1.0 indicate swapping to disk, which severely degrades performance.
Performance metrics
Performance metrics track command throughput, cache effectiveness, and network utilization:
| Metric | Description |
|---|---|
redis.commands.processed | Total number of commands processed by the server |
redis.keyspace.hits | Successful key lookups in the main dictionary |
redis.keyspace.misses | Failed key lookups (key not found) |
redis.net.input | Total bytes read from the network |
redis.net.output | Total bytes written to the network |
redis.cpu.time | CPU time consumed (system and user, in seconds) |
Cache hit rate is the single most important Redis health indicator:
hit rate = redis.keyspace.hits / (redis.keyspace.hits + redis.keyspace.misses)
A healthy cache stays above 90%. A sudden drop signals key eviction, TTL misconfiguration, or a cold-cache event (e.g., after a restart).
Persistence metrics
| Metric | Description |
|---|---|
redis.rdb.changes_since_last_save | Number of changes since the last RDB snapshot |
redis.latest_fork | Duration of the last fork operation (microseconds) |
A large rdb.changes_since_last_save value means more data is at risk if the server crashes. Long fork durations (above 100ms) indicate the dataset is too large for efficient background saves.
Replication metrics
Replication metrics are essential when running Redis in a primary-replica topology:
| Metric | Description |
|---|---|
redis.replication.offset | Current replication offset on the primary |
redis.replication.backlog_first_byte_offset | First byte offset in the replication backlog |
redis.slaves.connected | Number of connected replicas |
The metric name redis.slaves.connected retains the legacy Redis terminology for backward compatibility; it counts connected replicas.
Monitor redis.slaves.connected to detect replica disconnections. A gap between the primary's replication.offset and a replica's offset indicates replication lag.
Redis SDK instrumentation
In addition to server-level metrics from the Collector, you can instrument your application code to trace individual Redis commands.
import (
    "github.com/redis/go-redis/v9"
    "github.com/redis/go-redis/extra/redisotel/v9"
)

rdb := redis.NewClient(&redis.Options{
    Addr: "localhost:6379",
})

// Enable tracing instrumentation
if err := redisotel.InstrumentTracing(rdb); err != nil {
    panic(err)
}

// Enable metrics instrumentation
if err := redisotel.InstrumentMetrics(rdb); err != nil {
    panic(err)
}
For other languages, see the OpenTelemetry Registry for available Redis instrumentations.
Alerting on Redis metrics
After metrics are flowing into Uptrace, set up alerting rules to catch problems before they affect users.
High memory usage — alert when memory exceeds 80% of peak:
name: Redis high memory usage
metrics:
  - redis.memory.used as $used
  - redis.memory.peak as $peak
query: $used > $peak * 0.8
for: 5m
Low cache hit rate — alert when the hit rate drops below 80%:
name: Redis low cache hit rate
metrics:
  - redis.keyspace.hits as $hits
  - redis.keyspace.misses as $misses
query: $hits / ($hits + $misses) < 0.8
for: 10m
Too many connected clients — alert when connections approach the limit:
name: Redis too many connections
metrics:
  - redis.clients.connected as $connected
query: $connected > 900
for: 5m
Replica disconnected — alert when a replica drops off:
name: Redis replica disconnected
metrics:
  - redis.slaves.connected as $replicas
query: $replicas < 1
for: 1m
Troubleshooting Redis monitoring
Connection refused: Verify that the Collector can reach Redis. If Redis is bound to 127.0.0.1 and the Collector runs on a different host, update bind in redis.conf or use a local Collector. Test with redis-cli -h localhost -p 6379 ping.
Authentication failed: Ensure the REDIS_PASSWORD environment variable is set for the Collector process. Test with redis-cli -h localhost -p 6379 -a "$REDIS_PASSWORD" info server.
TLS connection failures: For TLS-enabled Redis (e.g., AWS ElastiCache), configure the tls block with insecure: false and provide the CA certificate path. Common issues include expired certificates and missing CA bundles.
ACL permission denied (Redis 6.0+): The monitoring user needs at least the info command permission. Create a dedicated user:
redis-cli ACL SETUSER otel-monitor on >password ~* +info +ping
High memory fragmentation: If redis.memory.fragmentation_ratio stays above 2.0, enable active defragmentation (CONFIG SET activedefrag yes) or schedule a restart.
No metrics appearing: Check the Collector logs (sudo journalctl -u otelcol-contrib -f | grep redis) and verify the receiver is listed in service.pipelines.metrics.receivers.
OpenTelemetry Backend
Uptrace is an OpenTelemetry APM that supports distributed tracing, metrics, and logs. You can use it to monitor applications and troubleshoot issues.

Uptrace comes with an intuitive query builder, rich dashboards, alerting rules with notifications, and integrations for most languages and frameworks.
In just a few minutes, you can try Uptrace by visiting the cloud demo (no login required) or running it locally with Docker. The source code is available on GitHub.
FAQ
Can I monitor multiple Redis instances with one Collector?
Yes. Define multiple receivers with unique names (e.g., redis/primary, redis/replica) and include them all in your metrics pipeline.
Does the Redis receiver impact performance?
Minimal impact. The receiver runs the lightweight INFO command at each collection interval, which is non-blocking.
How do I monitor Redis Cluster?
Configure a separate receiver for each cluster node. There is no built-in topology discovery, so list each node explicitly.
Can I monitor Redis Sentinel?
Yes. Sentinel instances expose the INFO command on their port (default 26379). Add a receiver for each Sentinel node alongside your Redis master and replica receivers.
Can I monitor Valkey with the Redis receiver?
Yes. Valkey is a Redis fork that exposes the same INFO command. The Redis receiver works with Valkey out of the box — point the endpoint at your Valkey instance exactly as you would for Redis. A dedicated Valkey receiver is under development in the OpenTelemetry Collector contrib repository.
What collection interval should I use?
10 seconds works well for most workloads. Use 5 seconds for high-traffic instances that need fast spike detection, or 30 seconds for large deployments to reduce overhead.
Can I collect Redis logs with OpenTelemetry?
Yes. Use the filelog receiver pointed at /var/log/redis/redis-server.log.
What's next?
- Monitor your database layer with PostgreSQL monitoring or MySQL monitoring
- Add message queue observability with Kafka monitoring or RabbitMQ monitoring
- Set up infrastructure monitoring with Docker monitoring
- Learn about the OpenTelemetry Collector architecture
- Collect Redis logs using the filelog receiver