Top 10 Site Reliability Engineering Tools
Site reliability engineers rely on specialized tools to monitor systems, automate operations, and maintain service reliability at scale. The right SRE toolchain enables teams to implement core principles like error budgets, SLOs, and incident response while reducing manual toil.
This guide examines the essential SRE tools across monitoring, incident management, automation, and observability platforms that enable teams to build reliable, scalable systems.
SRE Tool Categories
SRE tools fall into five primary categories, each addressing specific aspects of reliability engineering:
Monitoring and Observability tools provide visibility into system behavior through metrics, logs, and traces. These form the foundation for understanding what SRE teams need to measure and maintain.
Incident Management platforms handle alerting, on-call scheduling, and response coordination when issues occur.
Infrastructure Automation tools manage deployments, configuration, and scaling through code rather than manual processes.
SLO Management solutions track service level objectives and error budgets to balance reliability with feature velocity.
Collaboration platforms facilitate knowledge sharing and communication during both normal operations and incident response.
Prometheus
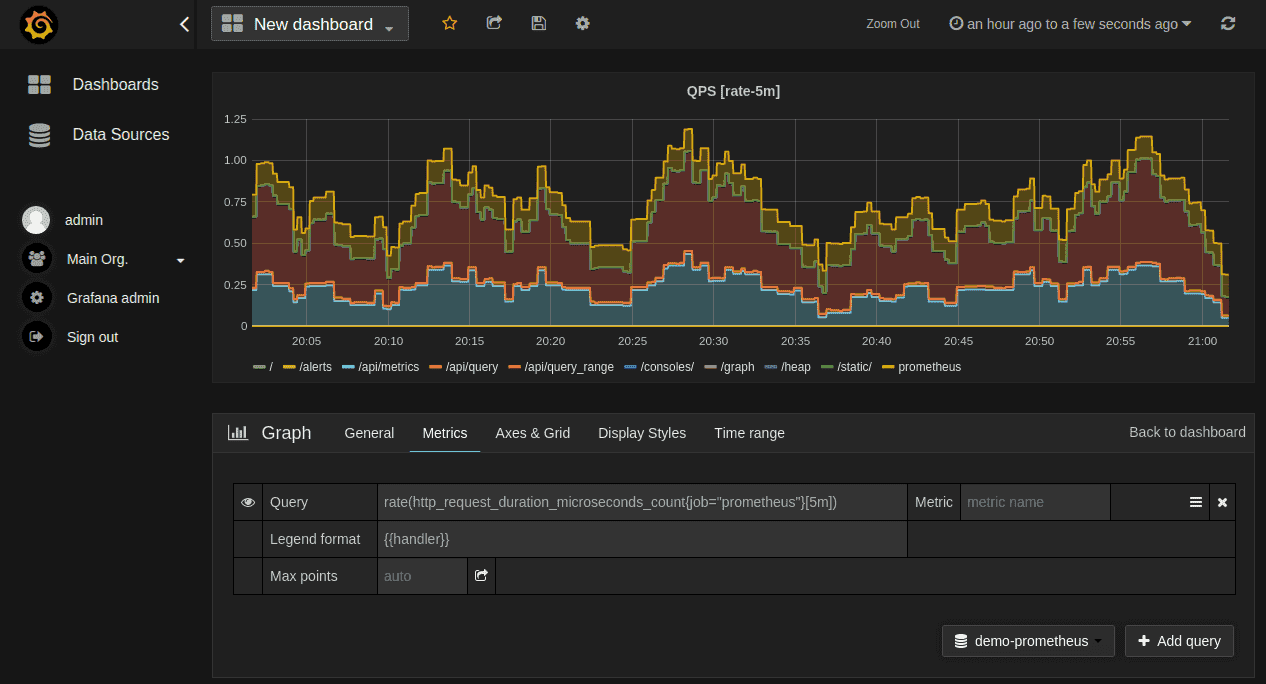
Prometheus is an open-source monitoring system that excels at collecting and storing time-series data. Originally developed at SoundCloud, it has become the de facto standard for cloud-native monitoring.
Key Features:
- Dimensional data model with flexible querying language (PromQL)
- Pull-based metric collection from instrumented applications
- Service discovery for dynamic environments like Kubernetes
- Built-in alerting with customizable rules and notifications
- High availability through federation and clustering
Why SREs Choose Prometheus:
Prometheus provides the metrics foundation needed for SLI measurement and SLO tracking. Its time-series database efficiently handles the scale required for modern distributed systems.
Best Use Cases:
- Kubernetes and cloud-native environments
- Custom application metrics collection
- Infrastructure monitoring and capacity planning
- Building error budget tracking systems
Pricing: Open-source with optional commercial support
Grafana
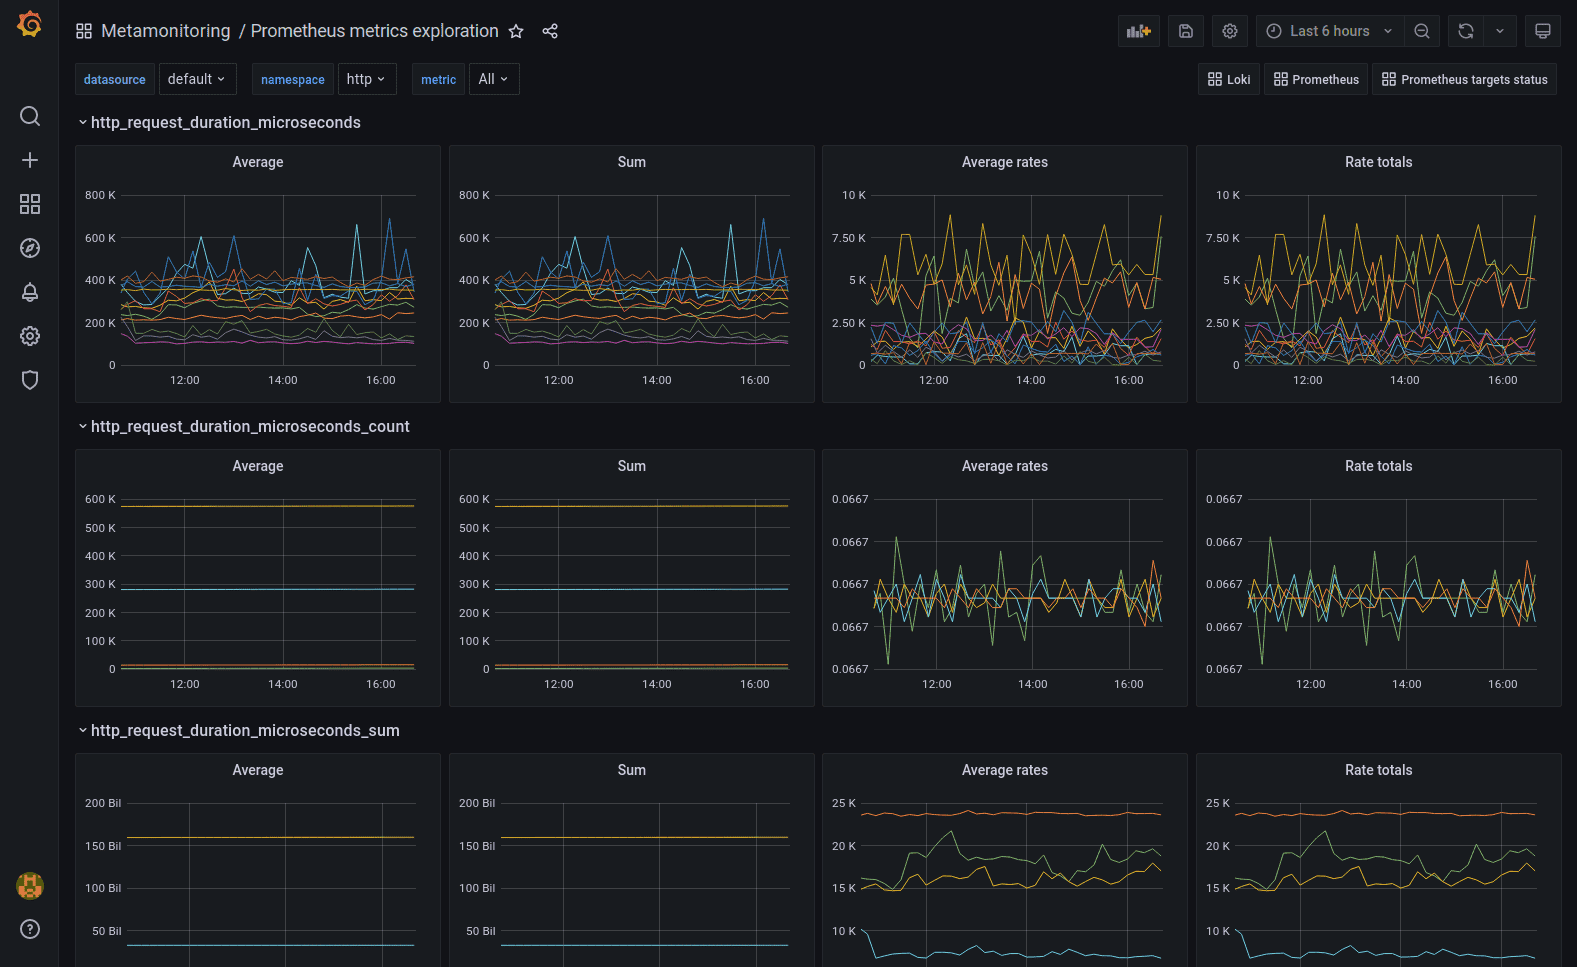
Grafana transforms raw monitoring data into actionable insights through powerful visualization and dashboarding capabilities. It integrates with dozens of data sources to create unified operational views.
Key Features:
- Rich visualizations including graphs, heatmaps, and single-stat panels
- Templating for dynamic dashboard creation across environments
- Alerting with notification channels to various platforms
- User management with role-based access control
- Plugin ecosystem extending functionality
Why SREs Choose Grafana:
Visual dashboards help SRE teams quickly identify patterns, anomalies, and trends across complex systems. Real-time monitoring enables proactive incident prevention.
Integration with SRE Practices:
Teams use Grafana to display SLI metrics, track error budgets visually, and create operational runbooks with embedded charts and documentation.
Best Use Cases:
- Real-time operational dashboards
- SLO visualization and tracking
- Capacity planning and trend analysis
- Incident investigation and postmortem creation
Pricing: Open-source with Grafana Cloud managed service available
Uptrace
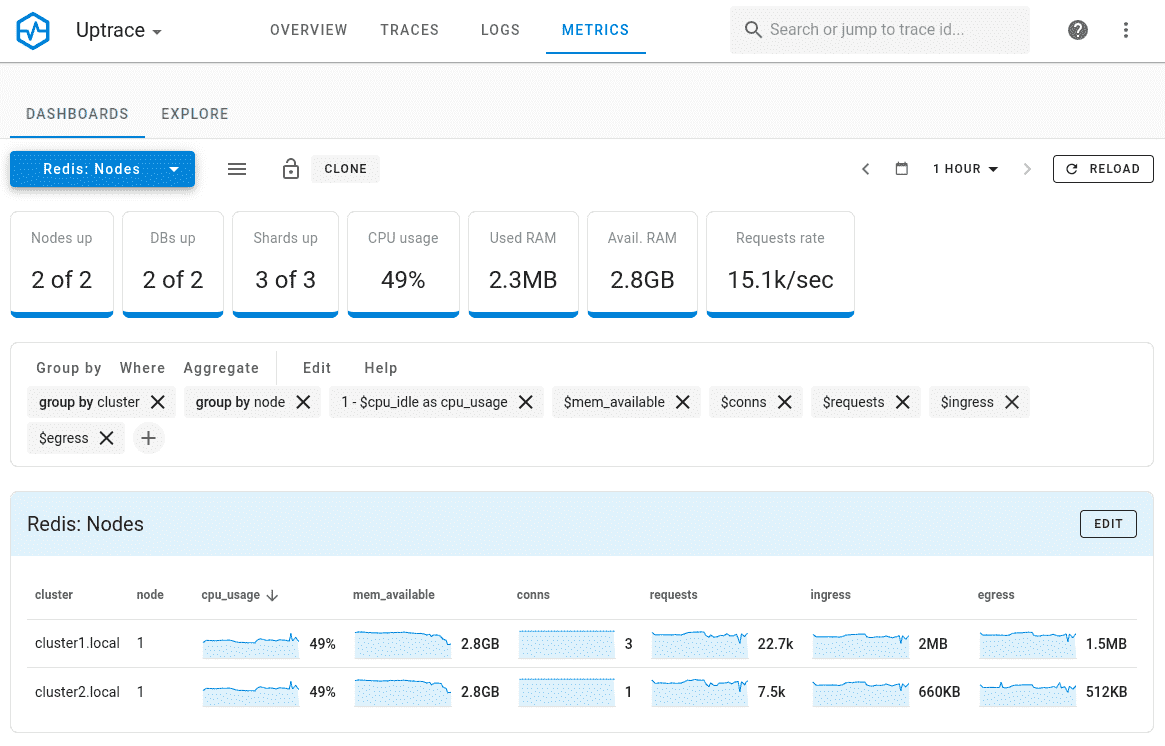
Uptrace is an all-in-one observability platform built on OpenTelemetry that combines distributed tracing, metrics, and logs in a unified interface. It provides complete visibility into distributed systems.
Key Features:
- OpenTelemetry-native design ensuring compatibility and future-proofing
- Distributed tracing with automatic service maps and dependency visualization
- Unified observability correlating traces, metrics, and logs
- Cost-efficient storage using ClickHouse for 10-20x data compression
- Self-hosted deployment for complete data ownership
Why SREs Choose Uptrace:
Uptrace bridges the gap between traditional monitoring and modern observability needs. Its OpenTelemetry foundation prevents vendor lock-in while providing comprehensive system insights.
SRE-Specific Benefits:
- Error tracking with automatic grouping and root cause analysis
- Performance monitoring across distributed services
- SLO tracking with built-in alerting and error budget management
- Cost transparency without per-host or per-user pricing models
Best Use Cases:
- Microservices and distributed architectures
- Organizations prioritizing data sovereignty
- Teams adopting OpenTelemetry standards
- Cost-conscious deployments requiring comprehensive observability
Pricing: Open-source self-hosted version with transparent commercial pricing
PagerDuty
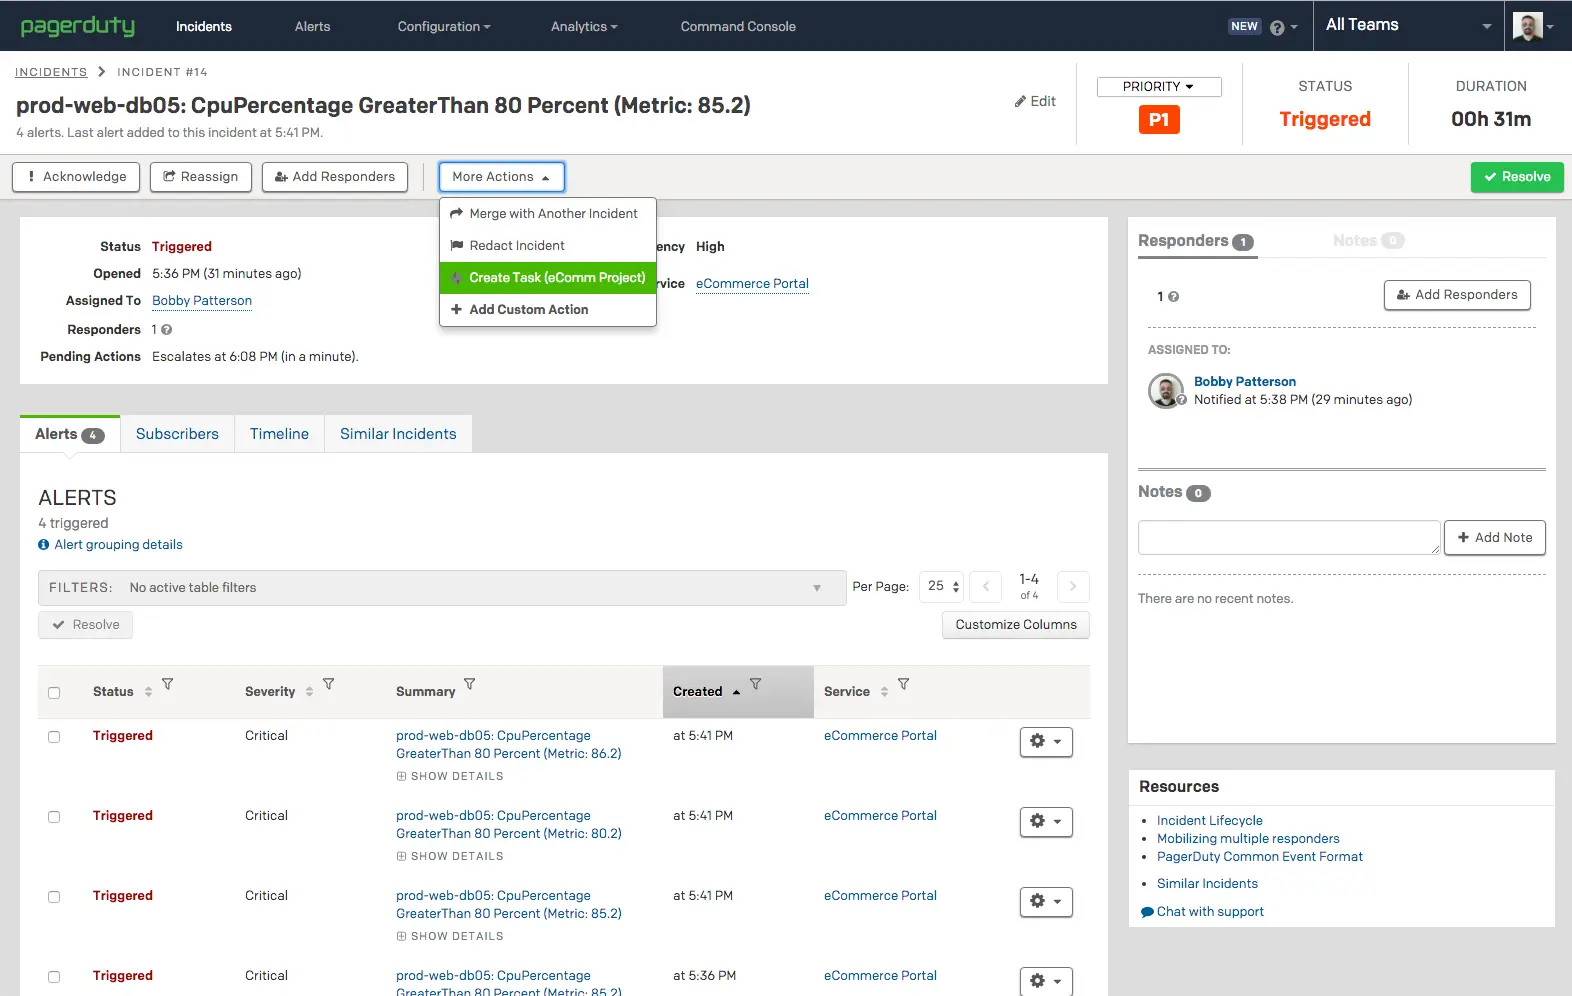
PagerDuty leads the incident management space with comprehensive on-call scheduling, escalation policies, and response automation. It ensures critical issues reach the right people at the right time.
Key Features:
- Intelligent alerting with noise reduction and event correlation
- On-call scheduling with automatic rotations and escalations
- Incident response workflows with status pages and communication tools
- Analytics and reporting for measuring incident response effectiveness
- Mobile applications for managing incidents from anywhere
Why SREs Choose PagerDuty:
Reliable incident response is crucial for maintaining SLOs. PagerDuty automates the coordination needed to resolve issues quickly while minimizing alert fatigue.
Integration Benefits:
PagerDuty connects with monitoring tools like Prometheus and Grafana to automatically create incidents when SLOs are breached or critical thresholds are exceeded.
Best Use Cases:
- 24/7 production systems requiring immediate response
- Teams with complex on-call rotations
- Organizations needing compliance and audit trails
- Multi-team environments requiring coordinated response
Pricing: Subscription-based with plans starting at professional levels
Kubernetes
Kubernetes serves as the foundation for container orchestration and automated infrastructure management. While not exclusively an SRE tool, it enables many reliability engineering practices.
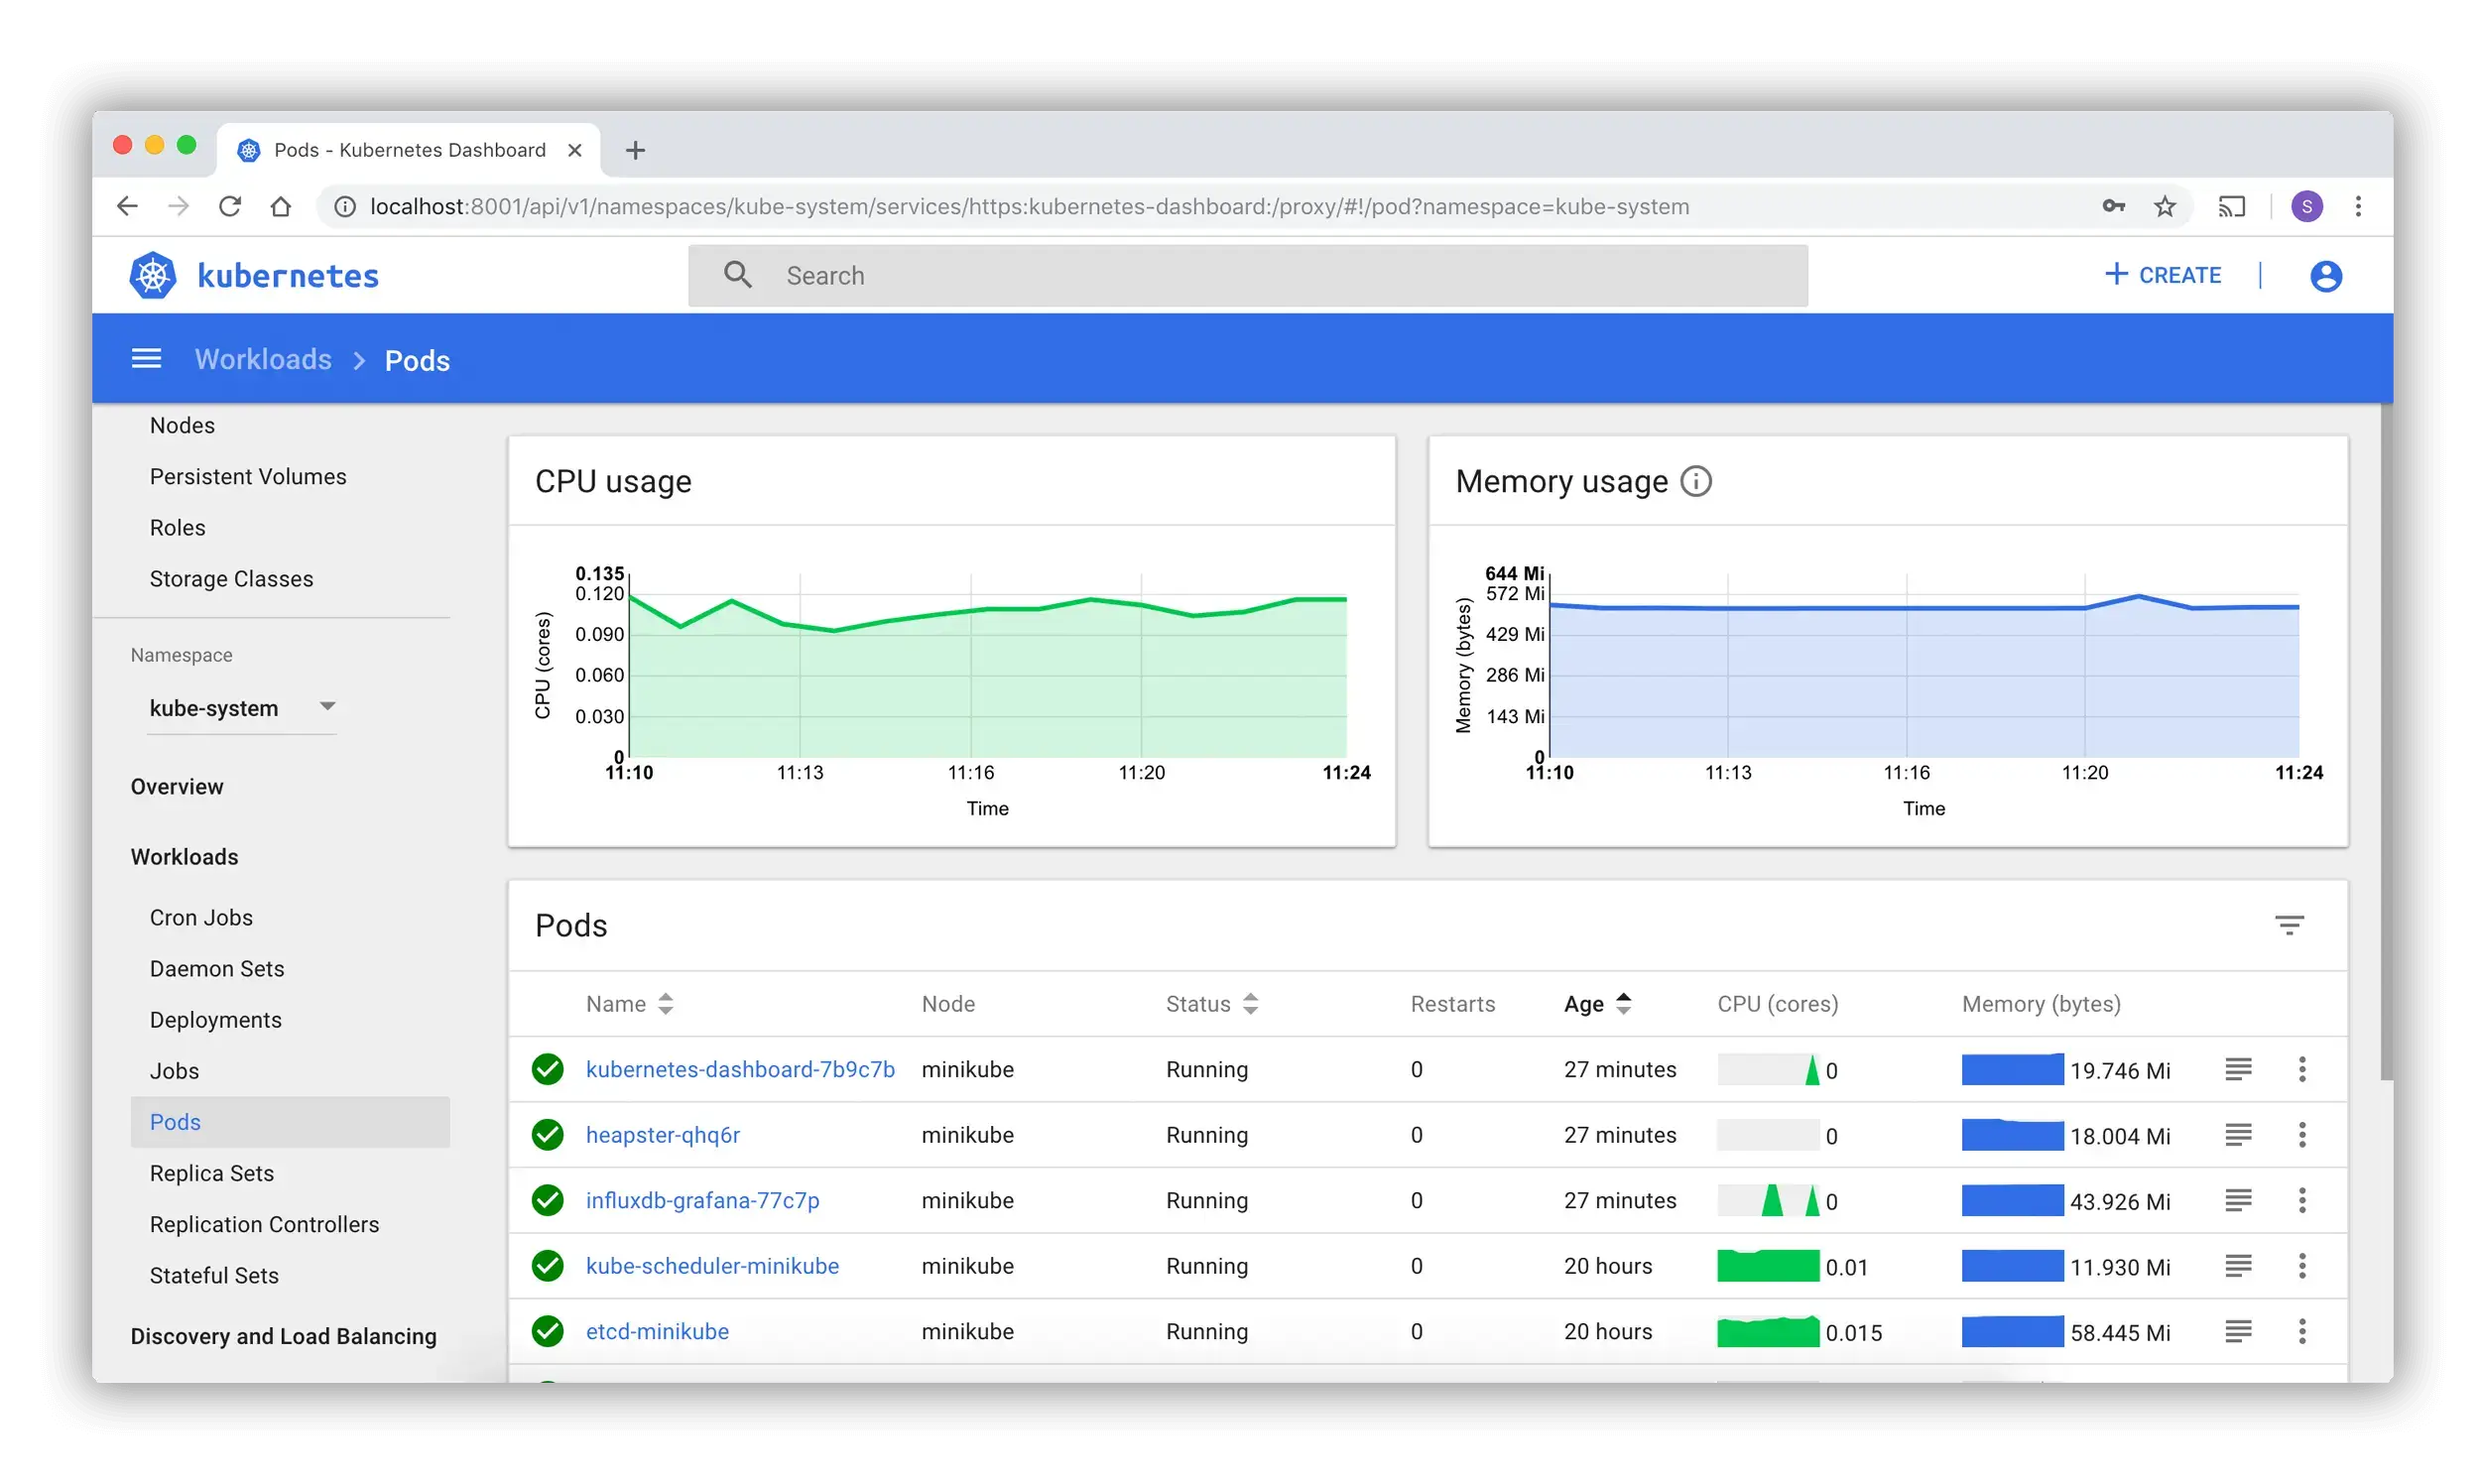
Key Features:
- Container orchestration with automatic scaling and healing
- Service discovery and load balancing for microservices
- Rolling deployments with rollback capabilities
- Resource management with quotas and limits
- Extensibility through operators and custom resources
Why SREs Choose Kubernetes:
Kubernetes automates many operational tasks that would otherwise require manual intervention. Its declarative model aligns with Infrastructure as Code principles. For comprehensive cluster monitoring and observability, see our Kubernetes monitoring with OpenTelemetry guide.
SRE Applications:
- Self-healing systems that automatically restart failed containers
- Canary deployments for reducing change-related incidents
- Resource optimization through horizontal and vertical pod autoscaling
- Multi-tenancy with namespace isolation and resource quotas
Best Use Cases:
- Microservices architectures
- Applications requiring automatic scaling
- Multi-environment deployments
- Teams adopting cloud-native practices
Pricing: Open-source with managed services available from cloud providers
Terraform
Terraform enables Infrastructure as Code (IaC) practices that make infrastructure changes predictable, repeatable, and version-controlled. It supports multiple cloud providers and services.
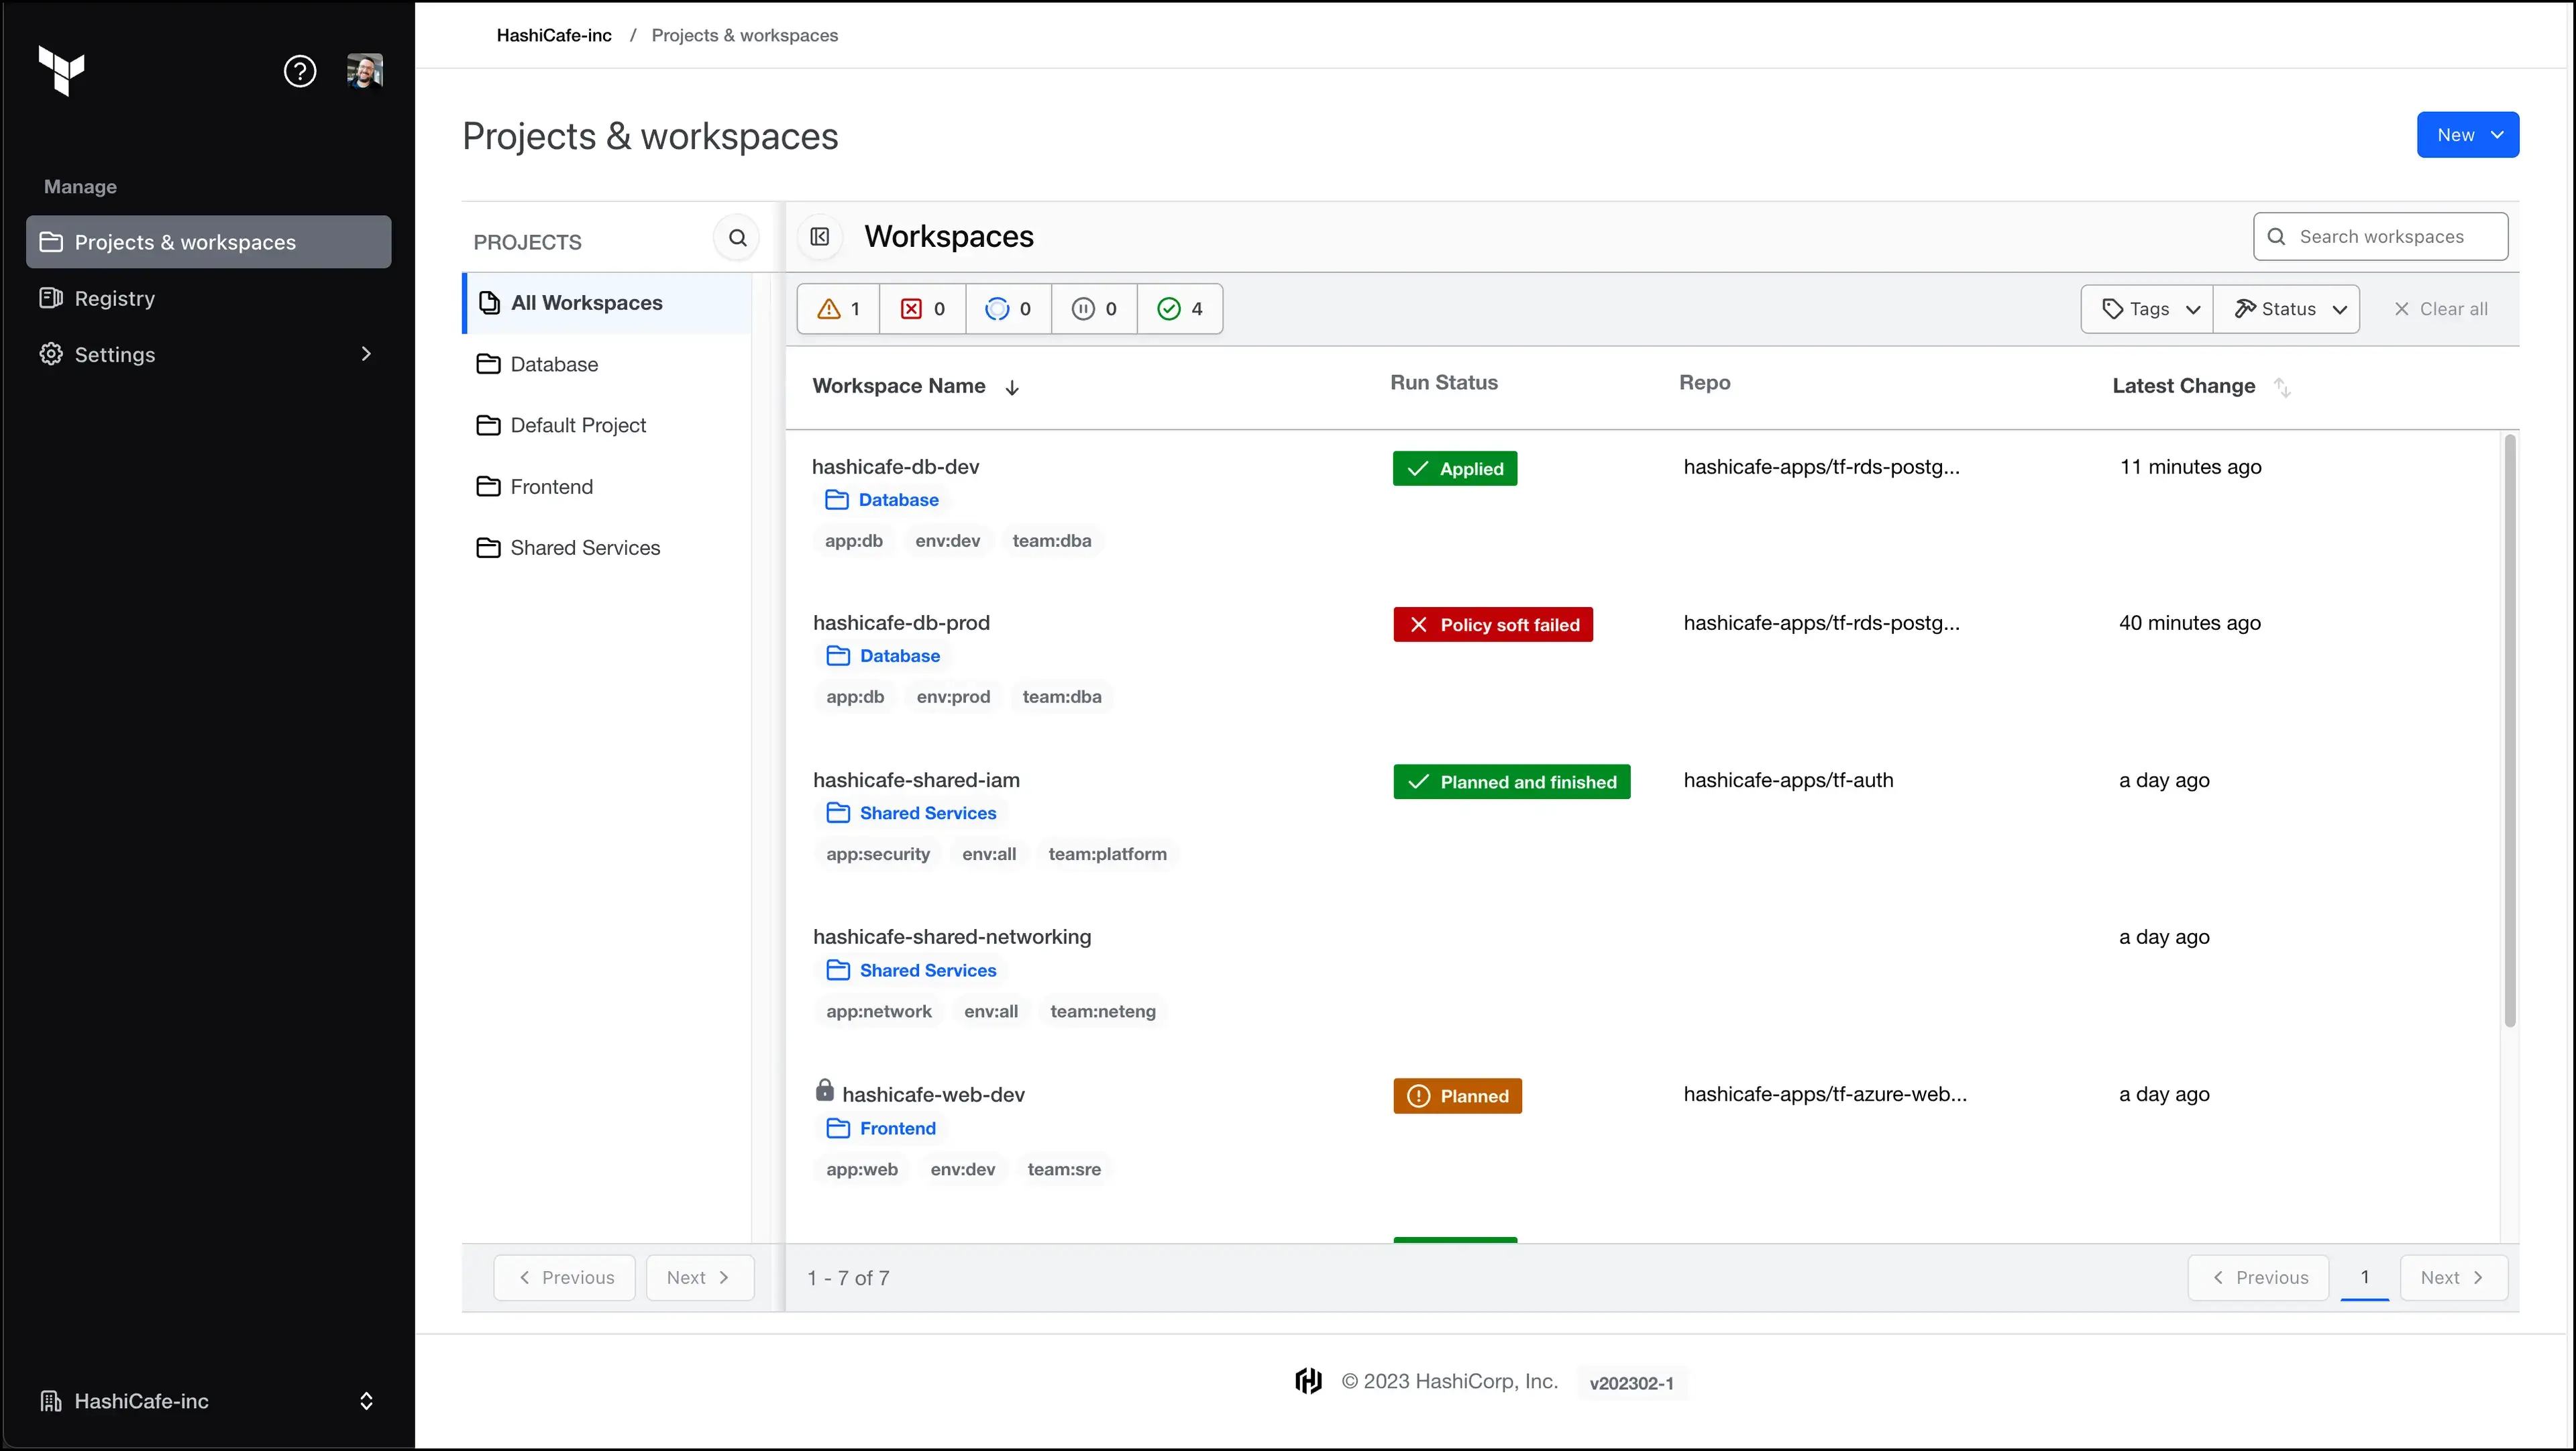
Key Features:
- Declarative configuration defining desired infrastructure state
- Multi-cloud support across AWS, Azure, GCP, and hundreds of providers
- State management tracking actual vs. desired configurations
- Plan and apply workflow for reviewing changes before execution
- Module system for reusable infrastructure components
Why SREs Choose Terraform:
Infrastructure changes are a leading cause of incidents. Terraform reduces risk by making infrastructure modifications predictable and reversible.
SRE Benefits:
Infrastructure changes follow the same review processes as code changes, reducing configuration drift and improving reliability.
Best Use Cases:
- Multi-cloud infrastructure management
- Environment provisioning and tear-down
- Disaster recovery automation
- Infrastructure compliance and standardization
Pricing: Open-source with Terraform Cloud for team collaboration
Datadog
Datadog provides comprehensive monitoring and observability across infrastructure, applications, and logs. Its AI-powered insights help identify issues before they impact users.
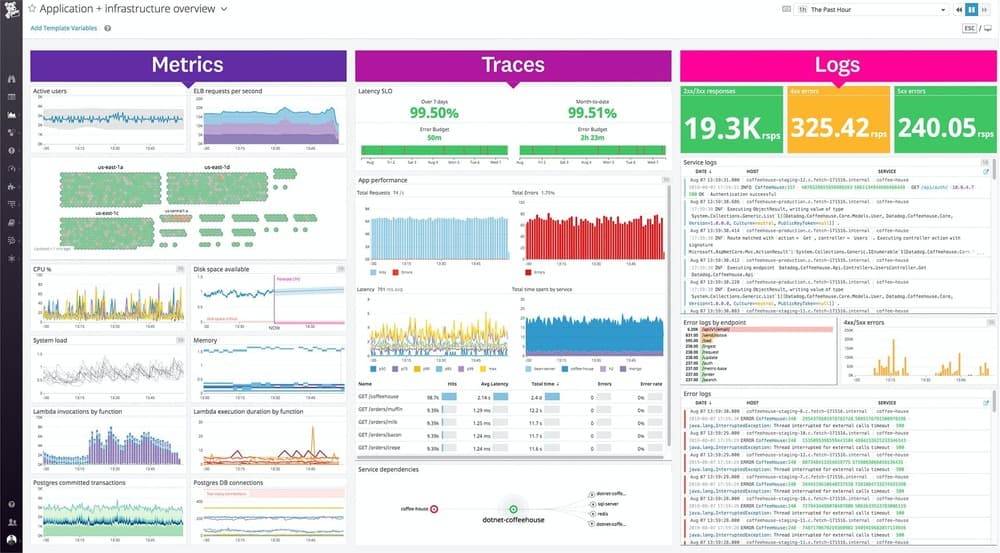
Key Features:
- Full-stack monitoring from infrastructure to application performance
- Log management with parsing, correlation, and search capabilities
- Synthetic monitoring for proactive user experience testing
- Machine learning for anomaly detection and alerting
- Collaboration features including dashboards sharing and incident timelines
Why SREs Choose Datadog:
Datadog's unified platform reduces tool sprawl while providing the comprehensive visibility needed for complex systems. AI-powered features help identify patterns humans might miss.
SRE Applications:
Teams use Datadog for SLI collection, error budget tracking, and automated anomaly detection that feeds into incident response workflows.
Best Use Cases:
- Large-scale distributed systems
- Organizations requiring extensive integrations
- Teams wanting AI-powered insights
- Hybrid and multi-cloud environments
Pricing: Usage-based subscription model
Ansible
Ansible automates configuration management, application deployment, and infrastructure provisioning through simple, readable YAML playbooks.
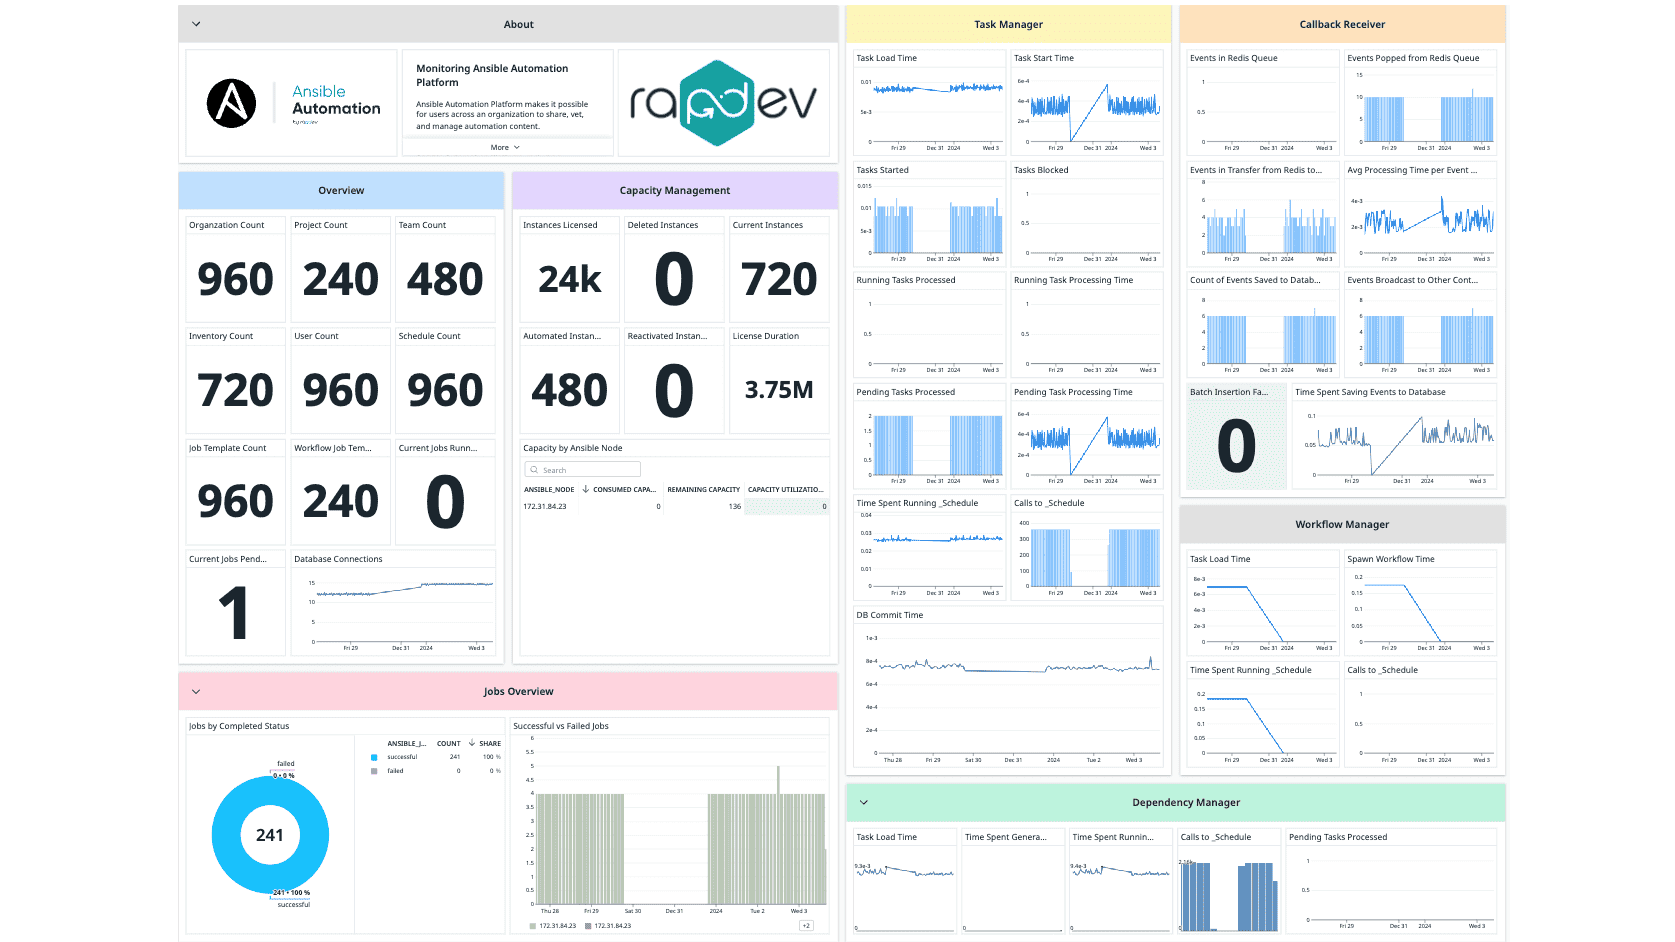
Key Features:
- Agentless architecture using SSH for remote execution
- Idempotent operations ensuring consistent system states
- Inventory management for organizing and grouping systems
- Playbook automation with role-based organization
- Integration ecosystem connecting with cloud providers and tools
Why SREs Choose Ansible:
Ansible reduces configuration drift and automates repetitive operational tasks, allowing SREs to focus on reliability engineering rather than manual system management.
SRE Applications:
- Incident response automation through predefined remediation playbooks
- Compliance enforcement by maintaining consistent configurations
- Deployment automation with rollback capabilities
- Capacity management through automated scaling procedures
Best Use Cases:
- Configuration standardization across environments
- Incident response automation
- Application deployment pipelines
- Compliance and security automation
Pricing: Open-source with Red Hat Ansible Automation Platform for enterprise features
Jaeger
Jaeger provides distributed tracing capabilities essential for understanding request flows through microservices architectures. It helps identify performance bottlenecks and dependencies.
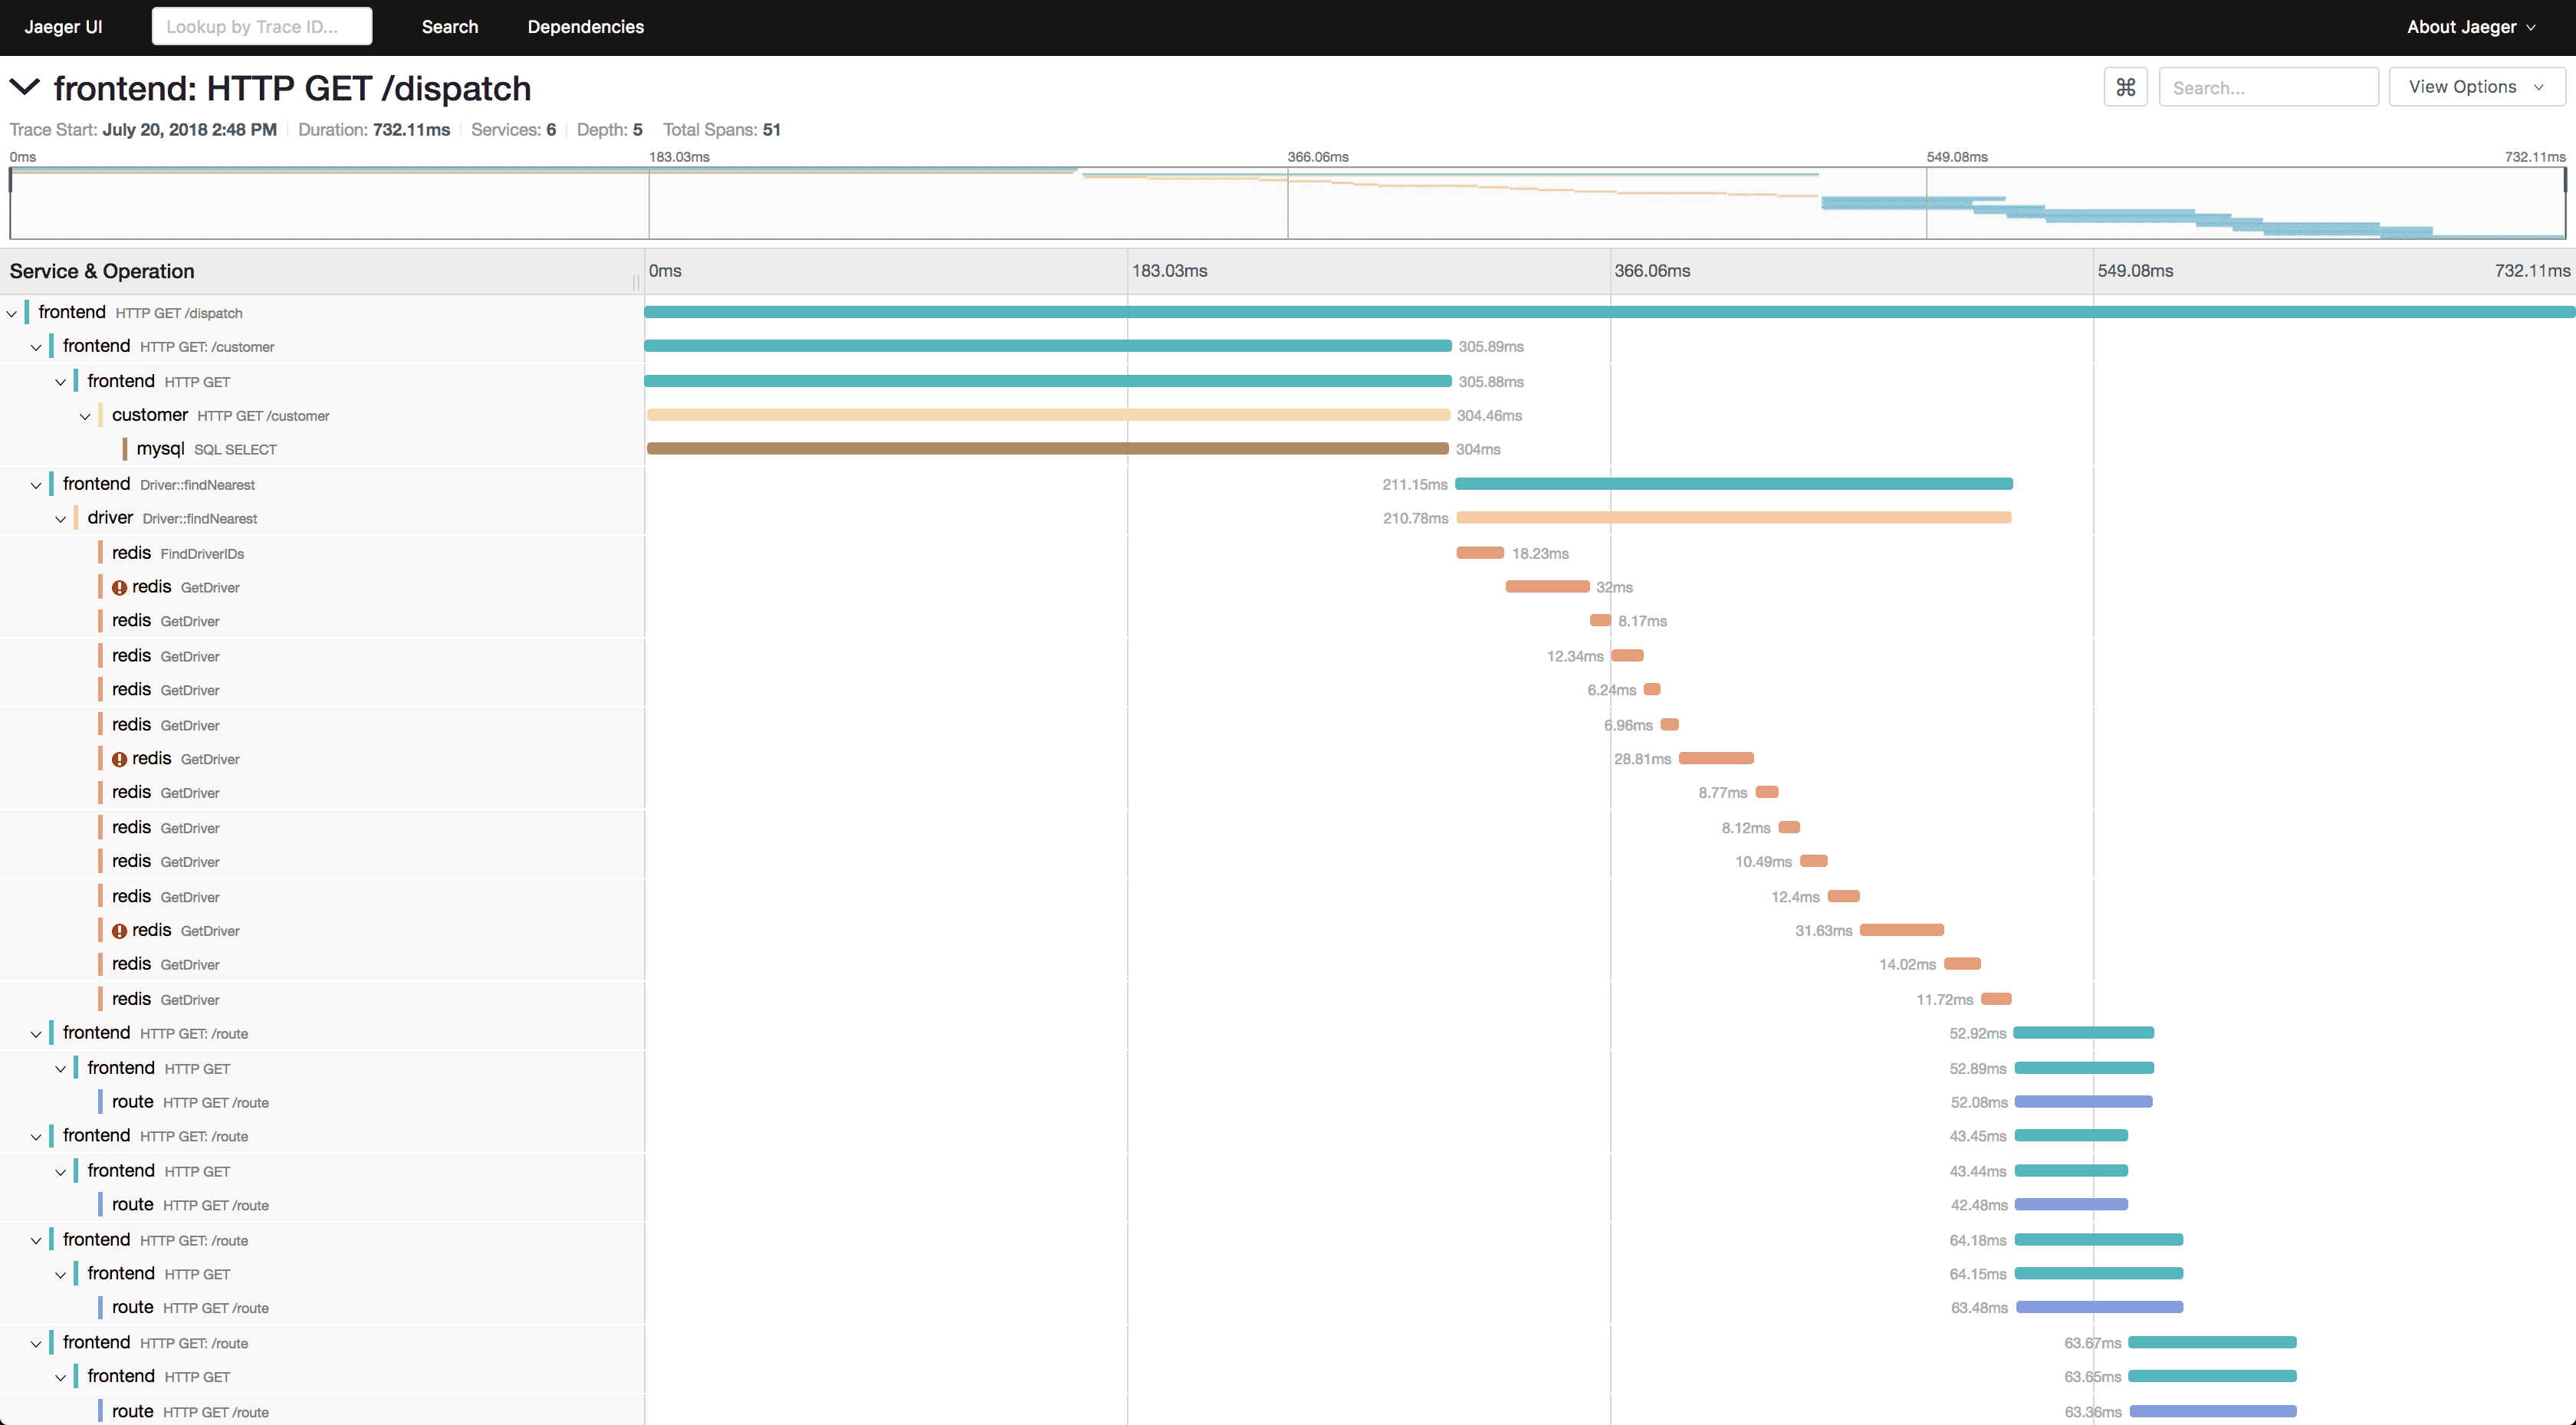
Key Features:
- Distributed tracing with sampling and trace correlation
- Service dependency mapping showing inter-service relationships
- Performance analysis identifying latency hotspots
- Root cause analysis through detailed trace examination
- OpenTelemetry compatibility for vendor-neutral instrumentation
Why SREs Choose Jaeger:
Complex distributed systems make it difficult to understand performance issues and dependencies. Jaeger provides the visibility needed for effective troubleshooting.
SRE Benefits:
Distributed tracing enables faster incident resolution by showing exactly where requests fail or experience latency in multi-service architectures.
Best Use Cases:
- Microservices performance optimization
- Incident investigation and root cause analysis
- Understanding service dependencies
- Latency troubleshooting in distributed systems
Pricing: Open-source with various managed service options
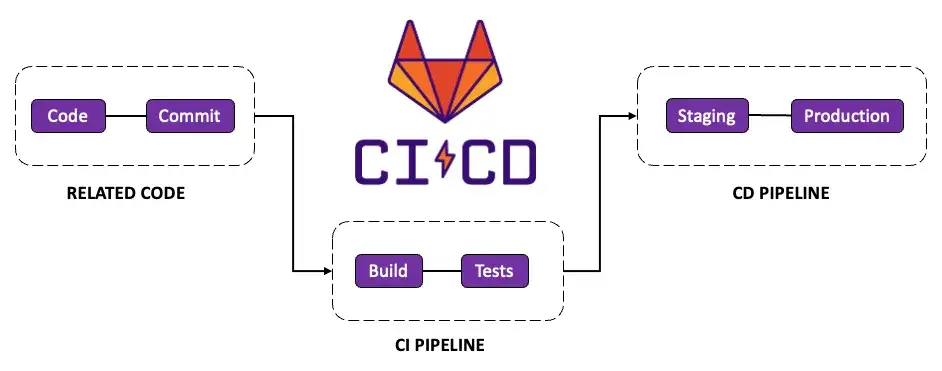
GitLab CI/CD
GitLab provides integrated source control, CI/CD pipelines, and deployment automation in a single platform. It enables reliable, automated software delivery.
Key Features:
- Integrated platform combining version control with CI/CD
- Pipeline automation with parallel execution and dependencies
- Environment management with deployment tracking
- Security scanning built into the development workflow
- Monitoring integration connecting deployments with observability
Why SREs Choose GitLab:
Automated deployment pipelines reduce human error and enable rapid rollbacks when issues occur. Integration with monitoring tools provides deployment visibility.
SRE Applications:
- Automated deployments reducing change-related incidents
- Feature flagging for safe feature rollouts
- Infrastructure as Code pipelines for environment management
- Compliance automation through policy enforcement
Best Use Cases:
- Teams wanting integrated development and operations workflows
- Organizations requiring compliance and audit trails
- Automated testing and deployment pipelines
- Infrastructure automation through GitOps practices
Pricing: Free tier available with paid plans for advanced features
Building Your SRE Toolchain
Effective SRE requires integrating tools across categories rather than using them in isolation:
Start with Observability: Begin with monitoring tools like Prometheus and Grafana to establish visibility into system behavior. Add distributed tracing through Jaeger or comprehensive platforms like Uptrace for deeper insights.
Add Incident Management: Integrate alerting and on-call management through PagerDuty to ensure issues are addressed promptly when SLOs are threatened.
Automate Operations: Use Terraform for infrastructure management and Ansible for configuration automation to reduce manual toil and human error.
Enable Rapid Deployment: Implement CI/CD through GitLab to make deployments predictable and easily reversible.
Scale with Orchestration: Adopt Kubernetes for container management and automatic scaling as system complexity grows.
Tool Selection
Choose SRE tools based on specific requirements:
System Scale: Consider whether tools can handle your current and projected data volumes, request rates, and infrastructure size.
Integration Needs: Evaluate how well tools work together and with your existing infrastructure. Open standards like OpenTelemetry provide better long-term flexibility.
Team Skills: Match tool complexity with your team's capabilities. Some tools require significant expertise to implement effectively.
Cost Structure: Understand pricing models, especially for usage-based tools that can scale unexpectedly with system growth.
Vendor Independence: Consider open-source alternatives and avoid excessive dependence on single vendors for critical functions.
Conclusion
The right SRE toolchain enables teams to implement reliability engineering practices effectively. While specific tool choices depend on organizational needs, successful SRE requires capabilities across monitoring, incident management, automation, and collaboration.
Start with observability foundations using tools like Prometheus and Grafana, then expand into incident management with PagerDuty and automation through Terraform and Ansible. For comprehensive observability with OpenTelemetry standards, consider platforms like Uptrace OpenTelemetry APM that unify monitoring, tracing, and logging needs.
The key is building an integrated toolchain that supports SRE principles while avoiding excessive complexity. Focus on tools that enable automation, provide actionable insights, and scale with your organization's growth.
You may also be interested in: