7 Rails Monitoring Tools: APM, Performance & Error Tracking
Rails applications need monitoring for database query performance, request latency, memory leaks, and background job failures. Commercial APM tools range from $20-500/month depending on volume and features. Open-source alternatives like Uptrace provide full observability at zero licensing cost.
This comparison covers 7 monitoring solutions used in production Rails environments. For implementation details, see the OpenTelemetry Rails guide.
Quick Comparison
| Tool | Type | Monthly Cost | ActiveRecord | Error Tracking | OpenTelemetry |
|---|---|---|---|---|---|
| Uptrace | Open-Source | Free (self-hosted) | ✅ | ✅ | Native |
| Scout APM | Commercial | From $19/month | ✅ | ✅ | ❌ |
| AppSignal | Commercial | From $23/month | ✅ | ✅ | ❌ |
| New Relic | Commercial | From $99/user | ✅ | ✅ | Partial |
| Datadog | Commercial | $46/host (min) | ✅ | ✅ | Partial |
| Skylight | Commercial | From $20/month | ✅ | ❌ | ❌ |
| SolarWinds | Commercial | From $10/host | ✅ | ✅ | ❌ |
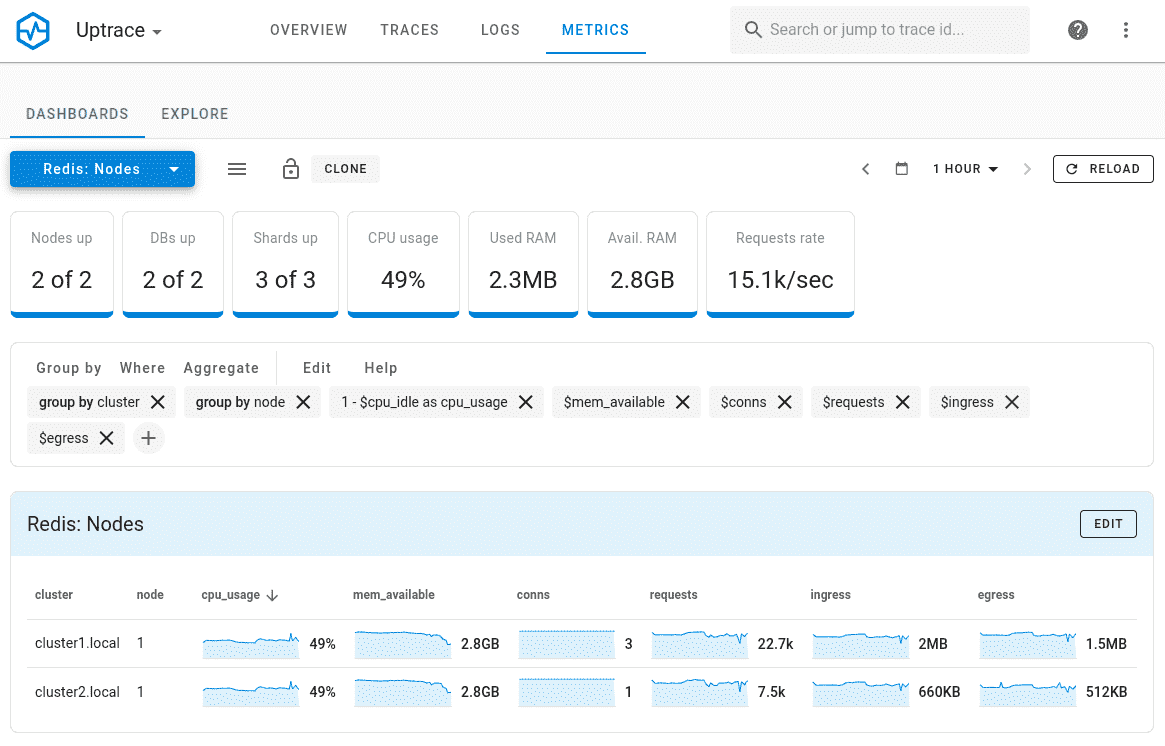
Uptrace
License: AGPL v3 / Commercial
GitHub: https://github.com/uptrace/uptrace
Uptrace is an OpenTelemetry-native APM that collects traces, metrics, and logs from Rails applications. It uses the standard opentelemetry-ruby SDK, so data stays portable if you switch backends.
Key Features:
- ActiveRecord query analysis with N+1 detection
- Request waterfall showing controller → model → database timing
- Background job monitoring (Sidekiq, Resque)
- Error correlation with traces
- Self-hosted or cloud deployment
Setup:
gem install uptrace
gem install opentelemetry-instrumentation-all
# config/initializers/opentelemetry.rb
require 'uptrace'

Uptrace.configure_opentelemetry(dsn: ENV['UPTRACE_DSN']) do |c|
  c.service_name = 'rails-app'
  c.use_all # Auto-instruments Rails, ActiveRecord, Sidekiq
end
Pricing:
- Self-hosted: Free (unlimited data, no restrictions)
- Cloud: $99/month for 5GB traces
Pros:
- Zero vendor lock-in (uses OpenTelemetry)
- ActiveRecord instrumentation captures slow queries automatically
- SQL query parameter binding visible in traces
- Open-source (can audit code, submit PRs)
Cons:
- Self-hosting requires ClickHouse setup
- UI learning curve for complex queries
Best for: Teams wanting data ownership or avoiding per-server pricing.
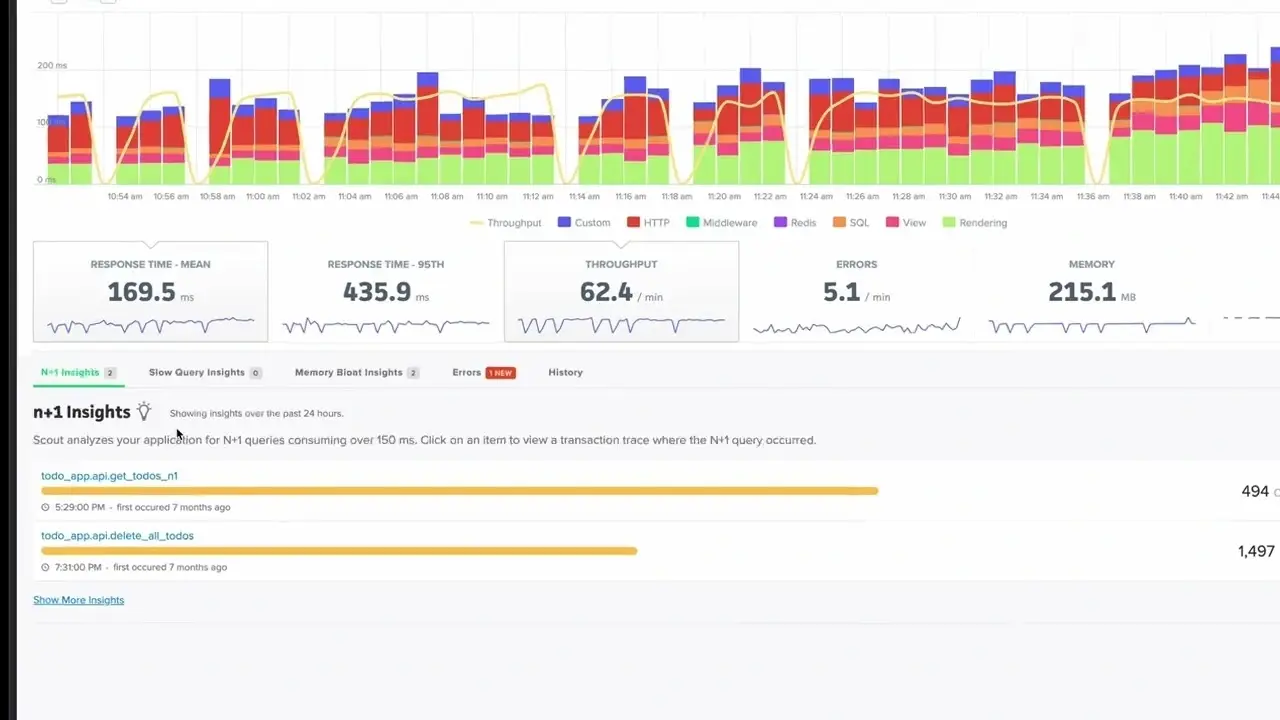
Scout APM
Website: https://scoutapm.com
Scout APM focuses exclusively on Rails performance monitoring. It detects N+1 queries, memory bloat, and slow endpoints without requiring code changes.
Key Features:
- Automatic N+1 query detection
- Memory bloat analysis per endpoint
- Git integration (shows which commit caused slowdown)
- Anomaly detection for latency spikes
- DevTrace for local development profiling
Setup:
# Gemfile
gem 'scout_apm'
# config/scout_apm.yml
production:
  key: <%= ENV['SCOUT_KEY'] %>
  monitor: true
Pricing:
- Transaction-based pricing (not per-server)
- Starts at $19/month for lower volume
- Higher tiers for increased transaction volume
- 14-day free trial
Pros:
- Rails-specific optimizations (understands ActiveRecord patterns)
- DevTrace works locally without sending data to Scout
- Auto-instruments Sidekiq and Resque
- Low overhead (~1ms per request)
Cons:
- Ruby/Rails only (no polyglot support)
- Closed-source (can't self-host)
- Pricing scales with transaction volume
Best for: Rails-only shops wanting minimal configuration.
AppSignal
Website: https://appsignal.com
AppSignal combines APM, error tracking, and host metrics in a single interface. It includes anomaly detection and custom dashboards for business metrics.
Key Features:
- Magic Dashboard (auto-generates metrics from ActiveRecord models)
- Anomaly detection (ML-based alerts)
- Host metrics (CPU, memory, disk) alongside APM data
- Incident management (groups related errors)
- StroopWafel (distributed tracing for microservices)
Setup:
gem install appsignal
appsignal install YOUR_PUSH_API_KEY
Pricing:
- Starts at $23/month for 10M requests + unlimited hosts
- $59/month for higher volume
- $139/month for 100M+ requests
- 30-day free trial, no credit card required
Pros:
- Request-based pricing (not per-host)
- Magic Dashboard generates graphs without configuration
- Integrates host metrics + APM + errors in one UI
- EU-based (GDPR compliant by default)
Cons:
- Limited trace retention (30 days max)
- No OpenTelemetry support
- Extra cost for distributed tracing
Best for: European teams needing GDPR compliance or request-based pricing.
New Relic
Website: https://newrelic.com
New Relic provides full-stack observability including browser monitoring, mobile app tracking, and infrastructure metrics. The Ruby agent auto-instruments Rails.
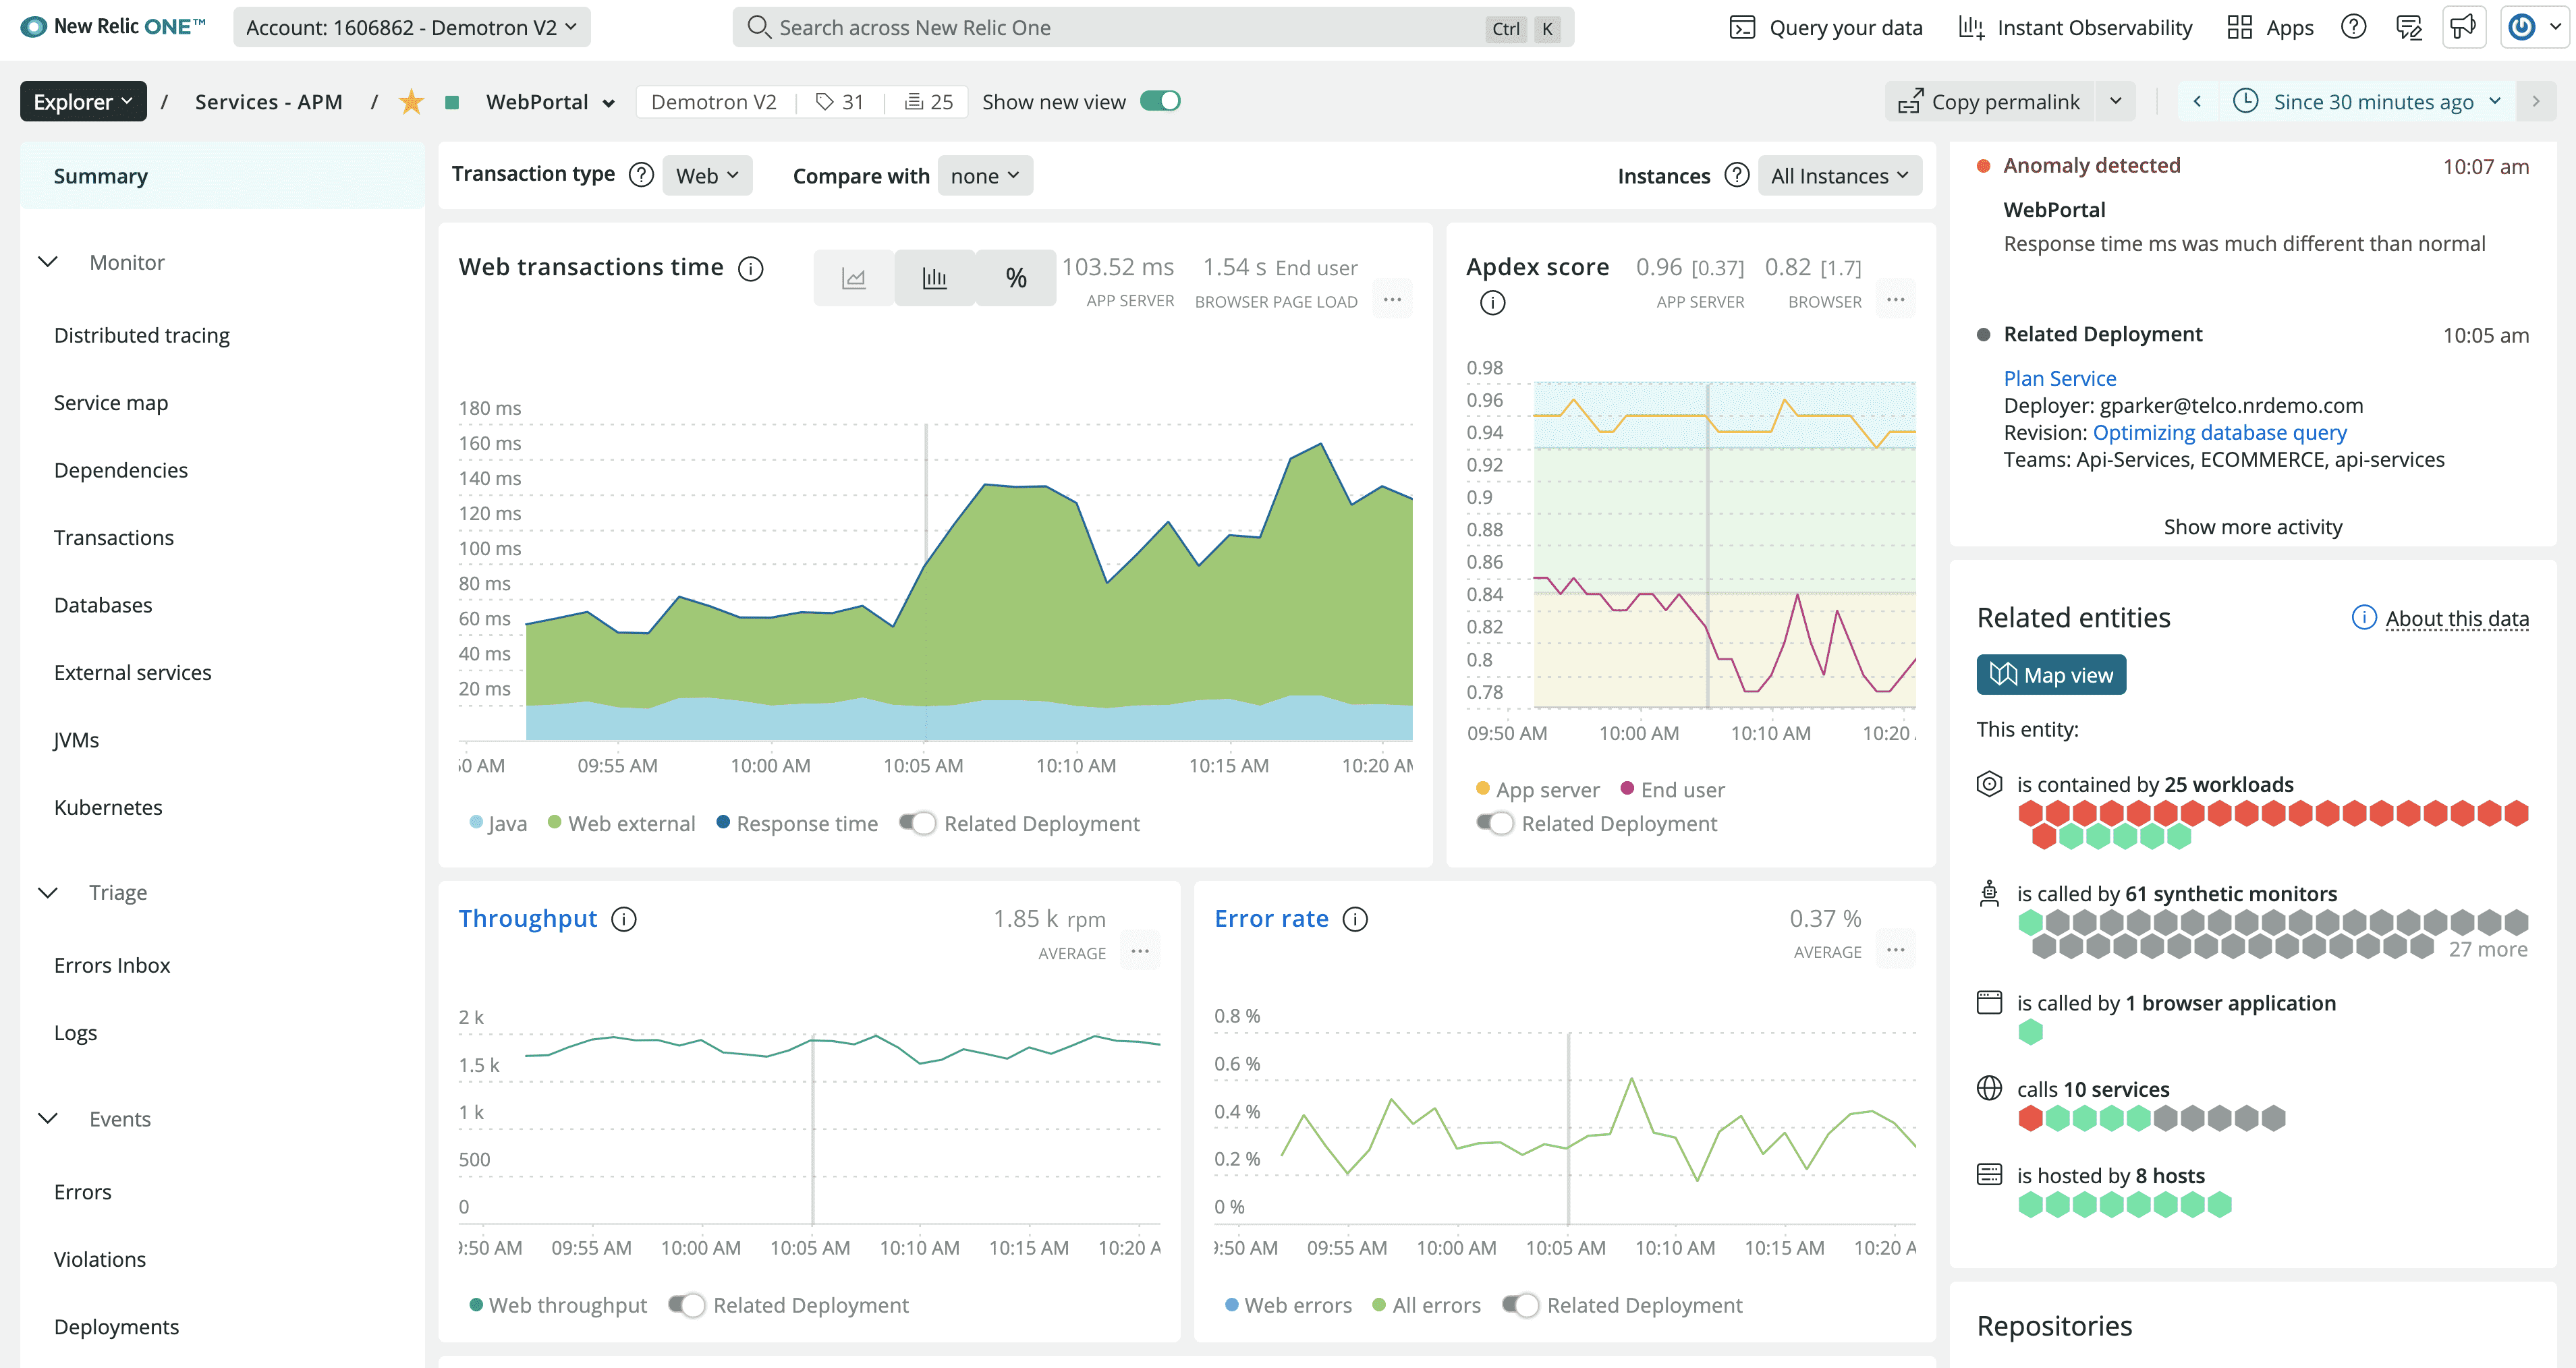
Key Features:
- Real User Monitoring (RUM) for frontend performance
- Distributed tracing across services
- Custom dashboards with NRQL query language
- Deployment markers (correlates deploys with performance changes)
- Alert policies with anomaly detection
Setup:
# Gemfile
gem 'newrelic_rpm'
# config/newrelic.yml
production:
  license_key: <%= ENV['NEW_RELIC_LICENSE_KEY'] %>
  app_name: My Rails App
Pricing:
- Standard: First user $10, additional users $99 each (max 5 users)
- Pro: $349/user/month (annual) or $419/user (monthly)
- 100GB free data ingest, $0.40/GB beyond free tier
- One full platform user free forever
Pros:
- Full-stack (backend + frontend + mobile)
- Powerful NRQL query language
- Integrates with 600+ technologies
- Strong APM features (transaction traces, SQL analysis)
Cons:
- Complex pricing (user-based + data-based)
- UI overload (too many features for small teams)
- Per-user pricing expensive for large teams
Best for: Large organizations needing full-stack observability.
Datadog
Website: https://datadoghq.com
Datadog combines infrastructure monitoring, APM, and log management. The Ruby tracer instruments Rails automatically.
Key Features:
- Unified metrics, traces, and logs
- Live tail for log streaming
- Watchdog (AI-powered anomaly detection)
- Security monitoring (tracks vulnerabilities)
- Network performance monitoring
Setup:
# Gemfile
gem 'ddtrace'
# config/initializers/datadog.rb
Datadog.configure do |c|
  c.service = 'rails-app'
  c.env = Rails.env
  c.tracing.instrument :rails
  c.tracing.instrument :active_record
end
Pricing:
- Infrastructure Pro: $15/host/month (required for APM)
- APM: $31/host/month additional (ingests 150GB traces)
- Minimum cost: $46/host/month (Infrastructure + APM)
- Logs: $0.10/GB ingested (separate)
Pros:
- Single platform for infra + APM + logs + security
- Strong Kubernetes integration
- Watchdog AI detects anomalies automatically
- 500+ integrations
Cons:
- Expensive at scale (per-host pricing)
- Traces limited to 15 days retention
- Complex billing (multiple products)
Best for: Infrastructure-heavy teams already using Datadog for servers.
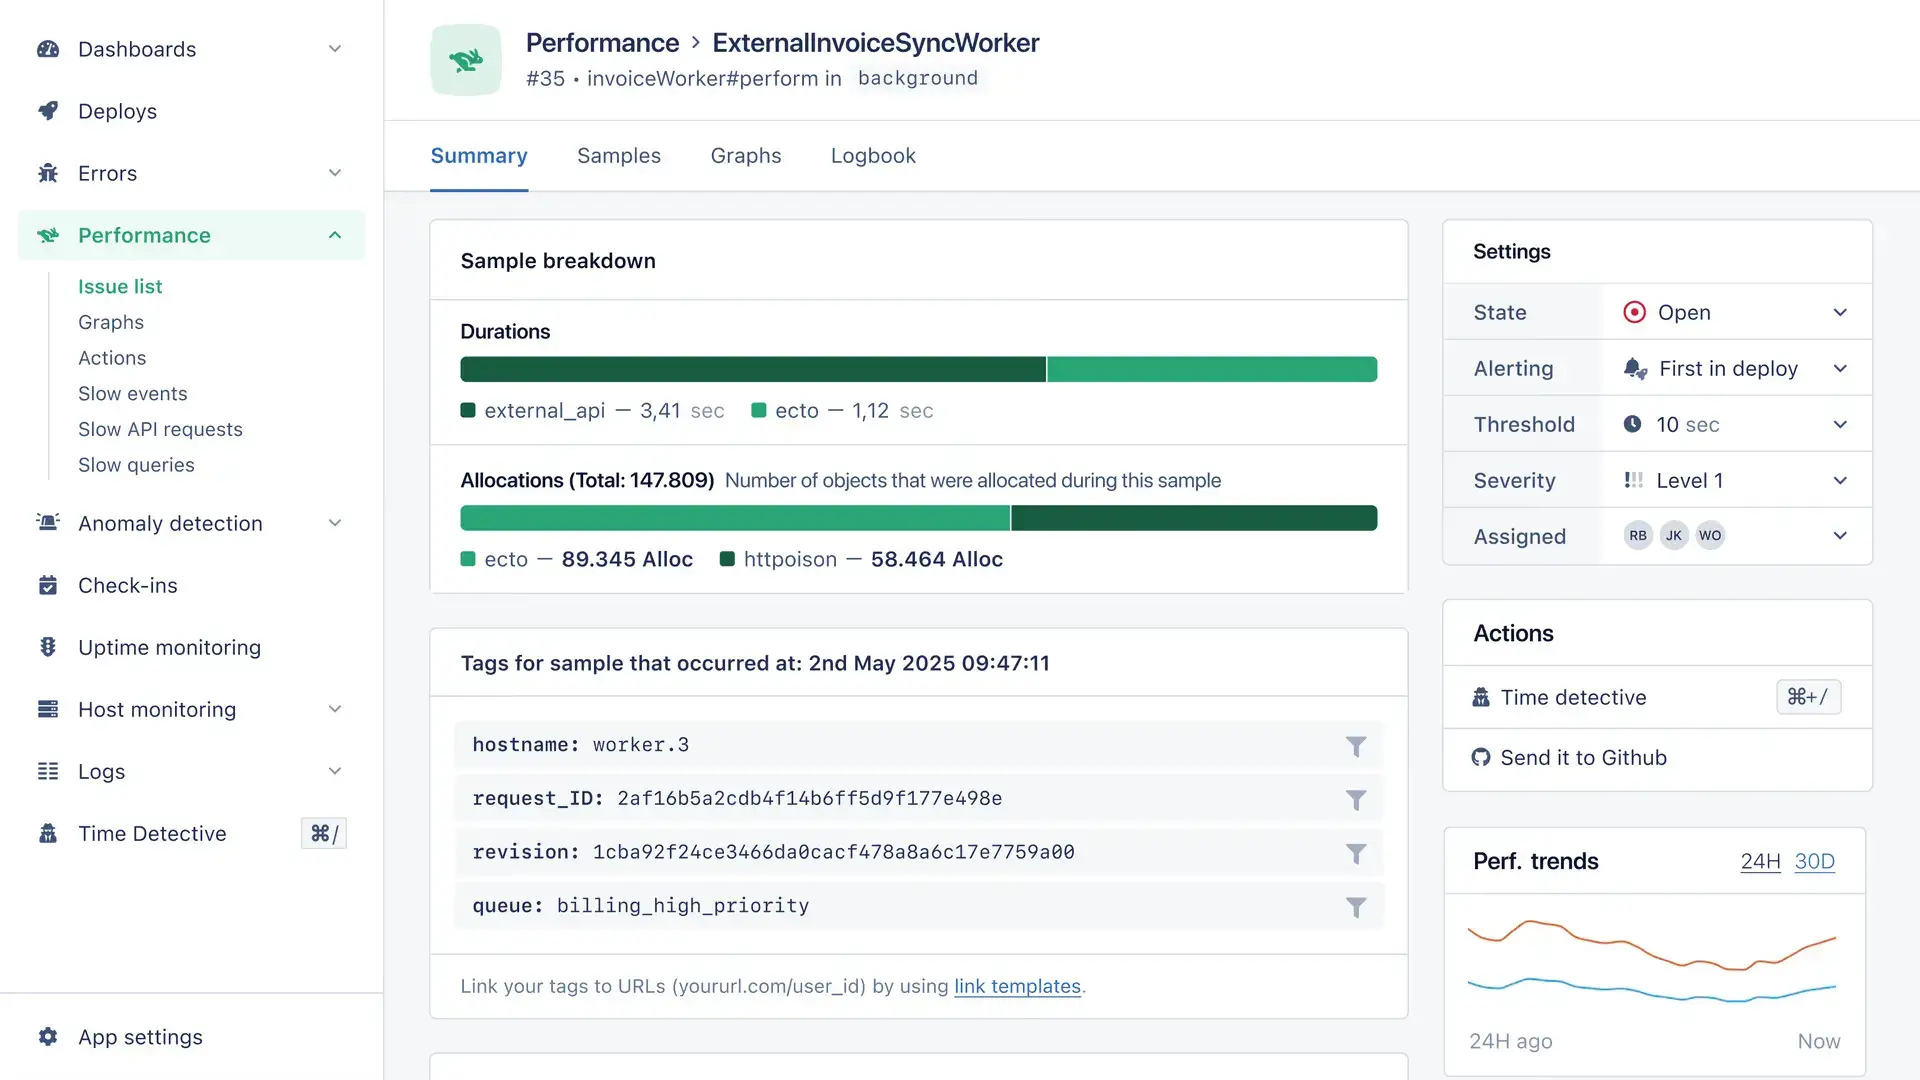
Skylight
Website: https://skylight.io
Skylight focuses on Rails performance optimization. It shows time spent in views vs. database queries and highlights allocation hotspots.
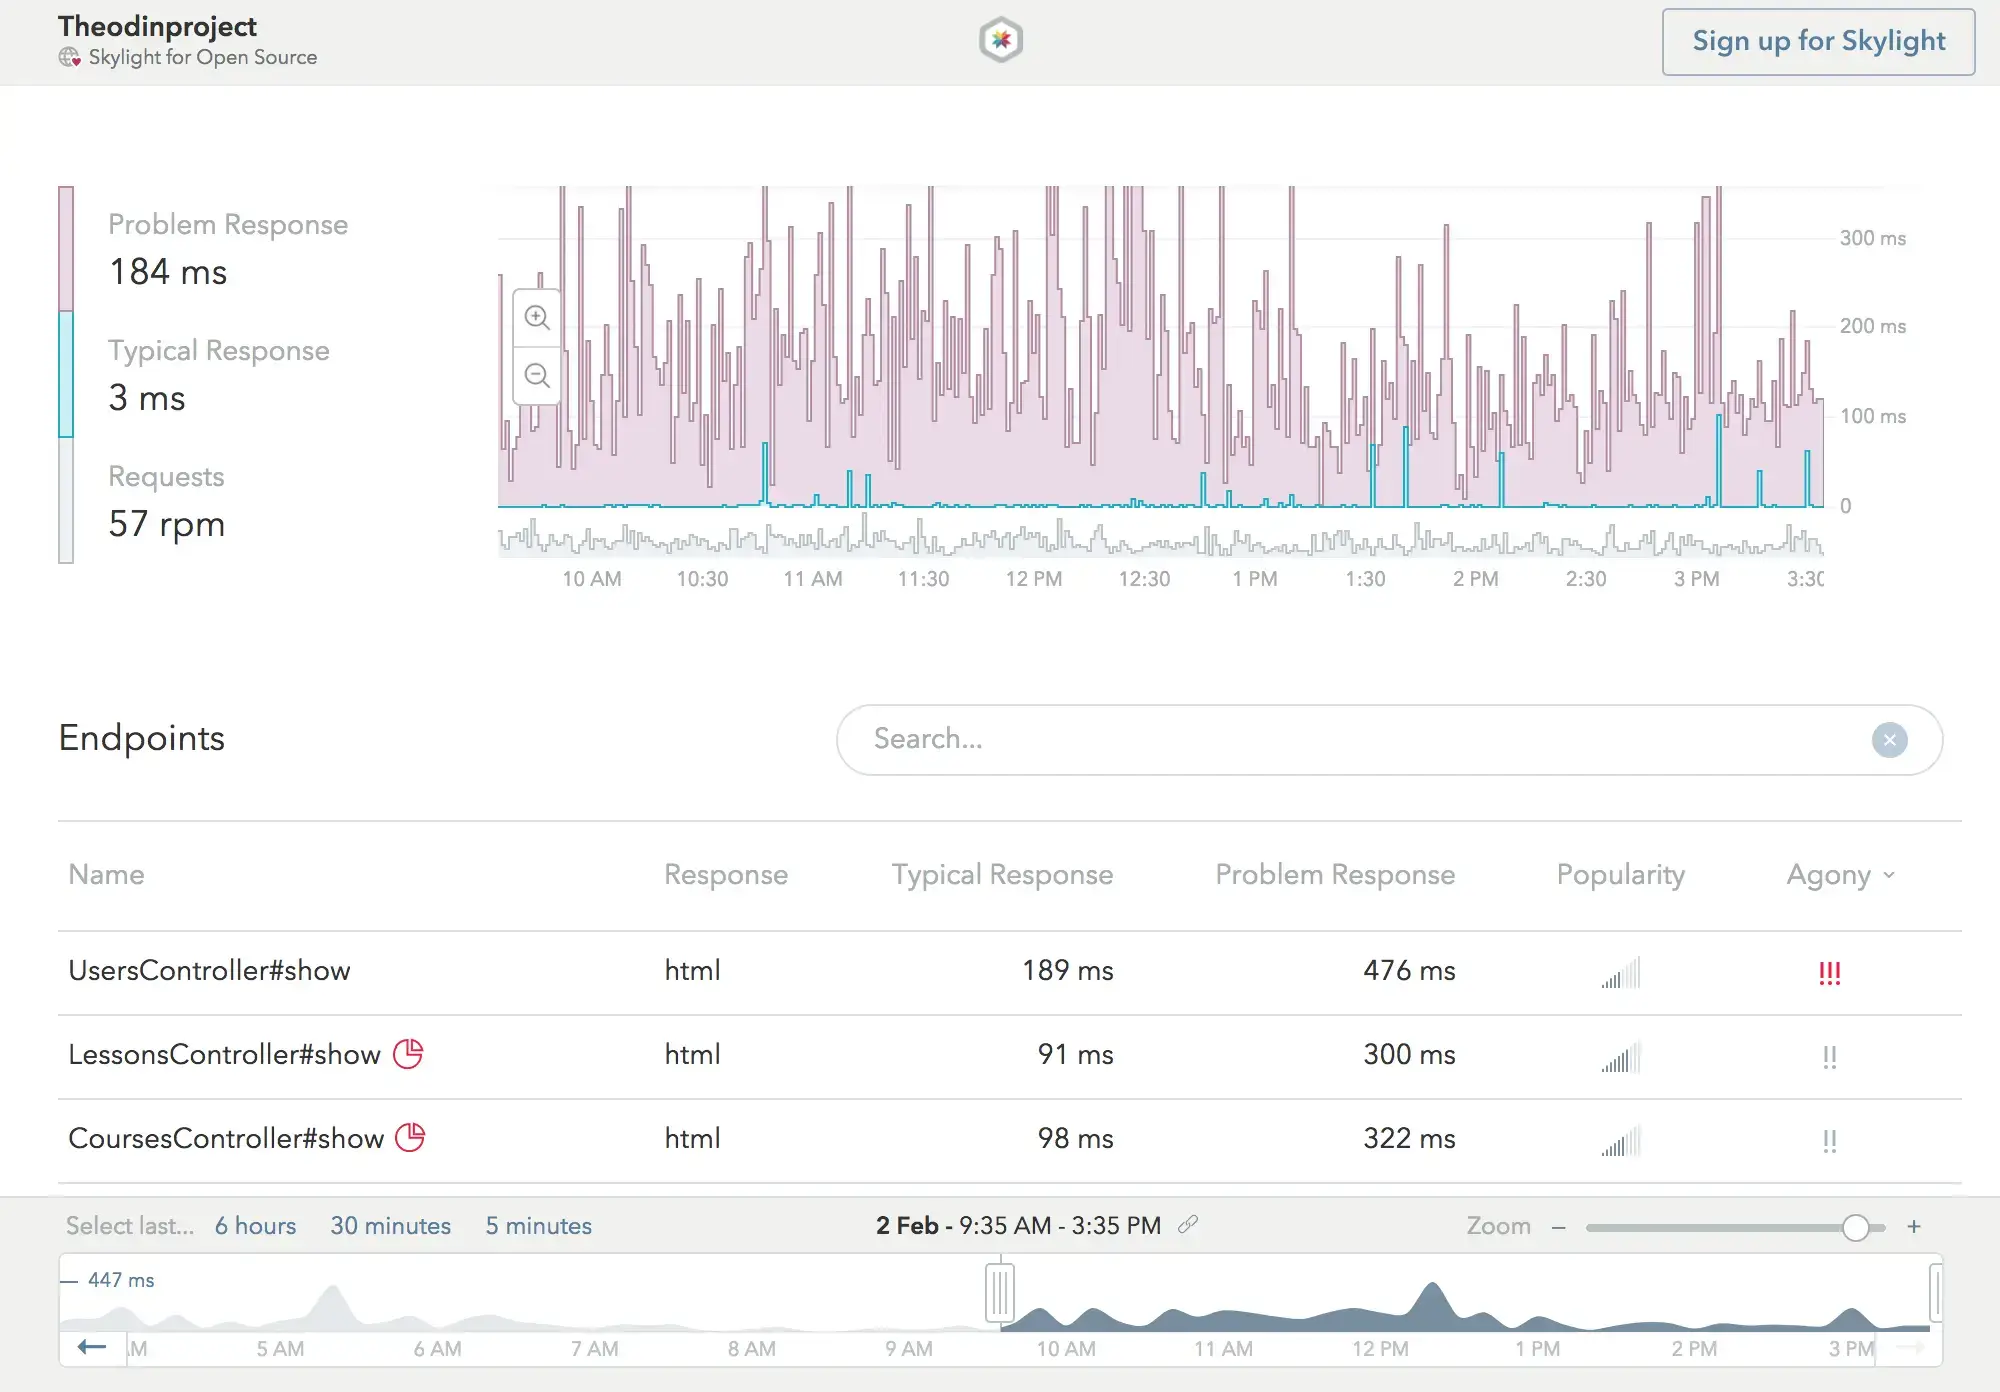
Key Features:
- Endpoint breakdown (view vs. database vs. serialization)
- Allocation tracking (finds memory-hungry code)
- Problem detection (N+1, repeated queries)
- Response time histogram
- GitHub commit links
Setup:
# Gemfile
gem 'skylight'
# config/skylight.yml
authentication: <%= ENV['SKYLIGHT_AUTHENTICATION'] %>
Pricing:
- Free: 100K traces/month
- Starts at $20/month for additional volume
- Custom pricing for high-volume applications
- Free for open-source projects
Pros:
- Rails-specific (understands ERB rendering, ActiveRecord)
- Allocation tracking helps fix memory issues
- Simple pricing (request-based)
- Low overhead
Cons:
- No error tracking
- No distributed tracing
- Rails only (no other languages)
Best for: Rails developers optimizing single-app performance.
SolarWinds (AppOptics)
Website: https://www.solarwinds.com/solarwinds-observability
SolarWinds AppOptics combines APM with infrastructure monitoring. It supports Ruby, Python, Node.js, and Java.
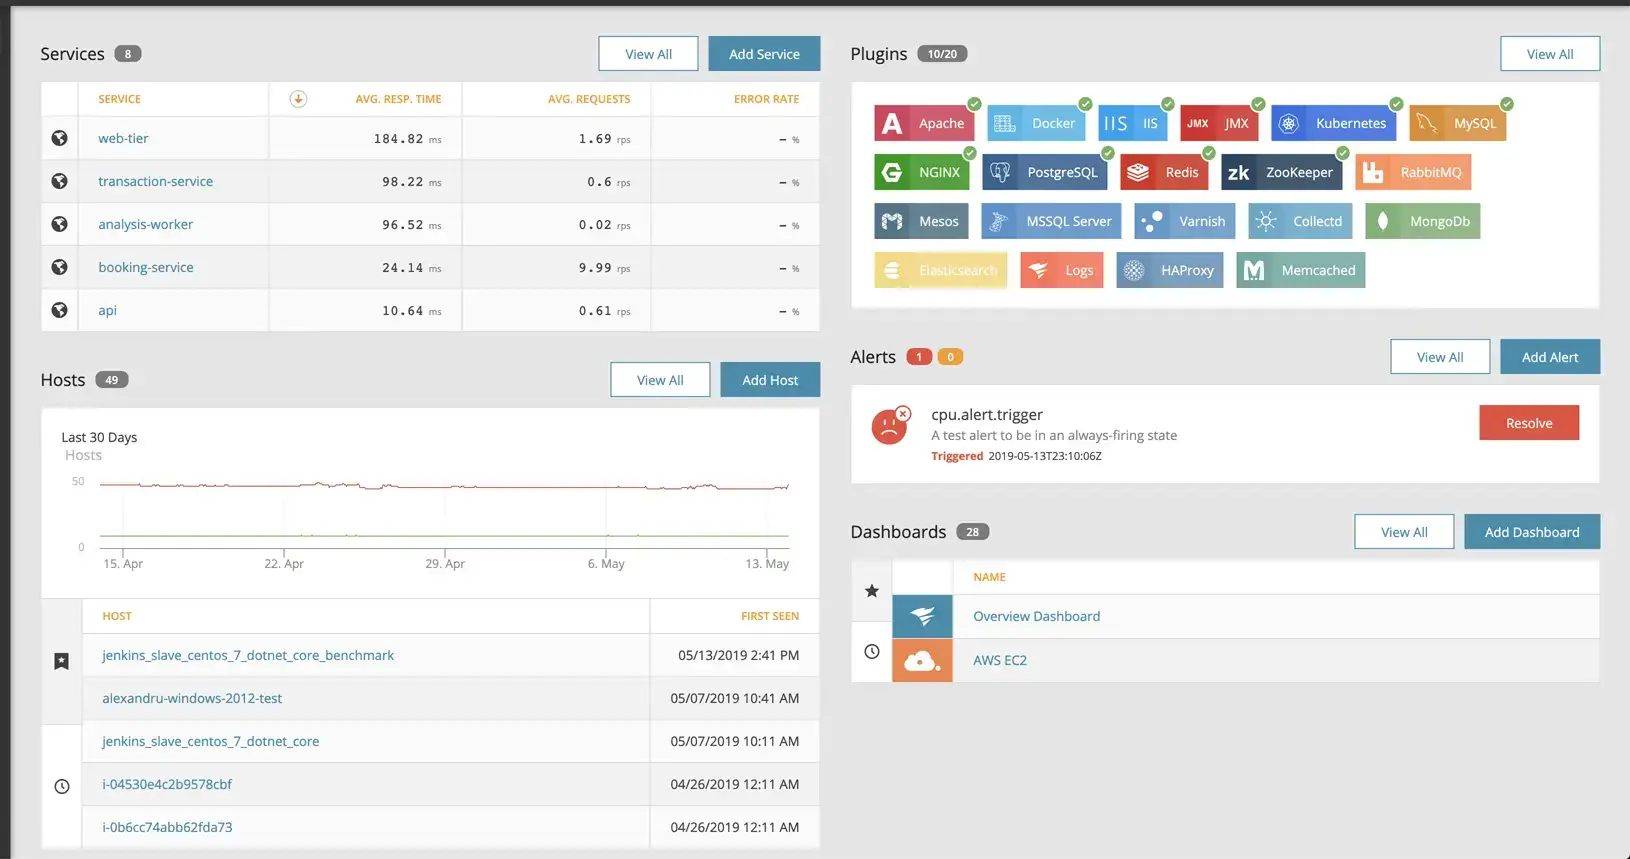
Key Features:
- Custom metrics API
- Trace correlation with infrastructure
- Anomaly detection
- Integrations with AWS, Azure, GCP
- Custom dashboards
Setup:
# Gemfile
gem 'appoptics_apm'
# config/initializers/appoptics.rb
AppOpticsAPM::Config[:tracing_mode] = ENV['APPOPTICS_TRACING_MODE']
AppOpticsAPM::Config[:service_key] = ENV['APPOPTICS_SERVICE_KEY']
Pricing:
- Starts at ~$10/host/month
- Custom pricing for enterprise (contact sales)
Pros:
- Infrastructure + APM in one platform
- Works across multiple languages
- Custom metrics API
Cons:
- Unclear pricing (must contact sales)
- Less Rails-specific than Scout/Skylight
- UI feels dated
Best for: Teams already using SolarWinds for infrastructure.
Which Rails Monitoring Tool Should You Choose?
For cost-conscious teams: Uptrace (free self-hosted) or AppSignal ($23/month unlimited hosts)
For Rails-only shops: Scout APM (starts $19/month) or Skylight (starts $20/month)
For full-stack observability: New Relic (from $99/user) or Datadog ($46/host minimum)
For GDPR compliance: AppSignal (EU-based, though priced in USD)
For avoiding vendor lock-in: Uptrace (OpenTelemetry-native)
FAQ
- What is the best Rails monitoring tool?
Depends on budget and requirements:
- Free/Open-Source: Uptrace with self-hosting
- Rails-specific: Scout APM or Skylight
- Enterprise: New Relic or Datadog
Uptrace provides the best value (free + no vendor lock-in) for teams comfortable with self-hosting.
- How much does Rails monitoring cost?
- Open-source (Uptrace): $0 (self-hosted) or $99/month cloud
- Rails-focused tools: $19-$139/month (Scout, Skylight, AppSignal)
- Enterprise APM: $99-$500+/month (New Relic, Datadog)
Per-host pricing (Datadog, SolarWinds) gets expensive with multiple servers. Request-based pricing (AppSignal, Skylight, Scout) scales better for high-traffic apps.
- How to monitor ActiveRecord query performance?
All tools auto-instrument ActiveRecord. Key metrics to track:
- Query execution time (per query)
- N+1 query detection
- Slow query log (> 100ms)
- Connection pool usage
Scout APM and Skylight specialize in ActiveRecord optimization. Uptrace shows full SQL with parameter binding.
- What is the performance impact of Rails monitoring?
Negligible:
- Scout APM: ~1ms per request
- AppSignal: < 1% overhead
- Uptrace/OpenTelemetry: ~2ms per request
Production impact is minimal with proper sampling (sample 1-10% of traces in high-traffic apps).
- Do I need separate error tracking with APM?
Most modern APM tools include error tracking (Scout, AppSignal, New Relic, Datadog, Uptrace). Separate services like Sentry or Rollbar are only needed if your APM doesn't track errors.
Uptrace, Scout, and AppSignal correlate errors with traces, showing exactly what code path triggered exceptions.
Related Tools
- Node.js monitoring tools
- PostgreSQL monitoring tools (for ActiveRecord query optimization)
- Top APM tools (cross-language comparison)