6 Free & Open-Source Node.js Monitoring Tools
Node.js applications require specialized monitoring to track event loop performance, memory usage, and asynchronous operations.For a comprehensive overview of Node.js monitoring strategies, see our Node.js performance monitoring guide. Open-source monitoring tools provide production-grade observability without vendor lock-in or recurring costs. This guide compares the best free and open-source Node.js monitoring tools.
Why Use Open-Source Node.js Monitoring Tools?
Commercial APM solutions like Datadog and New Relic can cost $15-50 per host monthly. For startups and small teams, these costs add up quickly. Open-source tools deliver enterprise features—distributed tracing, metrics collection, real-time alerts—without licensing fees.
Open-source Node.js monitoring tools also offer:
- Full control over data (no third-party data retention)
- Customizable instrumentation for specific use cases
- Vendor neutrality (no lock-in)
- Active communities and extensive documentation
6 Best Open-Source Node.js Monitoring Tools
Uptrace
License: AGPL v3 (Open Source) / Commercial
GitHub: https://github.com/uptrace/uptrace
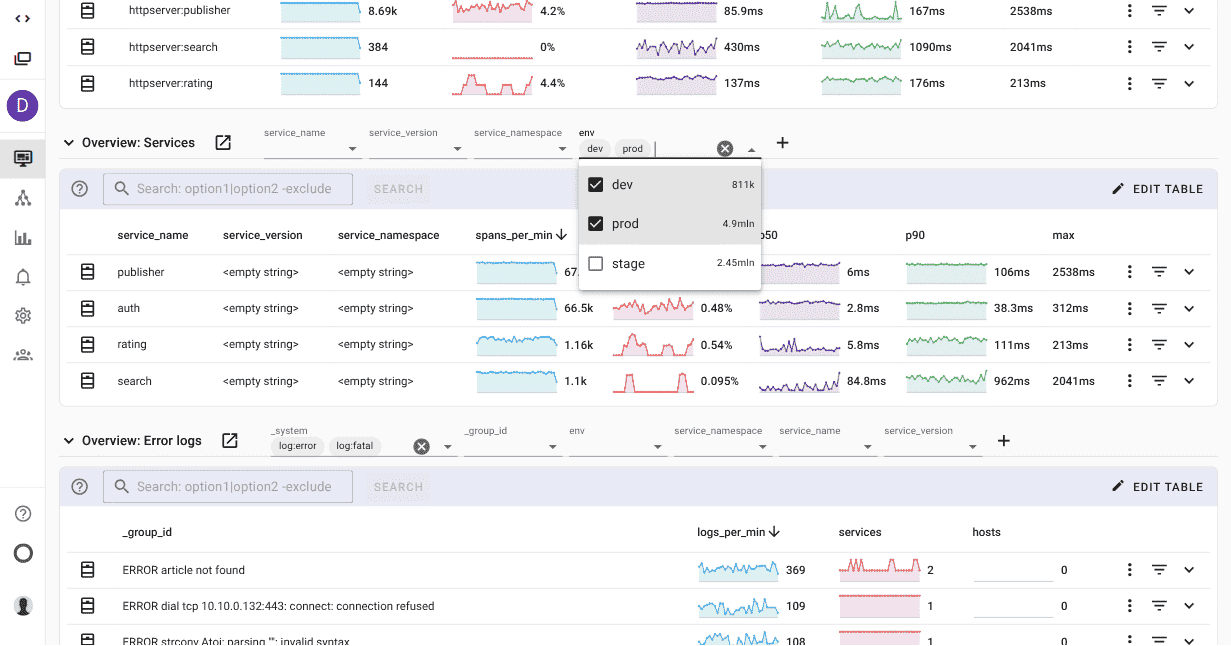
Uptrace is an OpenTelemetry-native APM that combines distributed tracing, metrics, and logs. It automatically instruments Node.js frameworks (Express, Fastify, NestJS) and provides unified observability for microservices.
Key Features:
- Automatic instrumentation for Express, Fastify, Koa, NestJS, and other frameworks
- Distributed tracing across Node.js services with OpenTelemetry
- Event loop metrics (lag, utilization) and memory tracking
- SQL query analysis with performance insights
- Log-to-trace correlation for faster debugging
Setup:
npm install @uptrace/node
require('@uptrace/node')({
  dsn: 'https://<secret>@api.uptrace.dev',
  serviceName: 'my-nodejs-app',
});

// Your application code follows
const express = require('express');
const app = express();
Pros:
- Minimal setup (single require statement)
- No manual instrumentation needed
- Works with any OpenTelemetry backend
- Self-hosted or cloud options
Cons:
- Requires OpenTelemetry knowledge for advanced use cases
- Commercial license needed for some enterprise features
Best for: Teams wanting comprehensive observability with minimal configuration.
OpenTelemetry Node.js SDK
License: Apache 2.0
GitHub: https://github.com/open-telemetry/opentelemetry-js
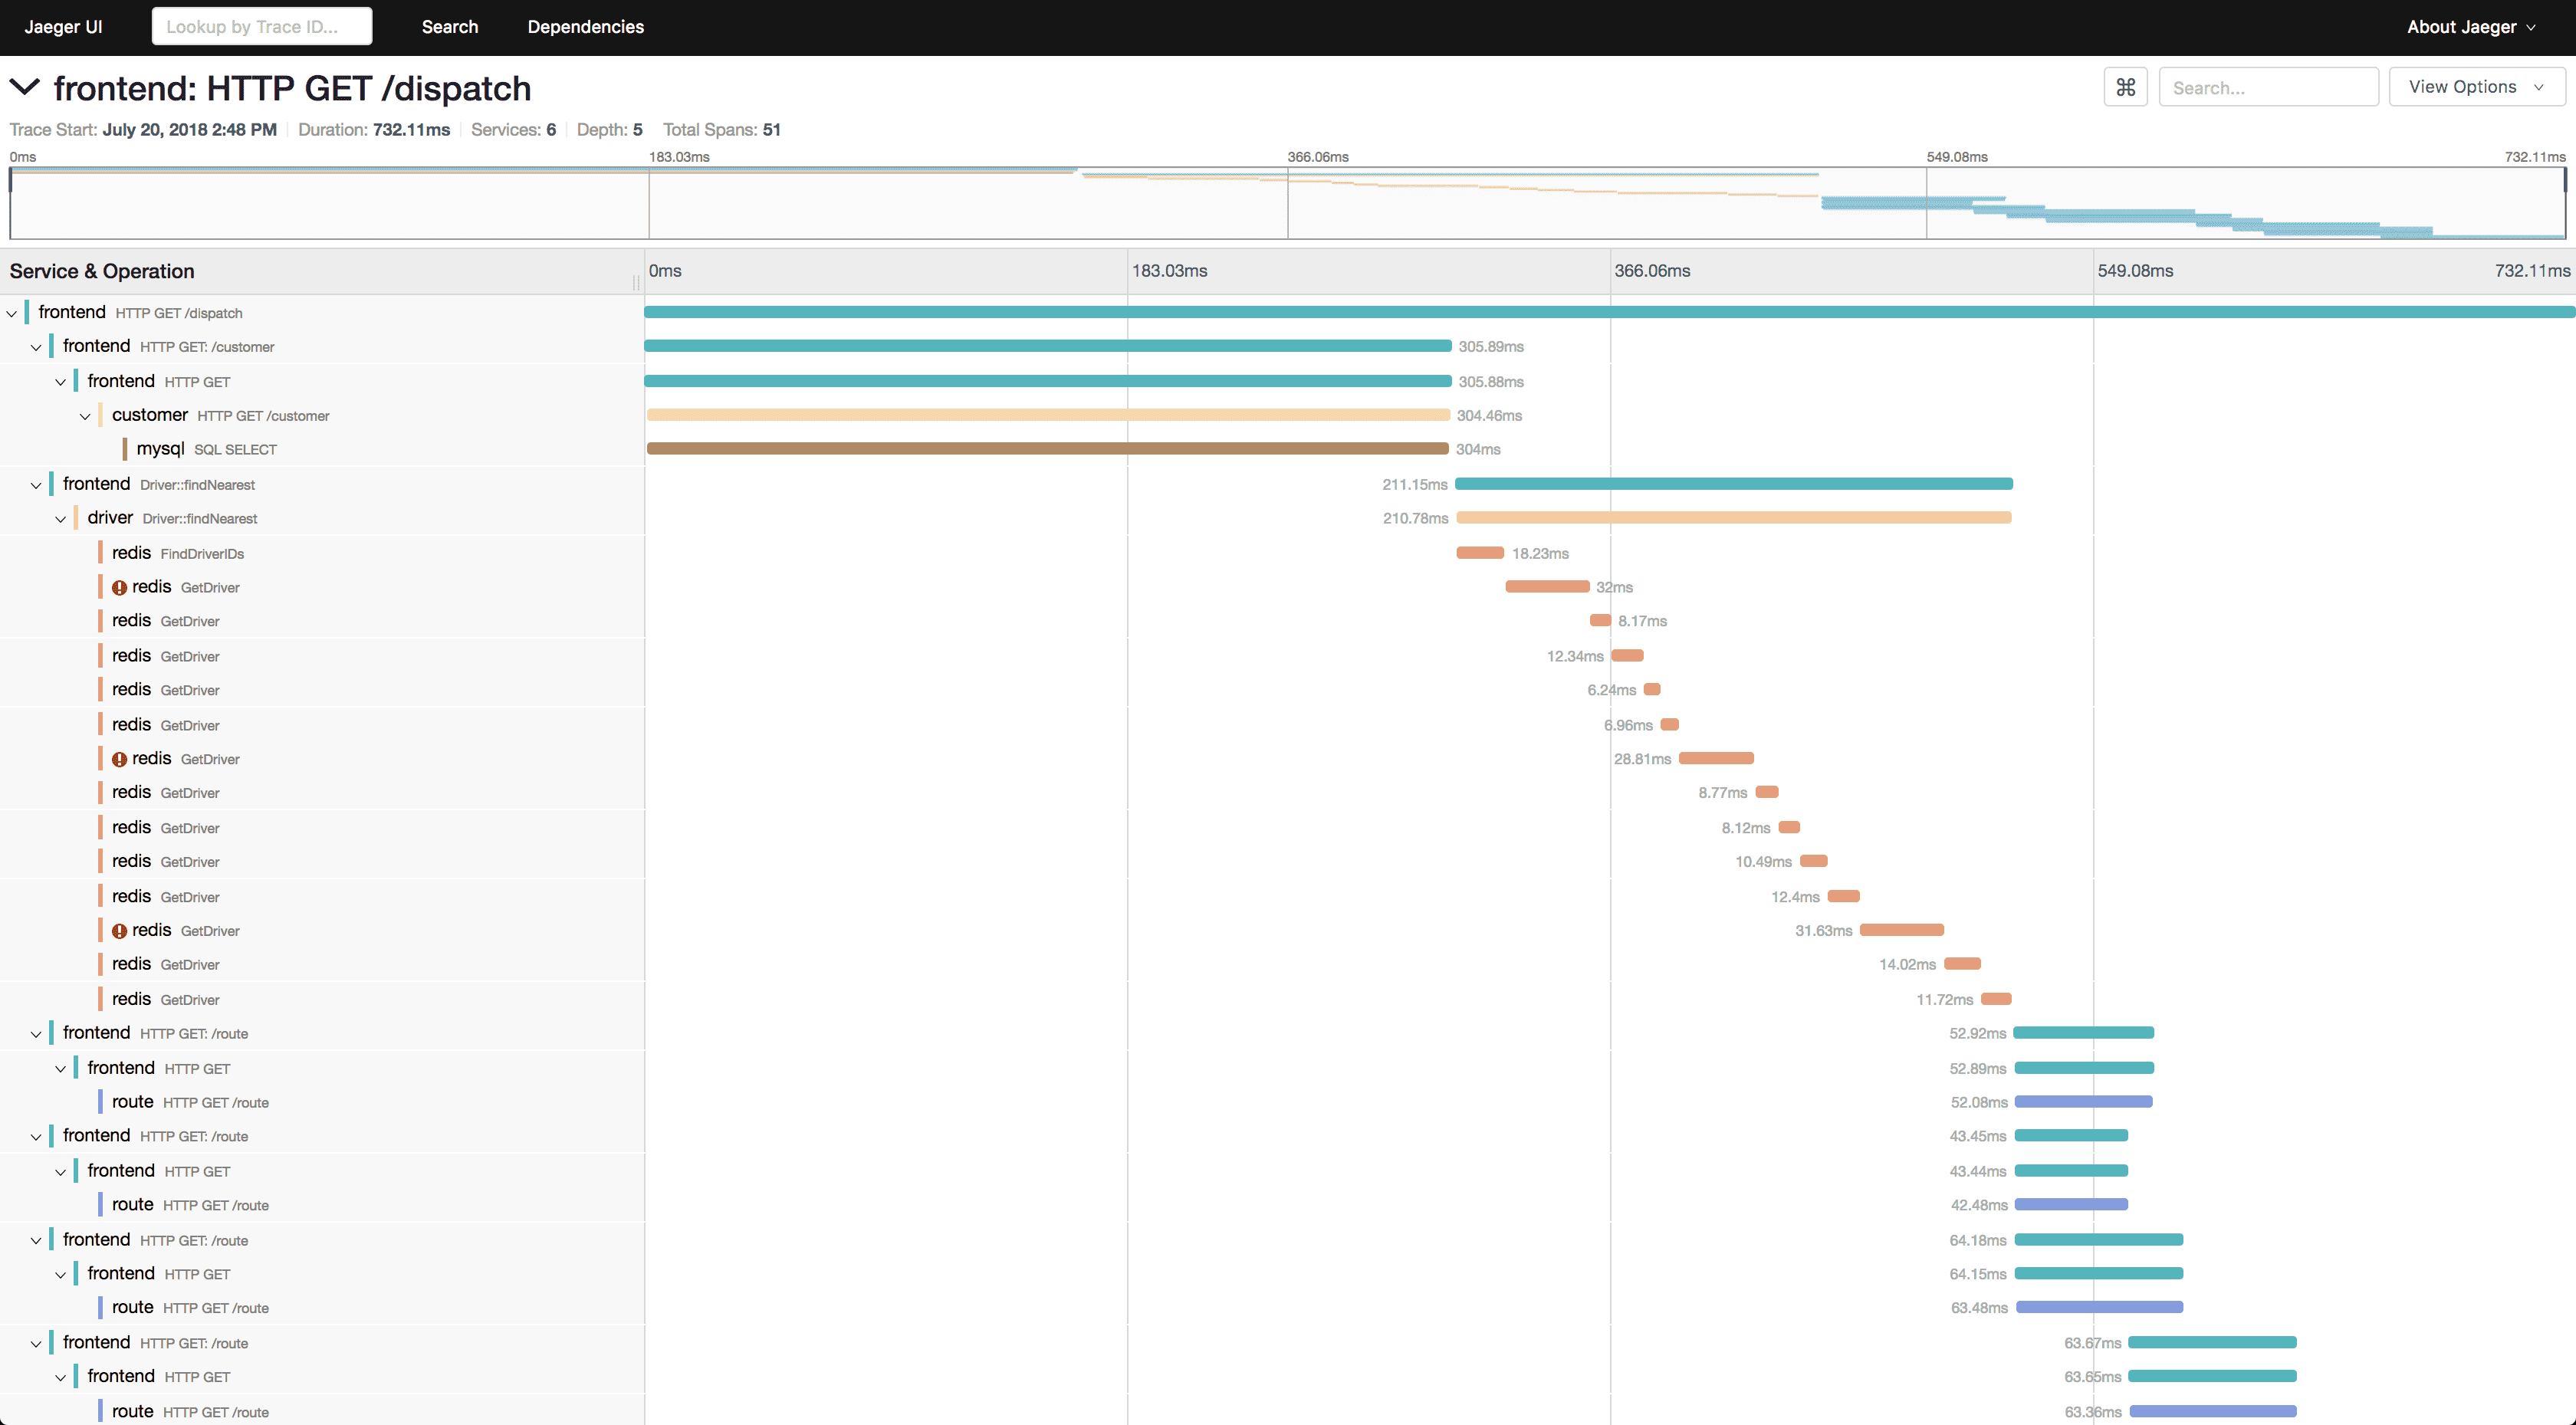
OpenTelemetry is the industry-standard observability framework backed by CNCF. The Node.js SDK provides automatic instrumentation for frameworks and libraries.
Key Features:
- Vendor-neutral telemetry collection
- Auto-instrumentation for 50+ libraries (Express, MySQL, MongoDB, Redis, etc.)
- Custom spans for application-specific tracing
- Metrics SDK for custom business metrics
- Context propagation across services and async operations
Setup:
const { NodeTracerProvider } = require('@opentelemetry/sdk-trace-node');
const { registerInstrumentations } = require('@opentelemetry/instrumentation');
const { HttpInstrumentation } = require('@opentelemetry/instrumentation-http');
const { ExpressInstrumentation } = require('@opentelemetry/instrumentation-express');

const provider = new NodeTracerProvider();
provider.register();

registerInstrumentations({
  instrumentations: [
    new HttpInstrumentation(),
    new ExpressInstrumentation(),
  ],
});
Pros:
- Industry standard (used by Google, Microsoft, AWS)
- Works with any backend (Jaeger, Zipkin, Uptrace, etc.)
- Extensive library support
- Active development and community
Cons:
- Requires configuration for exporters
- Steeper learning curve than wrapper libraries
- No built-in UI (needs separate backend)
Best for: Teams building vendor-neutral observability or integrating with existing OpenTelemetry infrastructure.
See OpenTelemetry Node.js guide with Uptrace for complete setup instructions.
Prometheus + prom-client
License: Apache 2.0
GitHub: https://github.com/siimon/prom-client
Prometheus is a metrics collection and alerting system. The prom-client library exposes Node.js metrics in Prometheus format.
Key Features:
- Default metrics (event loop lag, memory, CPU, GC stats)
- Custom metrics (counters, gauges, histograms, summaries)
- PromQL query language for powerful metric analysis
- Grafana integration for visualization
- Kubernetes-native with service discovery
Setup:
const promClient = require('prom-client');
const express = require('express');

const app = express();
const register = new promClient.Registry();

// Collect default metrics
promClient.collectDefaultMetrics({ register });

// Custom histogram for HTTP duration
const httpDuration = new promClient.Histogram({
  name: 'http_request_duration_seconds',
  help: 'Duration of HTTP requests in seconds',
  labelNames: ['method', 'route', 'status_code'],
  buckets: [0.1, 0.5, 1, 2, 5],
  registers: [register]
});

// Expose metrics endpoint
app.get('/metrics', async (req, res) => {
  res.set('Content-Type', register.contentType);
  res.end(await register.metrics());
});
Pros:
- Mature ecosystem
- Strong Kubernetes integration
- Long-term metrics storage
- Free and widely adopted
Cons:
- Metrics only (no tracing or logs)
- Requires separate Prometheus server
- Manual instrumentation for custom metrics
- Pull-based model (needs /metrics endpoint)
Best for: Metrics-focused monitoring in Kubernetes environments or when integrating with existing Prometheus infrastructure.
PM2
License: GNU AGPL v3
GitHub: https://github.com/Unitech/pm2
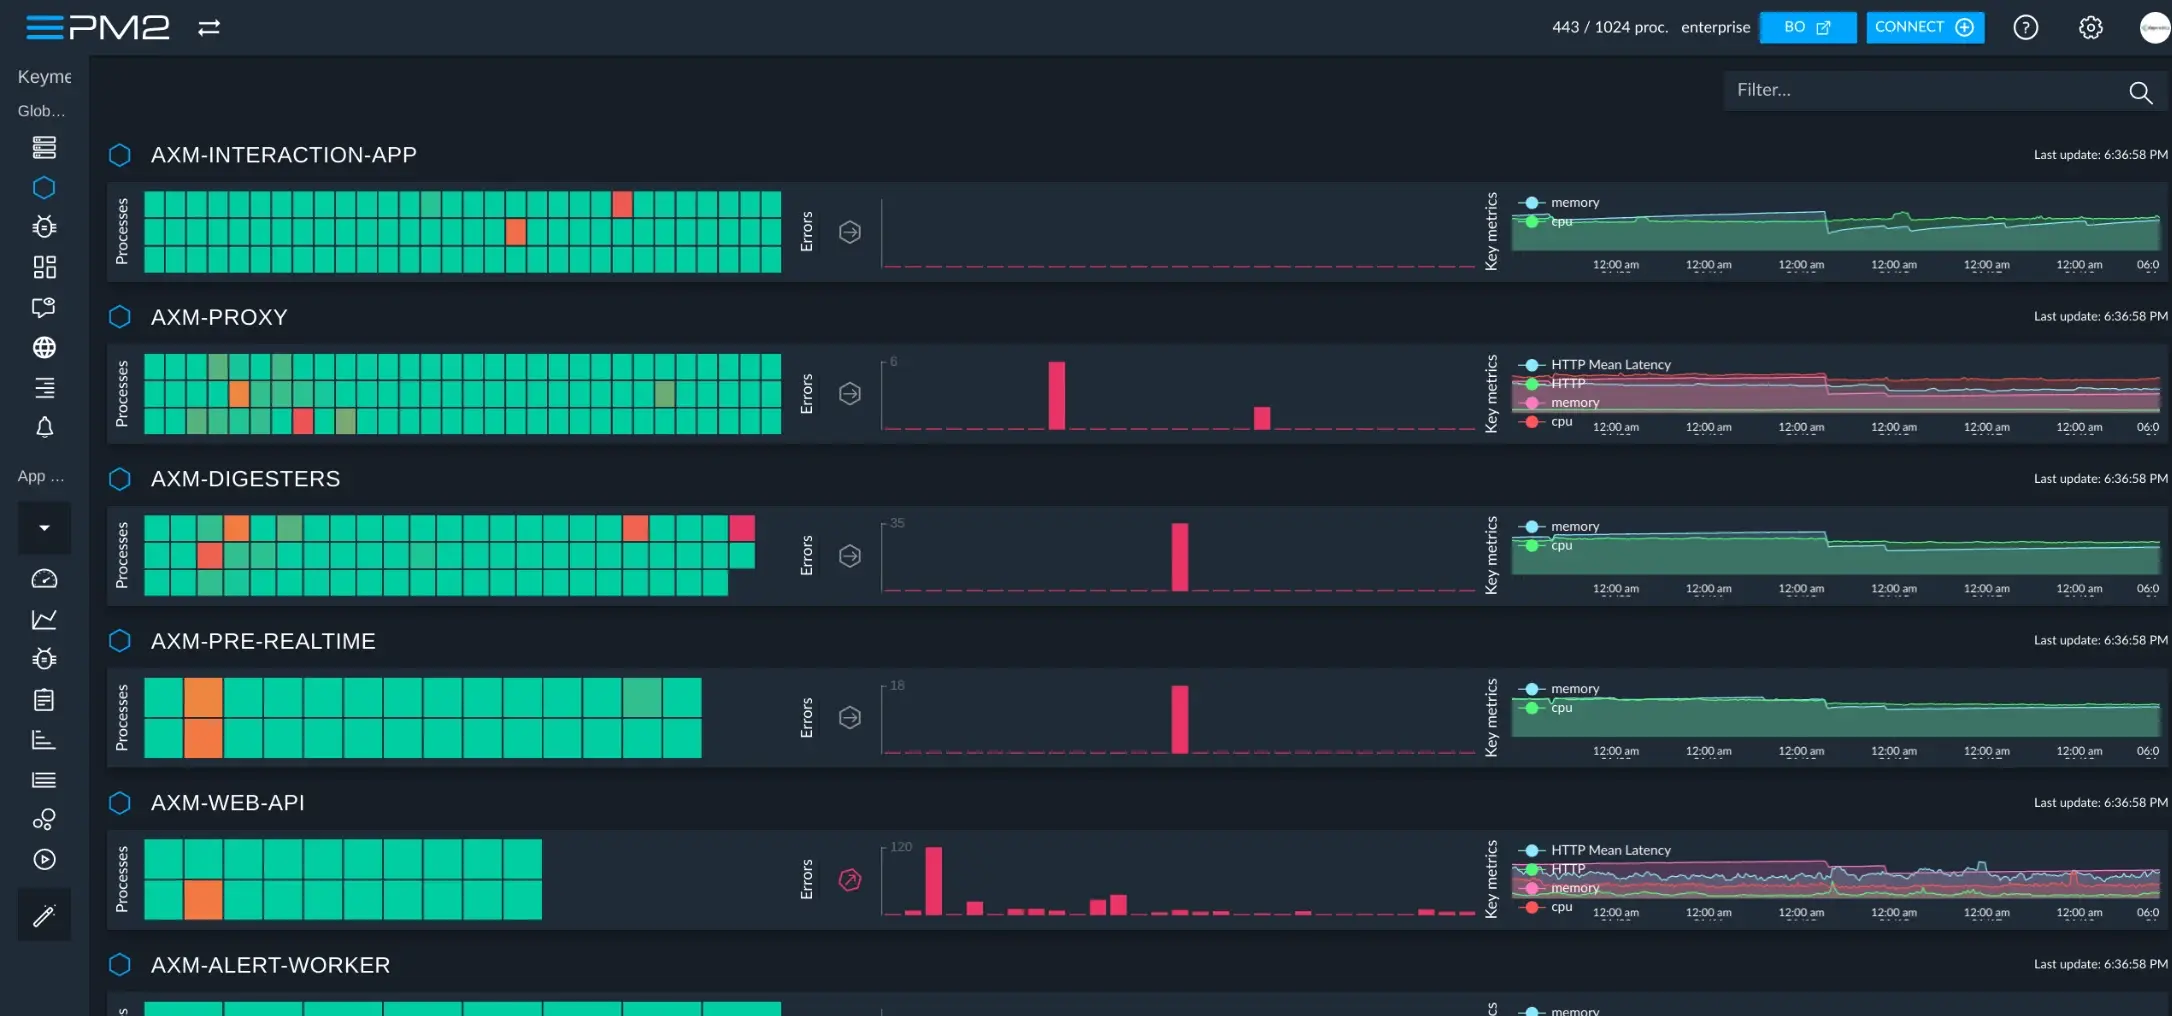
PM2 is a production process manager with built-in monitoring. It restarts crashed processes, manages logs, and provides a monitoring dashboard.
Key Features:
- Process management (restart, reload, stop)
- Built-in monitoring (CPU, memory, event loop)
- Log management (aggregation, rotation)
- Cluster mode for multi-core utilization
- Zero-downtime deployments
Setup:
npm install -g pm2

# Start application with PM2
pm2 start app.js --name my-app

# Monitor processes
pm2 monit

# View dashboard
pm2 web
Pros:
- All-in-one process manager and monitor
- Simple setup (no code changes)
- Built-in load balancing
- Free for basic features
Cons:
- Limited to single-server monitoring
- No distributed tracing
- PM2 Plus (advanced features) is commercial
- Basic metrics compared to APM solutions
Best for: Single-server Node.js deployments needing process management and basic monitoring.
Clinic.js
License: Apache 2.0
GitHub: https://github.com/clinicjs/node-clinic
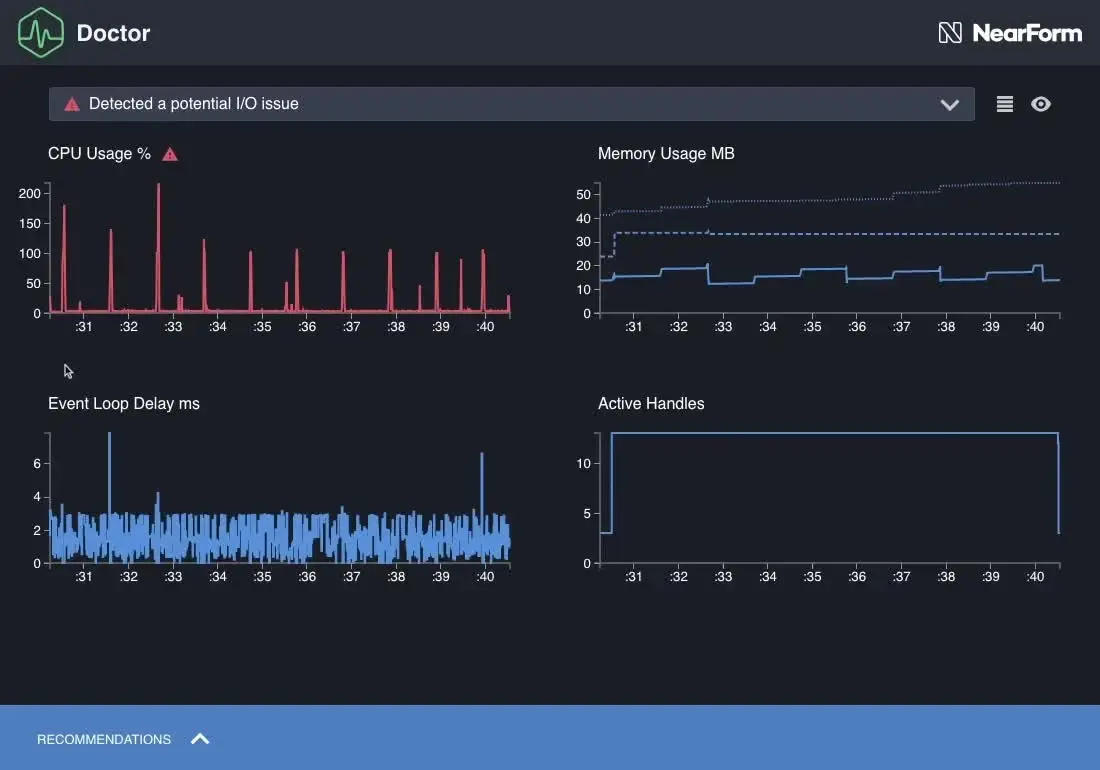
Clinic.js diagnoses Node.js performance issues through automated analysis. It profiles applications and generates reports identifying bottlenecks.
Key Features:
- Doctor: Diagnoses event loop, I/O, and CPU issues
- Bubbleprof: Visualizes async operations and delays
- Flame: CPU profiling with flame graphs
- HeapProfiler: Memory allocation analysis
Setup:
npm install -g clinic

# Profile your application
clinic doctor -- node app.js

# Generate report
clinic doctor --open
Pros:
- Automated issue detection
- Visual performance reports
- No code instrumentation needed
- Great for local development
Cons:
- Designed for development, not production monitoring
- No continuous monitoring
- Higher overhead during profiling
- Limited to single-process analysis
Best for: Debugging performance issues during development or load testing.
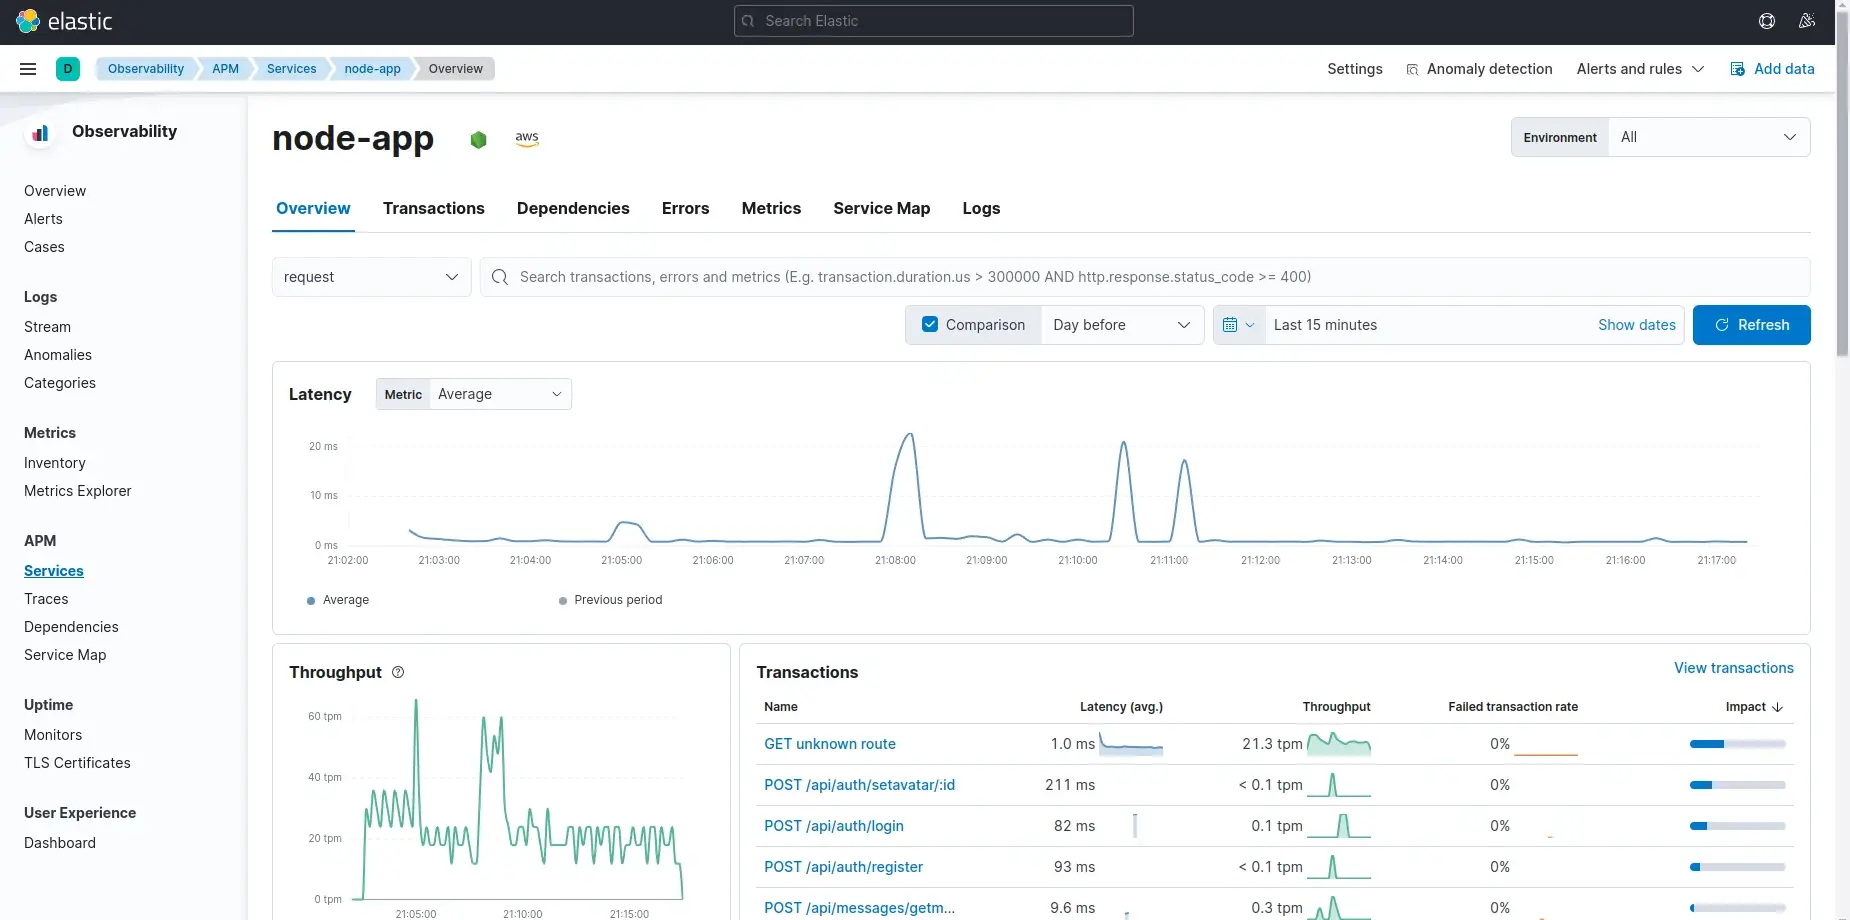
Elastic APM Node.js Agent
License: Elastic License 2.0 (source available, not pure open-source)
GitHub: https://github.com/elastic/apm-agent-nodejs
Elastic APM integrates with the Elastic Stack (Elasticsearch, Kibana) to provide distributed tracing and metrics for Node.js applications.
Key Features:
- Auto-instrumentation for Express, Fastify, Koa, Hapi
- Distributed tracing across microservices
- Error tracking with stack traces
- Custom transactions and spans
- Kibana dashboards for visualization
Setup:
const apm = require('elastic-apm-node').start({
  serviceName: 'my-app',
  serverUrl: 'http://localhost:8200',
});

const express = require('express');
const app = express();
Pros:
- Integrates with existing ELK stack
- Strong visualization through Kibana
- Active development
- Machine learning for anomaly detection
Cons:
- Requires Elasticsearch (resource-intensive)
- Elastic License restricts commercial use cases
- Learning curve for ELK stack
- Higher infrastructure costs than lightweight solutions
Best for: Teams already using Elasticsearch for logging who want unified observability.
Comparison Table
| Tool | Best For | Setup Complexity | Tracing | Metrics | Logs | Production Ready | Learning Curve |
|---|---|---|---|---|---|---|---|
| Uptrace | Unified observability | Low | ✅ | ✅ | ✅ | ✅ | Low |
| OpenTelemetry SDK | Vendor neutrality | Medium | ✅ | ✅ | ✅ | ✅ | Medium |
| Prometheus + prom-client | Metrics-only | Medium | ❌ | ✅ | ❌ | ✅ | Medium |
| PM2 | Process management | Low | ❌ | Basic | ✅ | ✅ | Low |
| Clinic.js | Performance debugging | Low | ❌ | Profiling | ❌ | ❌ | Low |
| Elastic APM | ELK Stack integration | Medium | ✅ | ✅ | ✅ | ✅ | High |
How to Choose the Right Tool?
For comprehensive observability:
- Choose Uptrace for out-of-the-box distributed tracing, metrics, and logs
- Choose OpenTelemetry SDK for maximum flexibility and vendor neutrality
- Compare other observability tools to find the best fit
For metrics-only monitoring:
- Choose Prometheus + prom-client if you already use Prometheus or Kubernetes
For process management:
- Choose PM2 when you need process restarts, clustering, and basic monitoring
For debugging performance issues:
- Choose Clinic.js to profile and diagnose bottlenecks during development
For existing Elastic Stack users:
- Choose Elastic APM if you already run Elasticsearch and Kibana
Integration with Node.js Frameworks
Most tools support automatic instrumentation for popular frameworks:
| Framework | Uptrace | OpenTelemetry | Prometheus | PM2 | Elastic APM |
|---|---|---|---|---|---|
| Express | ✅ | ✅ | Manual | ✅ | ✅ |
| Fastify | ✅ | ✅ | Manual | ✅ | ✅ |
| Koa | ✅ | ✅ | Manual | ✅ | ✅ |
| NestJS | ✅ | ✅ | Manual | ✅ | ✅ |
| Hapi | ✅ | ✅ | Manual | ✅ | ✅ |
Cost Comparison
| Tool | Self-Hosted | Cloud (per GB) | Infrastructure |
|---|---|---|---|
| Uptrace | Free (AGPL) | $0.10-0.15 | ClickHouse |
| OpenTelemetry SDK | Free | N/A (needs backend) | Depends on backend |
| Prometheus | Free | N/A | Prometheus + Grafana |
| PM2 | Free | PM2 Plus ($40+/mo) | Minimal |
| Clinic.js | Free | N/A | None (local profiling) |
| Elastic APM | Free | Elastic Cloud ($95+/mo) | Elasticsearch cluster |
Best Practices for Production Monitoring
1. Start with Automatic Instrumentation
Use tools that auto-instrument frameworks (Uptrace, OpenTelemetry) to minimize setup time.
2. Monitor Event Loop Health
Node.js performance depends on event loop responsiveness. Track lag and utilization.
3. Implement Distributed Tracing
For microservices, tracing is essential to understand request flows across services. Compare available distributed tracing tools to choose the right solution.
4. Set Up Alerts
Configure alerts for:
- High error rates (>1%)
- Slow response times (p95 > 500ms)
- Memory leaks (heap growth)
- Event loop lag (>50ms)
5. Use Sampling for High-Traffic Applications
Trace 1-10% of requests to reduce overhead while maintaining visibility.
6. Combine Multiple Tools
Use Prometheus for infrastructure metrics and OpenTelemetry for application tracing. They complement each other. For deeper performance insights, consider continuous profiling tools.
FAQ
- What's the best free Node.js monitoring tool? For comprehensive observability, Uptrace (open-source edition) or OpenTelemetry SDK. For metrics only, Prometheus with prom-client.
- Do I need distributed tracing for Node.js? Yes, if you run microservices. Tracing shows how requests flow between services and identifies bottlenecks.
- Can I use multiple monitoring tools together? Yes. Prometheus for metrics + OpenTelemetry for tracing is a common combination.
- How much overhead do monitoring tools add? Well-designed tools add 1-5% overhead. OpenTelemetry and Uptrace use sampling to minimize impact.
- What's the difference between APM and logging? APM tracks application performance (traces, metrics), while logging captures event records. Modern tools combine both.For a full comparison, see open-source APM tools.
- Is PM2 enough for production monitoring? For single-server deployments, yes. For microservices or complex systems, use distributed tracing tools.
- Which tool has the easiest setup? Uptrace requires one line of code. PM2 needs no code changes (CLI-based).