12 Best SolarWinds Alternatives - Network Monitoring & NPM Replacements
Companies are switching from SolarWinds due to security concerns (SUNBURST attack), high licensing costs ($15,000+/year for 100 devices), and limited cloud-native monitoring capabilities. This guide compares 12 alternatives with pricing, features, and migration timelines.
Quick Answer: The best SolarWinds alternative depends on your needs: Uptrace for cost-effective cloud-native monitoring (75-90% cheaper), Datadog for enterprise cloud infrastructure, PRTG for Windows environments, Zabbix/Nagios for free open-source options, or ManageEngine OpManager for mid-market network monitoring. Migration typically takes 4-6 weeks for small businesses, 3-6 months for enterprises.
Top 3 by Use Case: Uptrace for best value ($100-300/month vs SolarWinds $15,000/year), Datadog/LogicMonitor for enterprises (400+ integrations), Zabbix for free alternative (requires technical expertise).
What is SolarWinds?
SolarWinds Network Performance Monitor (NPM) is an IT infrastructure monitoring suite used by medium to large enterprises. Founded in 1999, it captures ~20% of the enterprise network monitoring market with module-based licensing starting at $1,995 per node.
Why Switch from SolarWinds?
| Reason | Impact |
|---|---|
| Security Concerns | 2020 SUNBURST attack compromised thousands of organizations, raising supply chain risk concerns |
| High Costs | Module-based licensing reaches $15,000+/year for 100 devices; add-ons increase TCO |
| Limited Cloud Support | Built for on-premises infrastructure; struggles with containers, Kubernetes, serverless |
| Complex Licensing | Per-node pricing with separate modules for NPM, APM, storage, virtualization |
| Implementation Time | 3-6 months for enterprise deployments with steep learning curve |
Top 12 SolarWinds Alternatives
Each alternative addresses specific SolarWinds limitations: cost, cloud monitoring gaps, security concerns, or licensing complexity. Here's how each solution compares on pricing, features, and deployment:
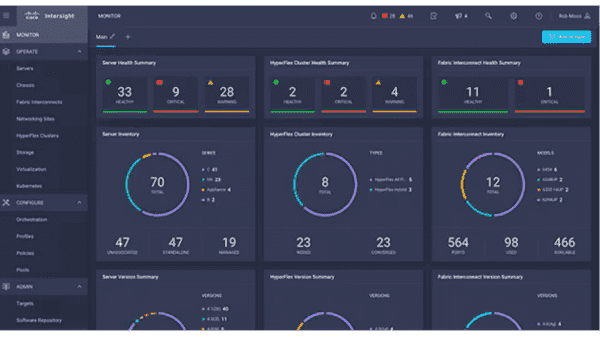
Cisco Network Management
Cisco Network Management targets enterprises with significant Cisco infrastructure investments. The platform integrates deeply with Cisco hardware (routers, switches, firewalls) and provides AI-powered analytics for network optimization.
Key Features: End-to-end network visibility, AI-powered analytics, advanced security, multi-vendor device management
| Advantages | Limitations |
|---|---|
| ✓ Superior Cisco integration | ✗ High implementation costs |
| ✓ Enterprise-grade security | ✗ Steep learning curve |
| ✓ Powerful automation | ✗ Complex setup process |
| ✓ Detailed reporting | ✗ Limited non-Cisco support |
| ✓ Scalable architecture | ✗ Expensive for small teams |
Pricing: Enterprise-level solution starting from $20,000 annually. Custom quotes based on infrastructure size and requirements.
Best For: Large enterprises with substantial Cisco infrastructure investments and dedicated IT teams requiring deep network visibility.
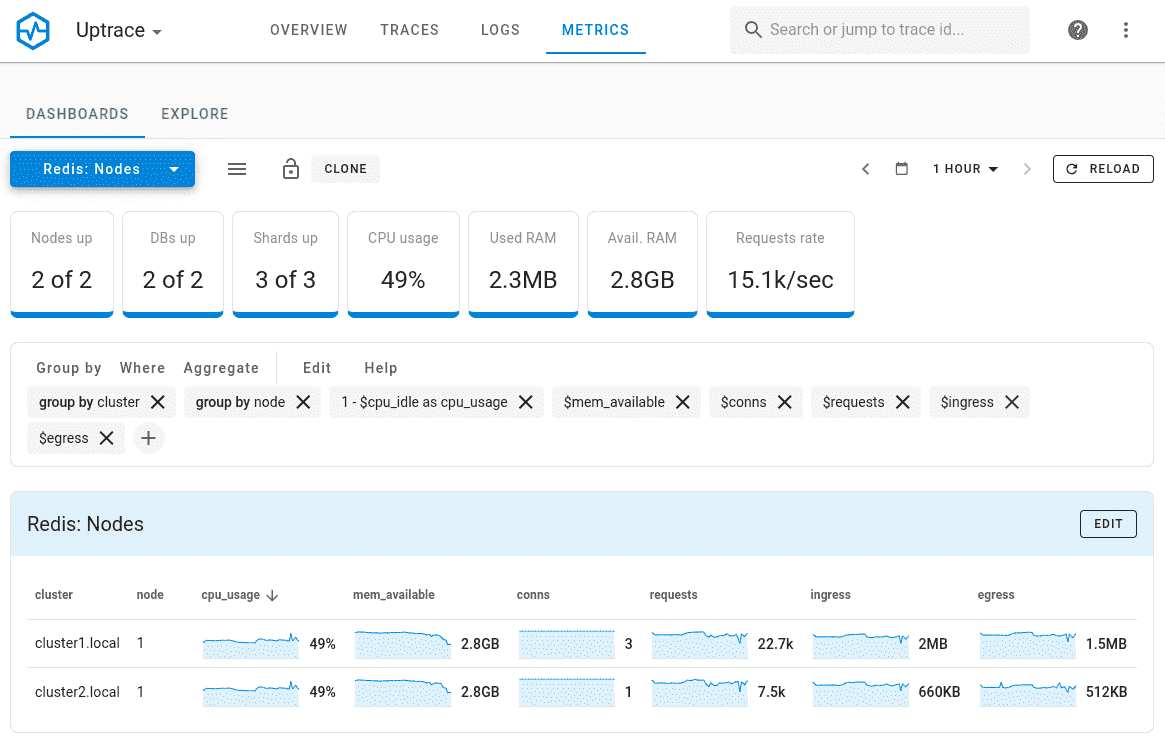
Uptrace
Uptrace is an OpenTelemetry-native APM and monitoring platform designed for cloud-native applications. Built on ClickHouse, it handles distributed tracing, metrics, and logs at 10x lower cost than traditional APM vendors while maintaining sub-second query performance.
Key Features: OpenTelemetry-native, distributed tracing, ClickHouse analytics, real-time metrics, custom dashboards
| Advantages | Limitations |
|---|---|
| ✓ Minimal overhead | ✗ Newer in market |
| ✓ Quick implementation | ✗ Limited enterprise references |
| ✓ Strong community | ✗ Features in development |
| ✓ Great documentation | ✗ Smaller ecosystem |
| ✓ Cost-effective | ✗ Learning curve for ClickHouse |
Pricing: Free open-source version available. Commercial plans start at $100/month based on data volume.
Best For: DevOps-focused teams and organizations looking for a modern, cost-effective monitoring solution with strong OpenTelemetry support.
Datadog
Datadog is a cloud-native observability platform with 400+ integrations. The platform unifies infrastructure monitoring, APM, log management, and security monitoring in a single interface, making it popular for organizations running AWS, Azure, or GCP workloads.
Key Features: Full-stack observability, 400+ integrations, ML-powered analytics, automated discovery
| Advantages | Limitations |
|---|---|
| ✓ Extensive integration ecosystem | ✗ Complex pricing structure |
| ✓ Excellent cloud monitoring | ✗ Can become expensive at scale |
| ✓ User-friendly interface | ✗ Some features require higher tiers |
| ✓ Strong API support | ✗ Limited historical data retention |
| ✓ Regular feature updates | ✗ Learning curve for advanced features |
Pricing: Infrastructure monitoring starts at $15/host/month. APM features start at $31/host/month.
Best For: Cloud-native organizations and enterprises needing unified monitoring across hybrid cloud infrastructure with 400+ pre-built integrations.
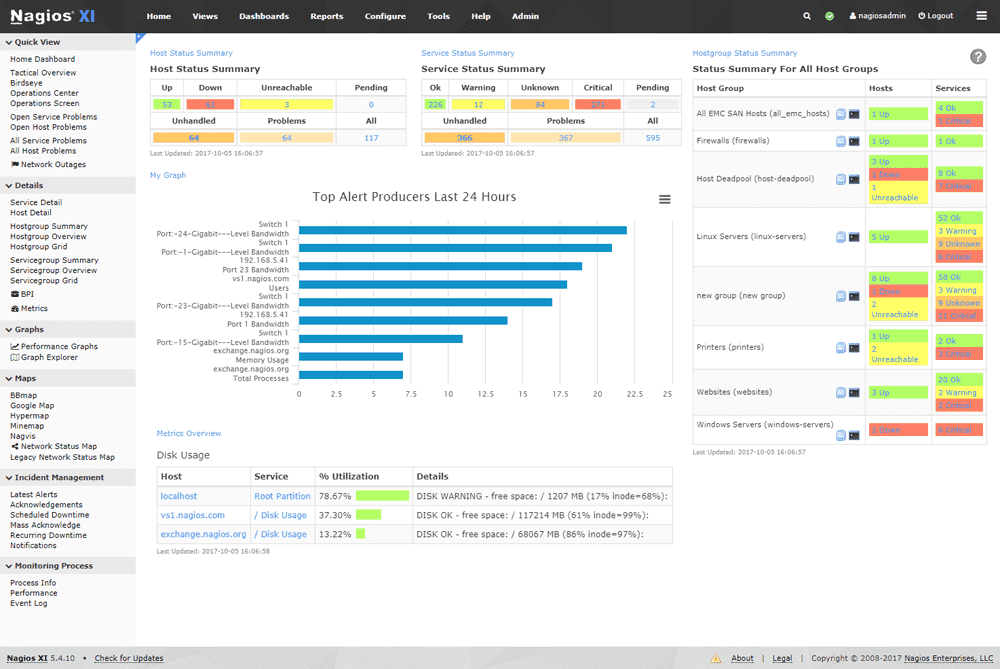
Nagios
Nagios is an open-source monitoring system with 20+ years of development and 5,000+ community plugins. The platform's plugin architecture allows monitoring of virtually any system, application, or service, making it adaptable to legacy and custom environments where commercial solutions fail.
Key Features: 5,000+ plugins, network/infrastructure monitoring, customizable alerting, multi-tenant support
| Advantages | Limitations |
|---|---|
| ✓ No licensing costs (Core version) | ✗ Complex initial setup |
| ✓ Large community support | ✗ Dated user interface |
| ✓ Extensive customization options | ✗ Manual configuration required |
| ✓ Rich plugin ecosystem | ✗ Limited modern integrations |
| ✓ Proven reliability | ✗ Steep learning curve |
Pricing: Nagios Core is free and open-source. Nagios Standard starts at $2,495 per 100 Node.
Best For: Organizations seeking a proven, cost-effective monitoring solution and having technical expertise for configuration and maintenance.
Zabbix
Zabbix is an open-source monitoring platform with enterprise features like predictive monitoring, distributed architecture, and template-based configuration. Unlike Nagios, Zabbix includes native auto-discovery, built-in graphing, and a modern web interface without requiring additional plugins.
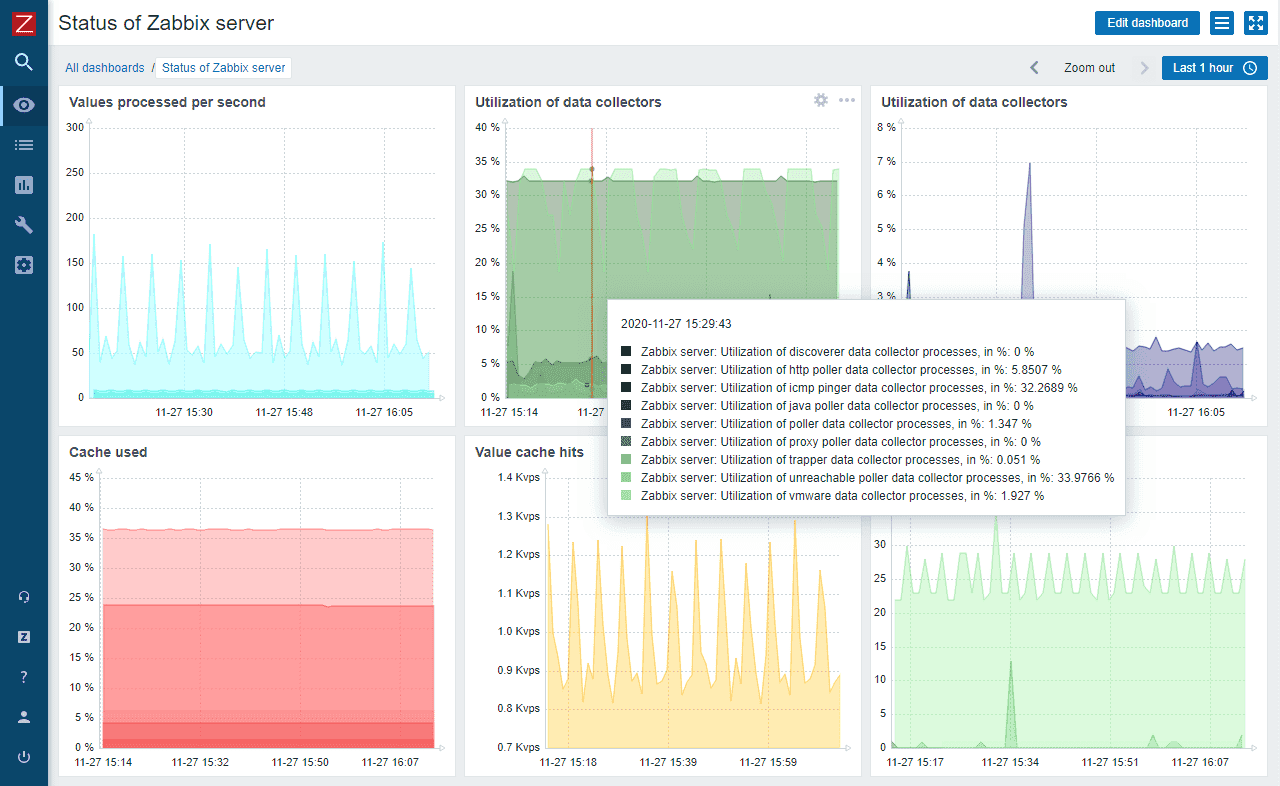
Key Features: Auto-discovery, predictive monitoring, template-based config, distributed architecture
| Advantages | Limitations |
|---|---|
| ✓ Free open-source platform | ✗ Resource-intensive |
| ✓ Enterprise-grade features | ✗ Complex configuration |
| ✓ Active development | ✗ Limited cloud monitoring |
| ✓ Strong security features | ✗ Requires expertise |
| ✓ Scalable architecture | ✗ Basic UI/UX |
Pricing: Free open-source software. Enterprise support and consulting services available at additional cost.
Best For: Organizations looking for a free, feature-rich monitoring solution with the resources to handle deployment and maintenance.
ManageEngine OpManager
ManageEngine OpManager targets mid-market organizations (100-1,000 devices) with affordable network monitoring. Starting at $245 for 25 devices, it provides network mapping, bandwidth analysis, and server monitoring at 84% lower cost than SolarWinds NPM.
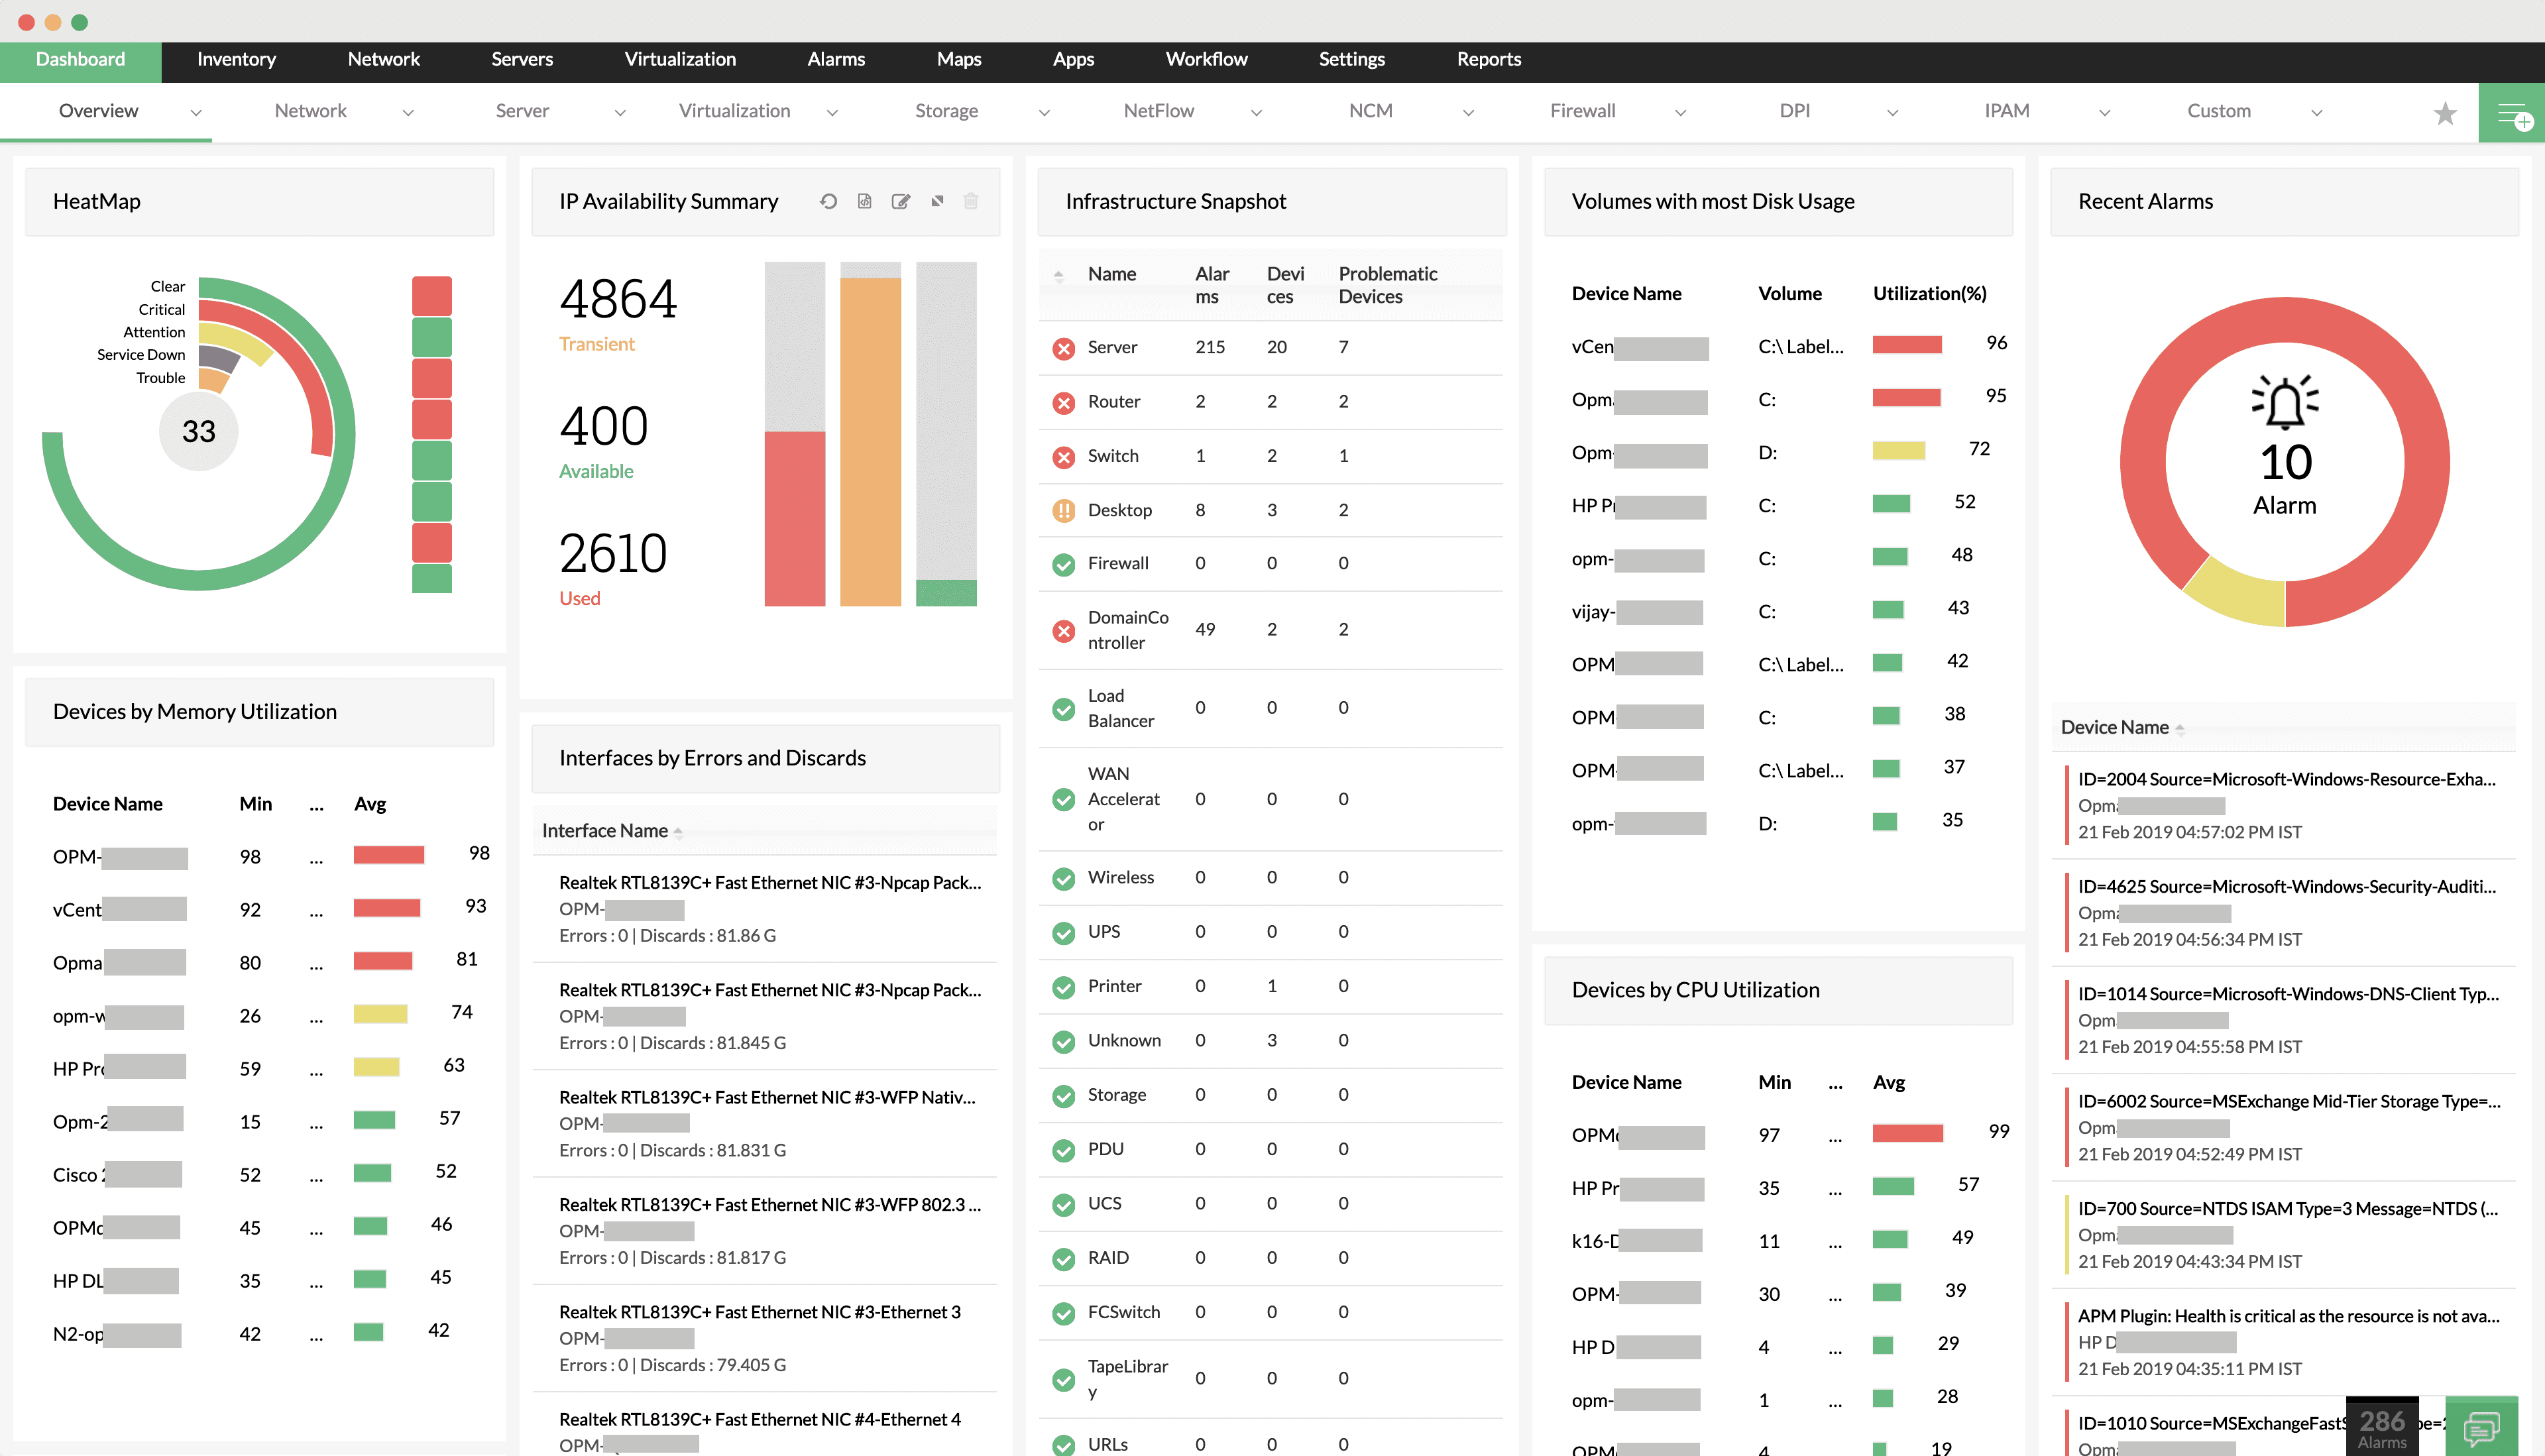
Key Features: Real-time network monitoring, automated mapping, bandwidth analysis, IPAM, server monitoring
| Advantages | Limitations |
|---|---|
| ✓ User-friendly interface | ✗ Limited customization options |
| ✓ Full network monitoring | ✗ Some features require add-ons |
| ✓ Good value for money | ✗ Advanced features cost extra |
| ✓ Easy deployment | ✗ Basic reporting capabilities |
| ✓ Strong support | ✗ Limited cloud monitoring |
Pricing: Standard edition starts at $245 for 25 devices. Enterprise edition from $11,545 for 250 devices.
Best For: Mid-sized organizations seeking a balanced monitoring solution with straightforward implementation and management.
PRTG Network Monitor
PRTG uses sensor-based licensing (one sensor per monitored metric) with flat pricing. At $1,750 for 500 sensors, it eliminates complex per-device calculations while monitoring networks, servers, applications, and IoT devices from a single Windows-based platform.
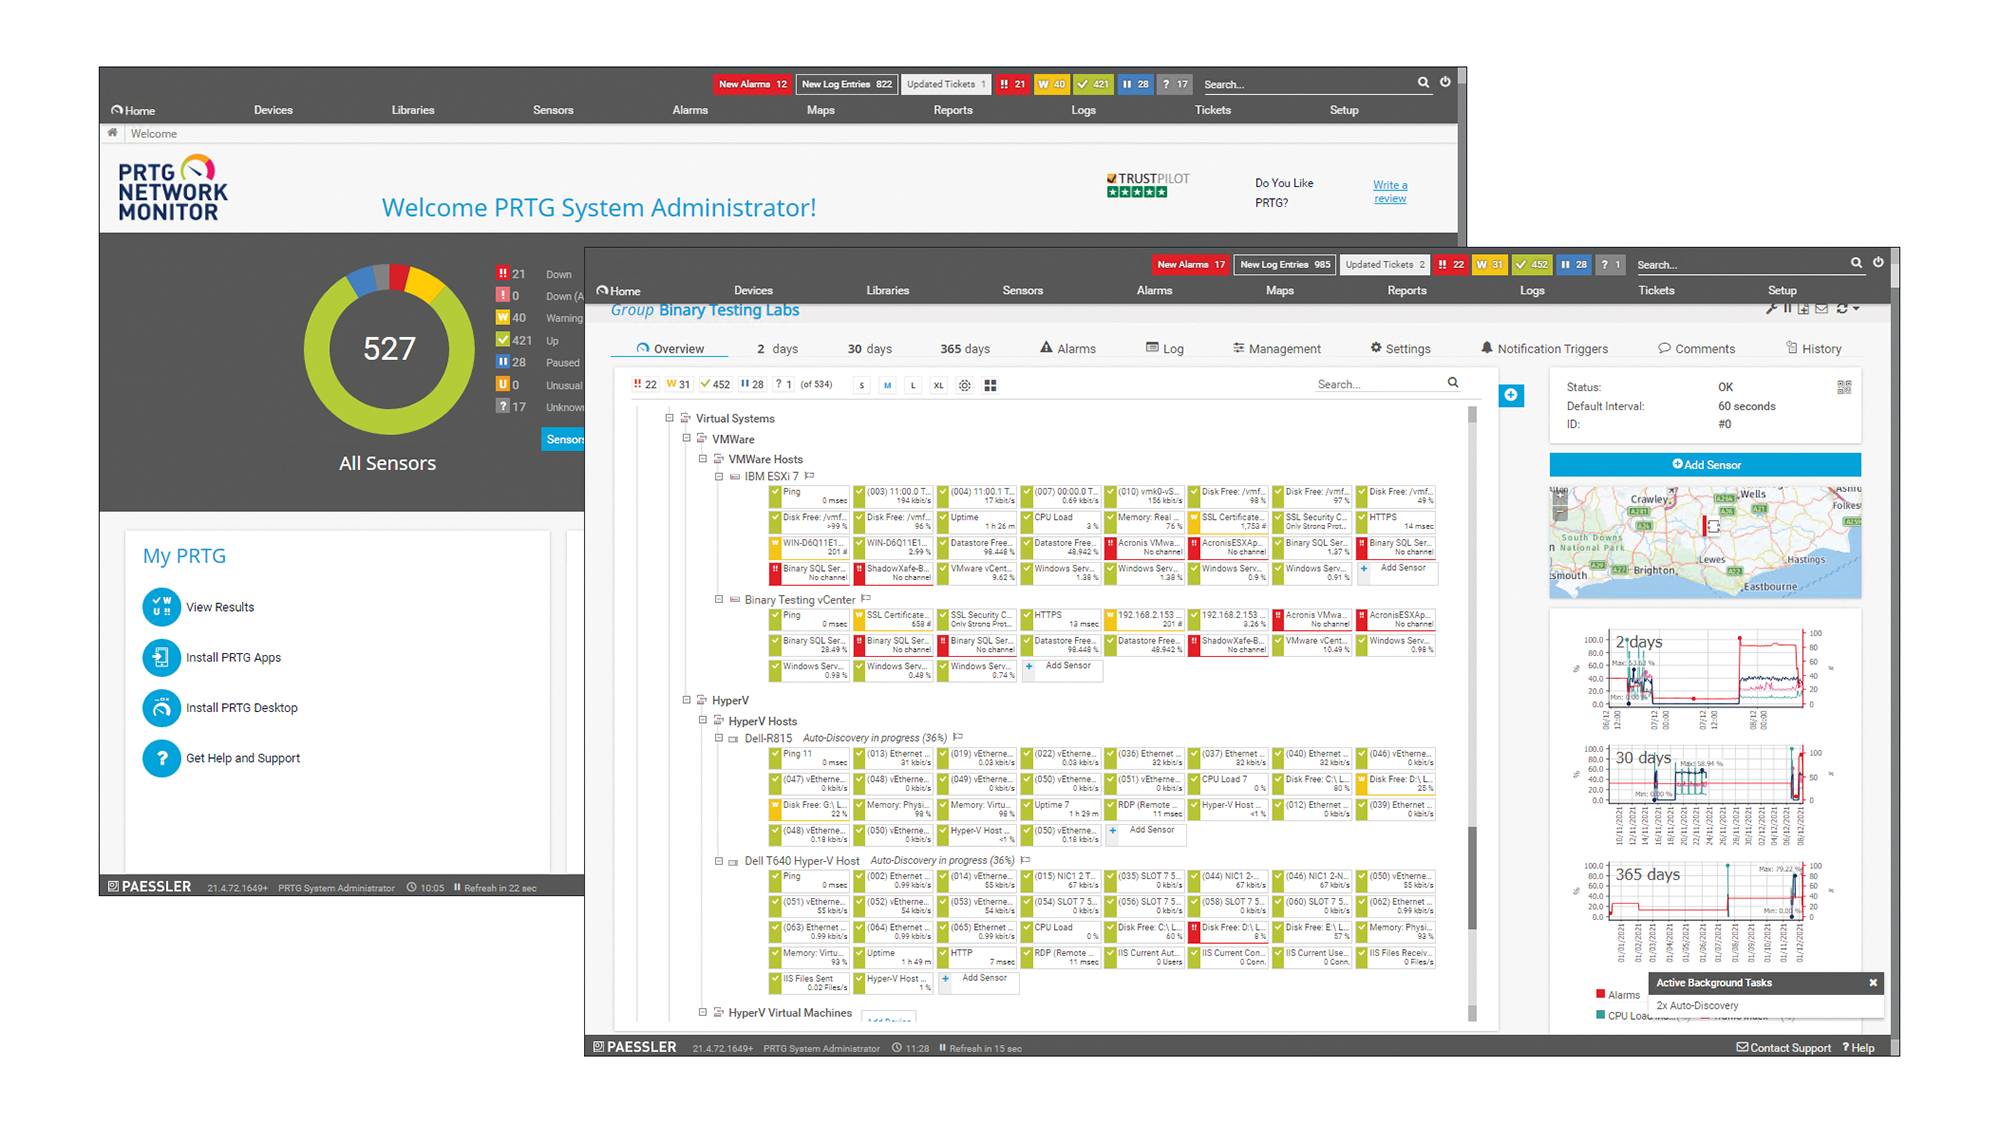
Key Features: Sensor-based monitoring (250+ types), auto-discovery, custom dashboards, mobile app, distributed monitoring
| Advantages | Limitations |
|---|---|
| ✓ Simple licensing model | ✗ Windows-only server |
| ✓ Intuitive interface | ✗ Limited public cloud monitoring |
| ✓ 250+ sensor types | ✗ Basic reporting features |
| ✓ Good visualization tools | ✗ Less flexible than competitors |
| ✓ Easy to set up | ✗ Limited custom integrations |
Pricing: Free for up to 100 sensors. Commercial licenses start at $1,750 for 500 sensors.
Best For: Windows-centric organizations looking for an easy-to-use monitoring solution with straightforward sensor-based pricing and minimal configuration.
LogicMonitor
LogicMonitor is a SaaS-only monitoring platform with AIOps capabilities and automated topology mapping. The platform discovers and monitors infrastructure automatically using 2,000+ pre-built integrations, making it suitable for hybrid environments spanning on-premises and multi-cloud deployments.
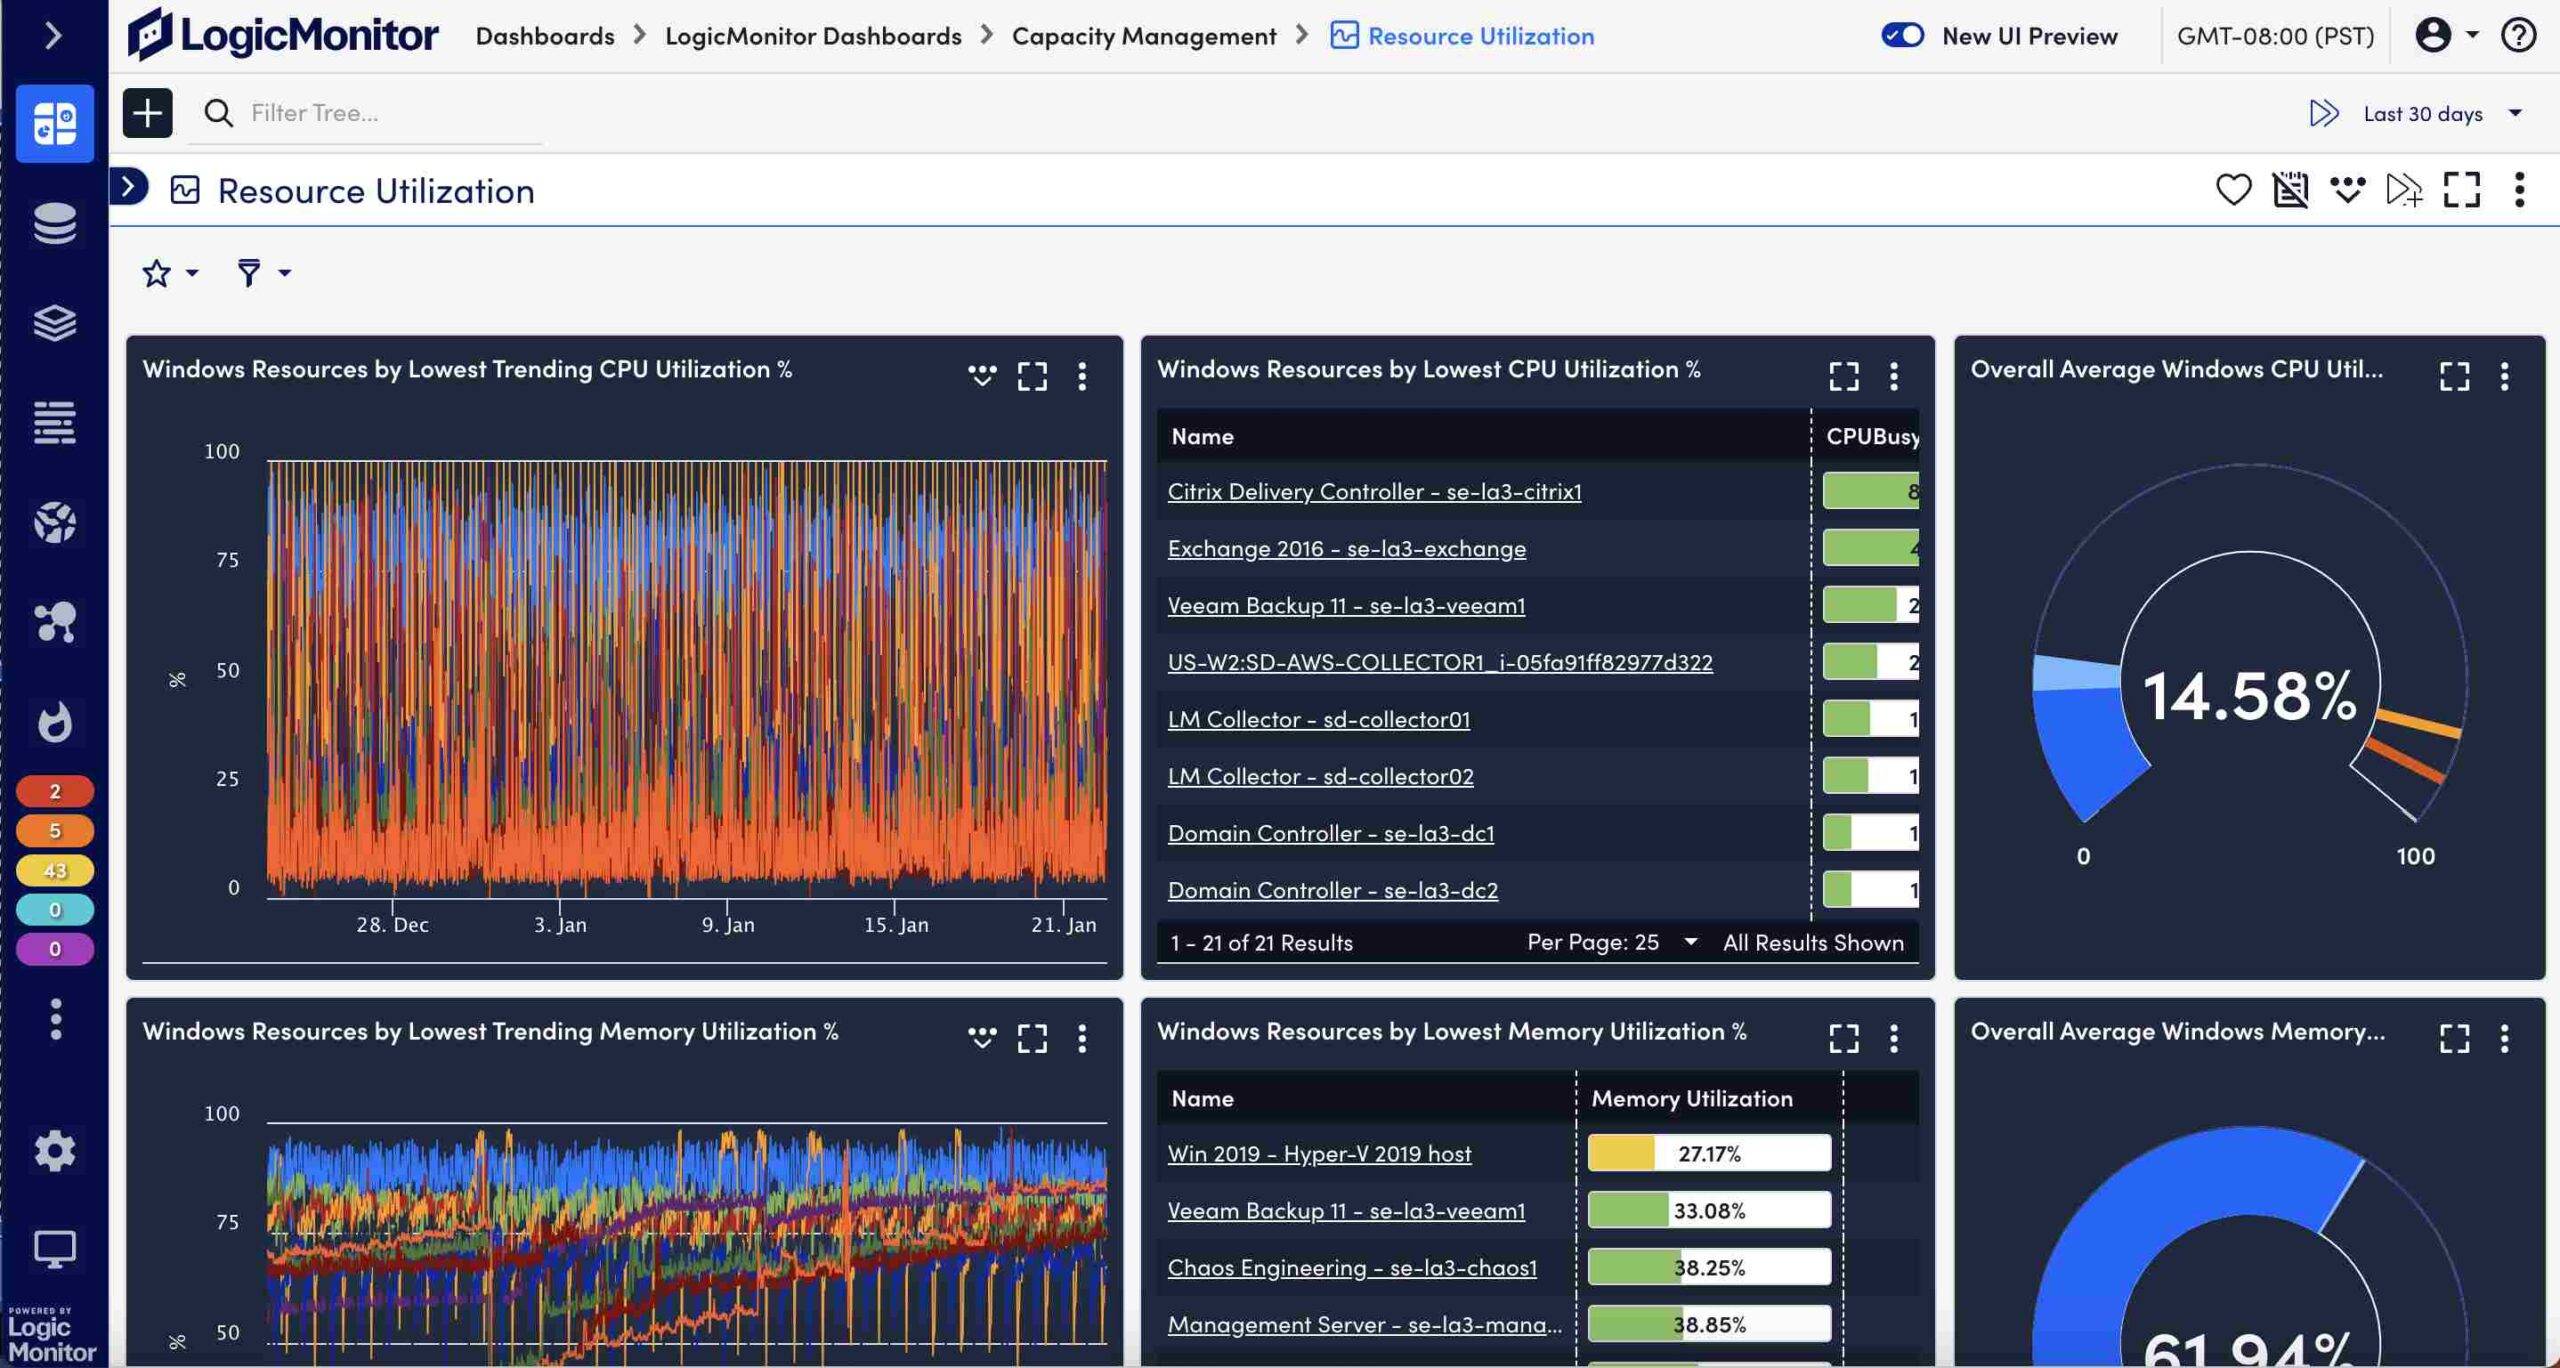
Key Features: Automated discovery, dynamic topology, AIOps anomaly detection, 2,000+ integrations, forecasting
| Advantages | Limitations |
|---|---|
| ✓ Excellent automation | ✗ Higher price point |
| ✓ Strong cloud support | ✗ Complex initial setup |
| ✓ Predictive analytics | ✗ Steep learning curve |
| ✓ Good scalability | ✗ Advanced features cost extra |
| ✓ Regular updates | ✗ Limited customization |
Pricing: Custom pricing based on monitored devices and data points. Contact vendor for quotes.
Best For: Enterprise organizations requiring hybrid infrastructure monitoring (on-premises + cloud) with automated discovery and AIOps anomaly detection.
Prometheus + Grafana
Prometheus + Grafana is the open-source standard for Kubernetes and container monitoring. Prometheus collects time-series metrics using pull-based scraping, while Grafana provides visualization dashboards. Together, they form a zero-cost stack adopted by 75%+ of Kubernetes deployments.
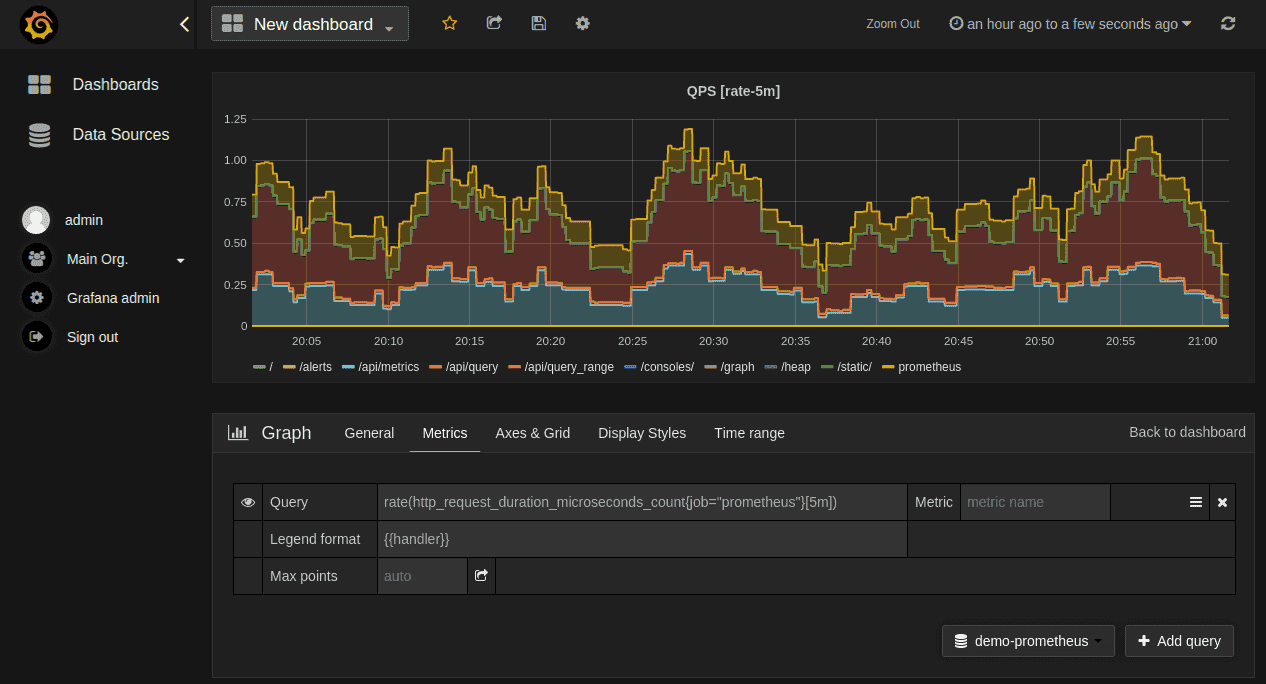
Key Features: Time-series metrics, PromQL queries, Kubernetes-native, Grafana visualization, 200+ exporters
| Advantages | Limitations |
|---|---|
| ✓ Free open-source solution | ✗ Complex initial setup |
| ✓ Cloud-native ready | ✗ Limited long-term storage |
| ✓ Strong community | ✗ Requires technical expertise |
| ✓ Flexible metrics collection | ✗ Manual configuration needed |
| ✓ Beautiful dashboards | ✗ Limited Windows monitoring |
Pricing: Free and open-source. Enterprise support available through various vendors.
Best For: Organizations running cloud-native applications and Kubernetes clusters who need customizable monitoring with full control and zero licensing costs.
WhatsUp Gold
WhatsUp Gold is a Windows-based network monitoring tool targeting small to medium businesses. Starting at $899 for 50 devices, it provides network discovery, mapping, and performance monitoring with a focus on ease of deployment over advanced features.
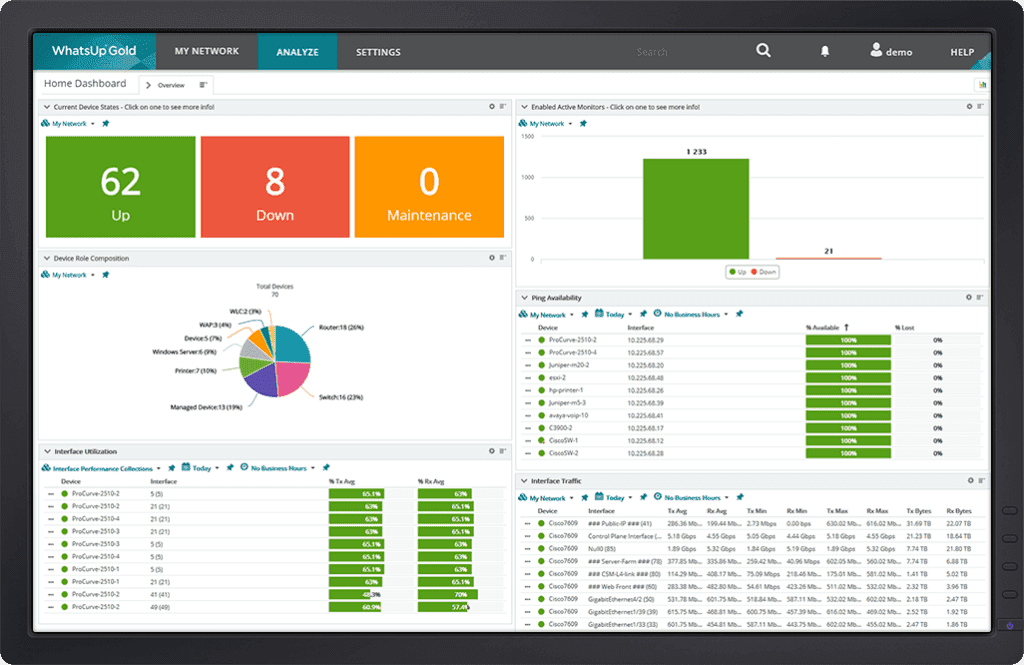
Key Features: Network discovery/mapping, performance monitoring, application monitoring, wireless monitoring
| Advantages | Limitations |
|---|---|
| ✓ Easy to deploy | ✗ Limited cloud capabilities |
| ✓ Good network visibility | ✗ Basic application monitoring |
| ✓ Intuitive interface | ✗ Windows-only deployment |
| ✓ Strong alerting system | ✗ Limited scalability |
| ✓ Unified dashboard | ✗ Less modern interface |
Pricing: Free edition. Commercial plans starts at $899 for 50 devices. Enterprise edition available with additional features.
Best For: Small to medium-sized businesses seeking a reliable network monitoring solution with straightforward implementation.
Auvik
Auvik is a cloud-based network monitoring platform designed specifically for MSPs and IT service providers. The platform automatically discovers network devices, backs up configurations, and provides remote access capabilities with multi-tenant architecture for managing hundreds of client networks from a single interface.
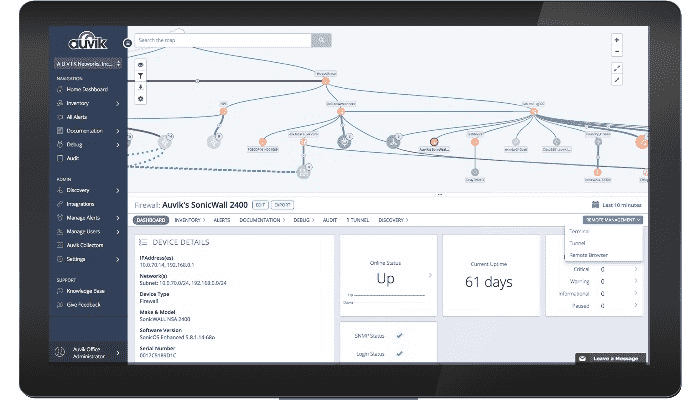
Key Features: Automated network mapping, config backup, traffic analysis, remote access, multi-tenant architecture
| Advantages | Limitations |
|---|---|
| ✓ Quick deployment | ✗ Limited customization |
| ✓ MSP-friendly features | ✗ Higher cost per device |
| ✓ Strong automation | ✗ Basic reporting features |
| ✓ Cloud-based management | ✗ Limited application monitoring |
| ✓ Good documentation | ✗ Focused mainly on networks |
Pricing: Based on number of network devices. Contact vendor for custom quotes.
Best For: MSPs and organizations seeking a cloud-based, automated network monitoring solution with minimal setup requirements.
Atera
Atera combines RMM (Remote Monitoring and Management) with PSA (Professional Services Automation) in a single platform at $149/month per technician with unlimited devices. This pricing model makes it cost-effective for MSPs managing 100+ endpoints per technician compared to per-device alternatives.
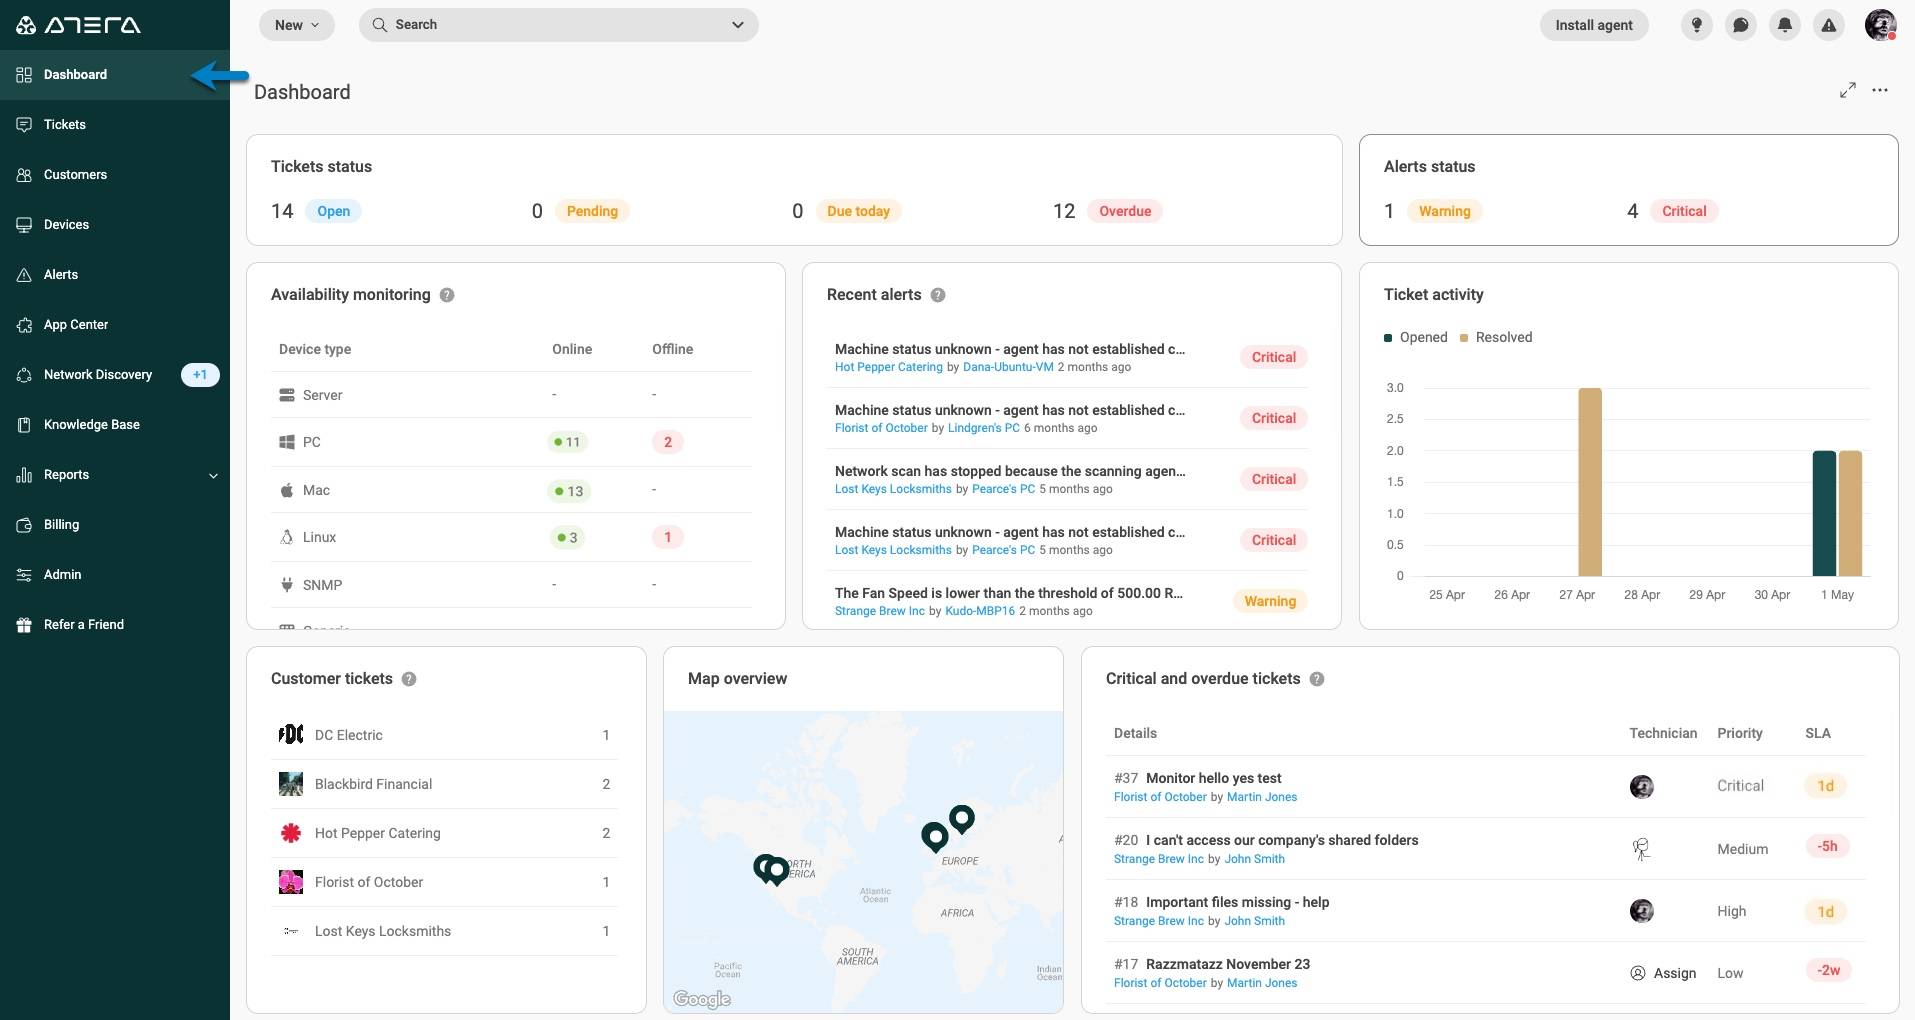
Key Features: RMM + PSA combo, patch management, IT automation, remote access, unlimited devices per technician
| Advantages | Limitations |
|---|---|
| ✓ Per-technician pricing | ✗ Limited enterprise features |
| ✓ All-in-one solution | ✗ Basic monitoring capabilities |
| ✓ Easy to use | ✗ Limited customization options |
| ✓ Built-in remote access | ✗ Less sophisticated reporting |
| ✓ Good for MSPs | ✗ Limited integration options |
Pricing: From $149/month per technician, including unlimited devices and endpoints.
Best For: Small to medium-sized MSPs and IT teams looking for an affordable, comprehensive IT management and monitoring solution.
Which Alternative Solves What
Each alternative addresses specific SolarWinds pain points. Here's which solution solves which problem:
Head-to-Head Comparison
| Alternative | Primary SolarWinds Pain Point Solved | Key Advantage Over SolarWinds | Migration Difficulty |
|---|---|---|---|
| Uptrace | High cost + Limited cloud monitoring | OpenTelemetry-native, 10x lower cost, modern cloud architecture | Low - Simple OTLP setup |
| Datadog | Limited cloud monitoring + Basic APM | Superior cloud integration, 400+ integrations, modern UI | Medium - Rich features require learning |
| Nagios | High licensing costs | Free open-source core, proven reliability, extensive plugins | High - Manual configuration |
| Zabbix | High costs + Complex licensing | Free enterprise features, predictive monitoring, scalable | Medium - Complex initial setup |
| PRTG | Complex licensing model | Simple sensor-based pricing, easy setup, all-in-one approach | Low - Intuitive interface |
| ManageEngine | High total cost of ownership | Better value for mid-market, comprehensive features at lower cost | Low - User-friendly deployment |
| Prometheus + Grafana | Vendor lock-in + High costs | Complete control, cloud-native, no licensing fees | High - Requires technical expertise |
| LogicMonitor | Limited automation + Cloud gaps | Excellent automation, strong hybrid cloud support, AIOps | Medium - Feature-rich platform |
Security-Focused Comparison
For organizations prioritizing security after the SUNBURST incident:
| Solution | Security Advantage | Supply Chain Protection |
|---|---|---|
| Open Source (Nagios, Zabbix) | Full code transparency, community auditing | Self-hosted eliminates supply chain risk |
| Cloud-Native (Uptrace, Datadog) | Modern security architecture, zero-trust design | Regular security audits, SOC 2 compliance |
| Enterprise (Cisco, LogicMonitor) | Dedicated security teams, compliance certifications | Vendor security programs, penetration testing |
Cost Comparison: SolarWinds vs Alternatives (100 Devices)
| Solution | Annual Cost (100 devices) | Cost vs SolarWinds | Hidden Costs |
|---|---|---|---|
| SolarWinds NPM | ~$15,000 | Baseline | Additional modules, support tiers |
| Uptrace | ~$1,200-3,600 | 75-90% lower | None - all features included |
| PRTG | ~$3,500 | 77% lower | None - sensor-based flat pricing |
| ManageEngine | ~$2,450 | 84% lower | Add-ons for advanced features |
| Nagios (Open Source) | $0 | 100% lower | Staffing, training, maintenance |
| Datadog | ~$18,000-36,000 | 20-140% higher | Scales with usage, multiple products |
| LogicMonitor | ~$12,000-20,000 | 20% lower to 33% higher | Custom pricing based on metrics |
Feature Comparison Matrix
When evaluating SolarWinds alternatives, it's crucial to compare key features across solutions. Here's a comprehensive comparison matrix:
| Feature | SolarWinds | Uptrace | Datadog | Cisco | Nagios | Zabbix | PRTG | LogicMonitor |
|---|---|---|---|---|---|---|---|---|
| Network Monitoring | ✓✓ | ✓ | ✓✓ | ✓✓✓ | ✓✓ | ✓✓ | ✓✓ | ✓✓ |
| Infrastructure Monitoring | ✓✓ | ✓✓ | ✓✓✓ | ✓✓ | ✓✓ | ✓✓ | ✓✓ | ✓✓✓ |
| APM Capabilities | ✓ | ✓✓✓ | ✓✓✓ | ✓ | ✗ | ✓ | ✓ | ✓✓ |
| Cloud Monitoring | ✓ | ✓✓✓ | ✓✓✓ | ✓ | ✗ | ✓ | ✓ | ✓✓✓ |
| Distributed Tracing | ✓ | ✓✓✓ | ✓✓✓ | ✓ | ✗ | ✓ | ✗ | ✓✓ |
| Automation | ✓✓ | ✓✓ | ✓✓✓ | ✓✓✓ | ✓ | ✓✓ | ✓✓ | ✓✓✓ |
| Ease of Setup | ✓ | ✓✓✓ | ✓✓ | ✗ | ✗ | ✓ | ✓✓ | ✓ |
Legend: ✓✓✓ Excellent, ✓✓ Good, ✓ Basic, ✗ Limited/None
Pricing Comparison
Understanding the cost structure of each solution is essential for making an informed decision:
Enterprise Solutions
| Solution | Starting Price | Pricing Model | Free Trial |
|---|---|---|---|
| SolarWinds | $1,995+ | Per node | 30 days |
| Cisco | $20,000+ | Enterprise | Custom |
| DataDog | $15/host | Per host | 14 days |
| LogicMonitor | Custom | Per device | 14 days |
| ManageEngine OpManager | $245 | Per device | 30 days |
Mid-Market Solutions
| Solution | Starting Price | Pricing Model | Free Trial |
|---|---|---|---|
| Uptrace | $100/month | Data volume | Free tier |
| PRTG | $1,750 | Per sensor | 30 days |
| WhatsUp Gold | $899 | Per device | 30 days |
| Auvik | Custom | Per device | 14 days |
Open Source Options
| Solution | Community Edition | Enterprise Support | Training |
|---|---|---|---|
| Nagios | Free | From $2,495 | Paid |
| Zabbix | Free | Custom | Available |
| Prometheus + Grafana | Free | Via partners | Community |
Making the Right Choice
Selecting the right monitoring tool requires matching your organization's size, technical expertise, and infrastructure type (network-focused vs cloud-native) to each alternative's strengths.
By Organization Type
| Requirement | MSPs | Enterprises | SMBs |
|---|---|---|---|
| Multi-Tenancy | Critical | Not needed | Not needed |
| Advanced Features | Basic sufficient | Critical | Basic sufficient |
| Support SLAs | Important | Critical | Nice-to-have |
| Cost Sensitivity | High | Medium | High |
| Implementation Time | Days | Months | Weeks |
| Staffing Requirements | 1-2 engineers | Dedicated team | Part-time admin |
| Primary Focus | Efficiency at scale | Comprehensive visibility | Core monitoring |
Recommendations by Use Case
| Business Type | Solution Category | Recommended Tool |
|---|---|---|
| Large Enterprise | Best Overall | Cisco Network Management |
| Best Cloud-Native | Datadog | |
| Best Value | LogicMonitor | |
| Mid-Size Organizations | Best Overall | Uptrace |
| Best Network Monitoring | PRTG | |
| Best Budget Option | ManageEngine OpManager | |
| Small Business | Best Overall | Auvik |
| Best Open Source | Zabbix | |
| Best Value | Atera | |
| MSPs | Best Overall | Auvik |
| Best Scalability | LogicMonitor | |
| Best Budget | Atera |
Migration Timeline
Realistic migration timeframes by organization size:
| Organization Size | Monitored Devices | Phase 1: Preparation | Phase 2: Parallel Operation | Phase 3: Cutover | Total Timeline |
|---|---|---|---|---|---|
| Small Business | <100 devices | 1-2 weeks | 2-3 weeks | 1 week | 4-6 weeks |
| Mid-Market | 100-1,000 devices | 3-4 weeks | 4-8 weeks | 2-3 weeks | 9-15 weeks |
| Enterprise | 1,000-10,000 devices | 6-8 weeks | 12-16 weeks | 4-6 weeks | 22-30 weeks |
| Large Enterprise | 10,000+ devices | 8-12 weeks | 16-24 weeks | 6-8 weeks | 30-44 weeks |
Timeline Extensions: ITSM integrations (+2-4 weeks), custom report recreation (+1-3 weeks), multi-region deployments (+3-8 weeks per region), custom automation (+2-6 weeks), compliance requirements (+2-4 weeks), staff training (+2-4 weeks).
Accelerating Migration:
| Strategy | Time Saved | Requirements |
|---|---|---|
| Use migration consultants | 20-30% | Budget for professional services |
| Parallel deployment approach | 15-25% | Adequate infrastructure resources |
| Pre-built templates and dashboards | 10-20% | Alternative vendor support |
| Automated configuration tools | 15-20% | API access and scripting expertise |
| Phased rollout by criticality | 10-15% | Clear prioritization framework |
Conclusion
Choosing the right SolarWinds alternative requires careful consideration of your organization's specific needs, resources, and future growth plans. Whether you opt for an enterprise solution like Cisco Network Management, a modern platform like Uptrace, or an open source SolarWinds alternative like Zabbix, success depends on thorough planning and implementation.
For organizations prioritizing cost-effectiveness and modern monitoring capabilities, Uptrace offers a compelling balance of features and value. Enterprise users might find Datadog or LogicMonitor more suitable for their complex environments. Meanwhile, teams with technical expertise can leverage open-source solutions like Prometheus + Grafana for highly customizable monitoring.
Remember that the best monitoring solution is one that aligns with your team's capabilities, budget constraints, and monitoring requirements while providing room for future growth and adaptation to emerging technologies.
FAQ
How long does a typical migration from SolarWinds take? Migration timeframes vary depending on environment complexity and size. Small organizations might complete the process in 2-4 weeks, while enterprise environments typically require 3-6 months for a full transition.
Can I maintain historical data when switching to a new monitoring solution? While some historical data can be migrated, it's often more practical to maintain access to the old system for historical reference while building new historical data in the new solution.
What's the most cost-effective SolarWinds alternative? Open-source solutions like Zabbix and Nagios offer the lowest direct costs but require technical expertise. For commercial solutions, Uptrace and PRTG provide good value with transparent pricing models.
How do cloud-native monitoring solutions compare to traditional monitoring tools? Cloud-native solutions like Datadog and Uptrace typically offer better scalability and modern feature sets but might be more expensive for large deployments. Traditional tools often provide more detailed network monitoring but may lack advanced cloud monitoring capabilities.
Is it possible to run multiple monitoring solutions simultaneously? Many organizations maintain multiple monitoring tools for different purposes or during migration periods. However, this approach increases complexity and costs, so it's generally recommended to consolidate monitoring where possible.
Which SolarWinds alternative is best for legacy infrastructure? For legacy environments, traditional solutions like ManageEngine OpManager, PRTG, and WhatsUp Gold offer the best support for older hardware and protocols. These platforms maintain compatibility with legacy SNMP devices, older Windows servers, and proprietary network equipment that cloud-native solutions may not support well.
How does enterprise support compare across SolarWinds alternatives? Enterprise support varies significantly: Cisco and LogicMonitor offer 24/7 dedicated support with SLAs starting at 1-hour response times. Datadog provides tiered support (8-hour to 1-hour SLAs). Open-source solutions (Nagios, Zabbix) offer community support by default, with commercial support available through vendors. Uptrace provides email and chat support with response times under 24 hours.
What are the security considerations when migrating from SolarWinds? Post-SUNBURST, key security considerations include: supply chain risk (favor open-source or vendors with strong security programs), on-premises vs cloud deployment models (self-hosted eliminates cloud vendor risk), data encryption in transit and at rest, access control and audit logging capabilities, and compliance certifications (SOC 2, ISO 27001). Review each vendor's security posture and incident response history.
Can I trial SolarWinds alternatives before committing? Most commercial solutions offer free trials: Datadog (14 days), PRTG (30 days with unlimited sensors), ManageEngine (30 days), LogicMonitor (14 days), and Auvik (14 days). Open-source options (Nagios, Zabbix, Prometheus/Grafana) can be deployed indefinitely for testing. Uptrace offers a free tier for evaluation. Request proof-of-concept environments to test with your actual infrastructure before purchasing.
What integrations will I lose when leaving SolarWinds? SolarWinds Orion integrations to review before migrating: ticketing systems (ServiceNow, Jira), log management (Splunk, Elasticsearch), visualization (Power BI, Tableau), automation (Ansible, Puppet), and cloud platforms (AWS, Azure, GCP). Most alternatives support these integrations but may require reconfiguration. Create an integration inventory before migration and verify equivalent functionality in your chosen alternative.