Dashboards
Uptrace dashboards let you build custom visualizations from spans, events, logs, and metrics using a Prometheus-inspired query language. Dashboards can be authored in the graphical UI or defined as YAML files — both produce the same result and can be used together.
To create a dashboard, go to Metrics → Dashboards and click New dashboard.
Table and grid
Uptrace uses two complementary dashboard types together:
Table dashboard
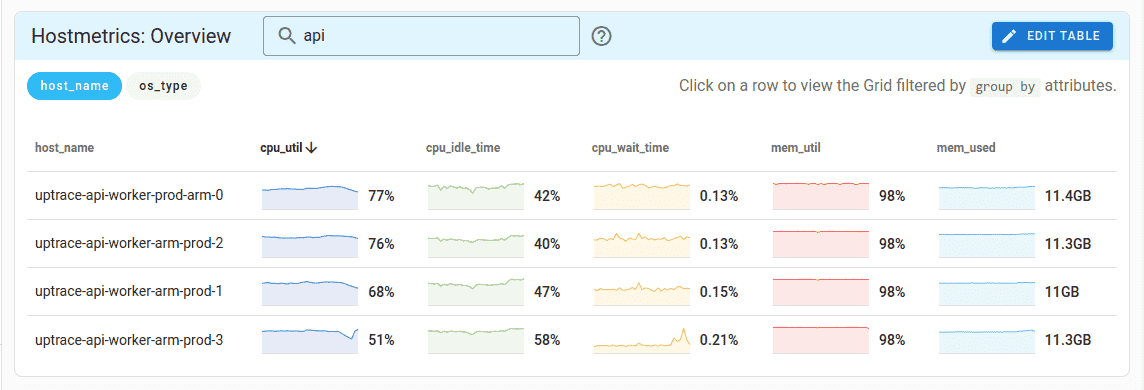
A table dashboard aggregates data per grouping dimension — for example, per host or per service. Each row links to the grid dashboard filtered to that row's values, acting as a variable selector without requiring explicit variable dropdowns.
table:
  metrics:
    - system_cpu_utilization as $cpu_util
    - system_memory_utilization as $mem_util
    - system_memory_usage as $mem_usage
  query:
    - group by host_name
    - avg($cpu_util) as cpu_util
    - avg($mem_util) as mem_util
    - sum($mem_usage{state="used"}) as mem_used
  columns:
    cpu_util: { unit: utilization }
    mem_util: { unit: utilization }
Grid dashboard
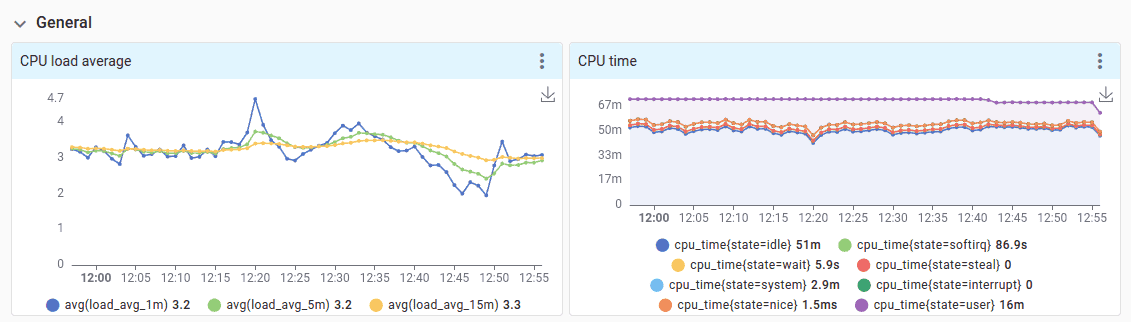
A grid dashboard is a classic layout of time-series charts organized in collapsible rows — similar to Grafana.
grid_sections:
  - title: General
    items:
      - title: CPU utilization
        metrics:
          - system_cpu_utilization as $cpu_util
        query:
          - avg($cpu_util)

      - title: CPU time
        metrics:
          - system_cpu_time as $cpu_time
        query:
          - perMin(sum($cpu_time)) as cpu_time group by state
        chart: stacked-area
Start with a table dashboard and add a grid later. A grid dashboard can be used standalone if no table is needed — just leave the table section empty.
Dashboard templates
Uptrace ships with pre-built YAML templates for popular OpenTelemetry instrumentations: host metrics, PostgreSQL, MySQL, Kubernetes, Redis, .NET, and many more. You can find the full list on GitHub.
When Uptrace receives new metrics, it checks available templates and automatically creates dashboards for matching metrics — no manual setup required.
You can import and export dashboard templates as YAML through the Uptrace UI. To share dashboards with the community, open a pull request on GitHub.
Templates can also bundle metric monitors so dashboards and their alerts ship as a single file:
monitors:
  - name: CPU usage
    metrics:
      - system_cpu_load_average_15m as $load_avg_15m
      - system_cpu_time as $cpu_time
    query:
      - avg($load_avg_15m) / uniq($cpu_time, cpu) as cpu_util
      - group by host_name
    column:
      name: cpu_util
      unit: utilization
    detector:
      type: manual
      max_value: 3
    num_eval_points: 10
System metrics
Uptrace provides built-in metrics under the uptrace_ prefix for accessing internal system data:
| Metric | Description |
|---|---|
uptrace_tracing_spans | Number of spans and their duration (excluding events and logs) |
uptrace_tracing_events | Number of events (excluding spans and logs) |
uptrace_tracing_logs | Number of logs (excluding spans and events) |
uptrace_service_graph_client_duration | Request duration between two nodes as seen from the client |
uptrace_service_graph_server_duration | Request duration between two nodes as seen from the server |
uptrace_service_graph_failed_requests | Total count of failed requests between two nodes |
uptrace_billing_sampled_bytes | Number of sampled bytes per project |
uptrace_billing_sampled_spans | Number of sampled spans and logs per project |
uptrace_billing_dropped_spans | Number of dropped spans and logs per project |
uptrace_billing_timeseries | Number of active timeseries per project |
Related
- Dashboard YAML Templates — full YAML schema reference
- Querying metrics — MQL query language for metrics
- Observability as Code — manage dashboards as version-controlled YAML files
- MCP Server — create and update dashboards from AI assistants