Querying traces
While the span query language operates on individual spans and logs, trace queries allow you to select entire traces based on the spans, logs, and events they contain. This is useful for finding traces that match complex criteria across multiple services and operations.
For example, you can find all traces that contain a slow database query, have an error in a specific service, or involve a particular combination of microservices.
Query Structure
A trace query consists of multiple rows, where each row targets a different part of the trace. The first row is always the root row, and subsequent rows define conditions on child spans, logs, or events.
root: <query for the root span>
<system> as <alias>: <query for matching spans>
Each row accepts the full span query language including filters, aggregations, and groupings. A typical root row query looks like:
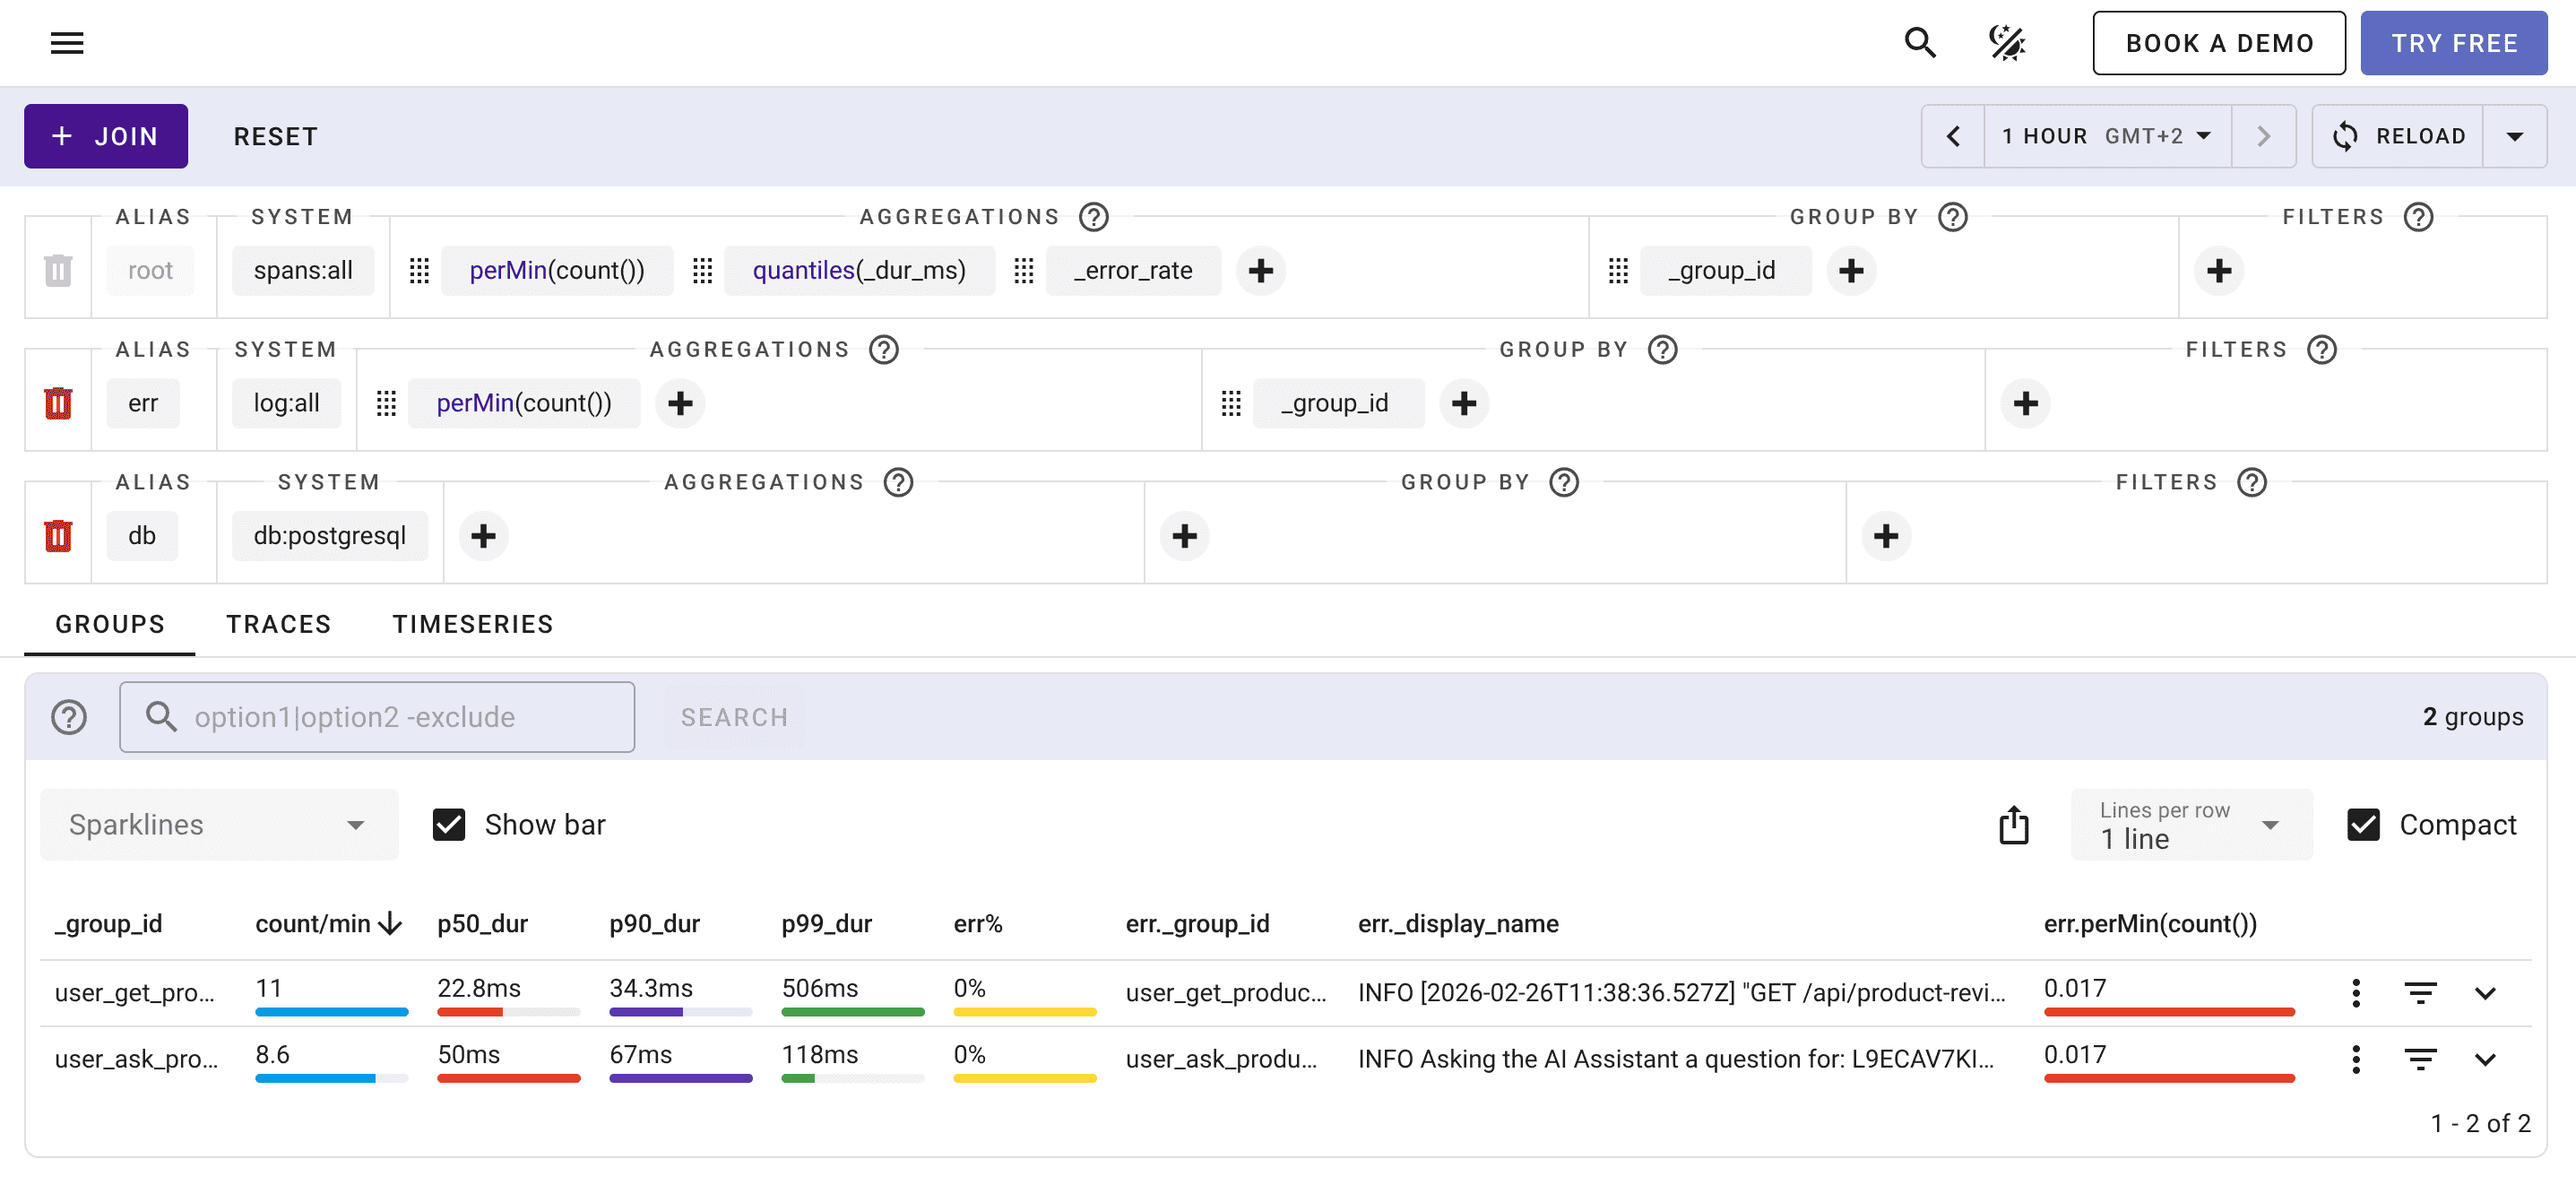
root: perMin(count()) | quantiles(_dur_ms) | group by _group_id
| Component | Description |
|---|---|
root | Selects the root span of the trace. Use <empty> to match all root spans. |
<system> | A span system like db:postgresql, rpc:all, or log:error. |
as <alias> | Names the row. Optional for readability, but required to reference the row from the root with a cross-join expression ($alias.attr). The alias must be unique and cannot be root. |
<query> | Full query with where, group by, and aggregate clauses. |
Filtering by System
Each non-root row targets spans belonging to a specific system. You can use exact systems or wildcard systems with :all:
| System | Matches |
|---|---|
db:postgresql | PostgreSQL database spans only |
db:mysql | MySQL database spans only |
db:all | All database spans (PostgreSQL, MySQL, etc) |
rpc:grpc | gRPC spans only |
rpc:all | All RPC spans |
http:service1 | HTTP spans for service1 |
httpserver:all | All HTTP server spans |
messaging:kafka | Kafka messaging spans only |
messaging:all | All messaging spans |
log:error | Error-level logs |
log:warn | Warning-level logs |
Cross-Join Expressions
The rows shown so far each match spans independently — a trace is returned when every row finds at least one matching span. To bring a child row's values into the result, you have two equivalent options.
Aggregate in the child row. The simplest way to expose a child value is to compute it in the child row itself; its selectors become $alias.col columns on the root:
root: count() | group by _group_id
db:all as db: max(_dur_ms) as slowest_query_ms
A result cell can span many traces (see how child values are aggregated), so the child aggregate is re-aggregated across them with its own merge: $db.slowest_query_ms is the slowest query anywhere in the cell, and db:all as db: sum(_dur_ms) the total. To merge differently — the busiest trace, a mean, one representative — wrap it (max(count()), avg(count()), any(max(_dur_ms))). Prefer this form whenever you just need a child value as its own column.
Reference a child from the root with $alias.attr. A cross-join expression lets the root row aggregate a child's attributes inline (max($db._dur_ms)), where alias is the as <alias> name of a non-root row. A child aggregate means the same in both positions — max($db._dur_ms) equals the child row's own max(_dur_ms). What the root form adds is the ability to combine values from different rows in a single expression — something a child row cannot do on its own, since it only sees its own spans. For example, the total time a trace spends in the database and downstream RPC calls combined:
root: count() | sum($db._dur_ms) + sum($rpc._dur_ms) as backend_time_ms | group by _group_id
db:all as db:
rpc:all as rpc:
sum($db._dur_ms) and sum($rpc._dur_ms) are each computed on their own side of the join, then added in the root. A single expression may reference several joins at once like this, as long as each aggregate stays within one alias. The join is always on trace id, so each $alias.attr only sees spans in the same trace as the root span.
To combine a child aggregate with a root one — a trace's duration, max($db._time) - min(_time) — the expression is evaluated per trace and then merged across the cell; see Per-trace expressions.
How Child Values Are Aggregated
A child row is evaluated as a subquery grouped by trace id, so every selector is first computed per trace — count() is the matching-span count in one trace, max(_dur_ms) the slowest span in one trace.
The result table is then grouped by the root's group by, and one result cell can span many traces. A child selector is re-aggregated across them with its own merge: $child.count() is the total matching spans across the cell's traces, $child.max(_dur_ms) the slowest anywhere in the cell, $child.p90(_dur_ms) the merged percentile. A child aggregate therefore means the same as the matching root cross-join expression — child: sum(_dur_ms) equals sum($child._dur_ms).
A cross-join assumes one root span per trace — the default root row matches root spans only, and each child row excludes them. If a trace has several root spans (a malformed or duplicated trace), its child values are joined to each root span, so additive aggregates (sum, count, avg, percentiles) over-count; idempotent ones (min, max, any, uniq) are unaffected. The per-trace expressions below are the exception — they count each trace exactly once regardless.
To merge the per-trace values with a different aggregate than the selector's own, wrap it as f(innerAgg()). The inner aggregate runs per trace; the outer f merges those per-trace values:
| Wrapper | Across the cell's traces |
|---|---|
sum(count()) | total matching spans — same as bare count() |
max(count()), min(count()) | the most / fewest in any one trace |
avg(count()) | mean per trace |
count(count()) | number of traces in the cell |
any(count()) | one representative trace's count (arbitrary when a cell holds several) |
f must be one of any, min, max, sum, avg, count; an unsupported wrapper such as p50(count()) is rejected. Rate and scaling functions (perMin, perSec, rate) wrap a child aggregate too — perMin(count()) is the per-minute rate across the cell.
Reading the common shapes:
spans:all as child: count()— the total matching-span count across the cell's traces (a cell whose two traces have 3 and 2 spans shows5). Wrap asany(count())for one representative trace, ormax(count())for the busiest.spans:all as child: count() | group by _group_id— the childgroup byadds a$child._group_idoutput dimension, so each row is one (root group × child operation).root: max($child._time) - min(_time)— a compound that mixes a child aggregate with a root one is evaluated per trace (roughly the trace's duration), then merged across the cell; see Per-trace expressions.
Per-Trace Expressions
A child aggregate and a root aggregate can be combined in one expression — most usefully a trace's own duration, the gap between its root start and its latest child span:
root: max($child._time) - min(_time) | group by _group_id
spans:all as child:
Such a mixed expression is evaluated per trace — for each trace, max($child._time) is that trace's latest child time and min(_time) its own root start — and the per-trace values are then merged across the cell's traces:
- bare, or wrapped in
any(...)— one representative trace's value (exact for a single-trace cell, arbitrary otherwise). max(...)/min(...)— the longest / shortest such value in the cell.max(max($child._time) - min(_time))is the slowest trace's duration.sum(...)/avg(...)— the total / average across the cell's traces, each trace counted once.sum(count($child) + count())totals the child and root spans of every trace in the group.
The value is computed in a two-level subquery grouped by (cell, trace), so each trace is counted exactly once — which is what makes sum and avg fan-out-exact here rather than over-counted. Valid outers are any (the bare default), anyLast, min, max, sum, and avg; count / countAll, percentile and state aggregates (p90, median, quantile, uniq), and top3 / apdex are not valid outers over a per-trace value. The compound may reference only one join alias, and its child aggregate must be idempotent (min, max, any) or additive (sum, count($child)) — a state, percentile, or ratio child aggregate (avg, p90, median, uniq) or a rate wrapper (perMin) cannot be nested in the arithmetic. The root aggregate has no such limit: it renders as its natural per-trace aggregate and may be predicated, e.g. minIf(_time, _kind = "server").
Supported Aggregates
A cross-join reference must appear inside an aggregate — min($db._dur_ms), not a bare $db._dur_ms — because a trace can contain many matching child spans that must be reduced to a single value per group. The one exception is count($db) / countAll($db), which takes the alias with no attribute: it counts the child's spans, so there is nothing to reduce. The following aggregates can be merged across a join:
| Aggregate | Example | Description |
|---|---|---|
min, max | max($db._dur_ms) | Smallest / largest child value |
sum | sum($db._dur_ms) | Total of a child value across the group |
count, countAll | count($db) | Total child spans in the same trace, summed across the group. The only form that takes a bare $alias with no attribute; equals the child row's own count(). |
countIf | countIf($db._status_code = "error") | Number of child spans matching a predicate, evaluated against the child spans. For an unconditional total use count($db). |
avg | avg($db._dur_ms) | Average child value |
median, p50, p75, p90, p99 | p99($db._dur_ms) | Child value percentiles |
quantile | quantile(0.95, $db._dur_ms) | Arbitrary child quantile |
uniq, countDistinct | uniq($rpc.service_name) | Number of distinct child values |
any, anyLast | any($db.db_statement) | A representative child value |
Conditional *If combinators work too, with the predicate evaluated against the child spans:
root: count() | countIf($db._status_code = "error") as failed_queries | group by _group_id
db:all as db:
Aggregates that cannot be merged correctly across the multiple traces a group may span are rejected: top3 / top10 and apdex. A compound expression that mixes a child aggregate with a root one — max($db._time) - min(_time) — is instead evaluated per trace; see Per-trace expressions.
Child Columns as Output
Beyond plain selectors, a group by in a child row is also exposed to the root — it becomes an extra output dimension, so the result splits into one row per (root group × child group):
root: count() | group by _group_id
db:all as db: sum(_dur_ms) as db_time | group by service_name
The result has a row per (_group_id, $db.service_name) with a $db.db_time column — the database time of that service for each root group, totalled across the cell's traces.
Restrictions
A single cross-join aggregate is pushed down into one child subquery, which constrains what it may contain:
| Not allowed | Example | Why |
|---|---|---|
| Referencing two aliases in one aggregate | minIf($db._time, $rpc._name = "x") | An aggregate can reference only one join alias. |
| Mixing a root attribute into the aggregate | minIf($db._time, service_name = "x") | Move the root condition to a separate where. |
| Nesting aggregates | min(max($db._time)) | The inner aggregate cannot run inside the child subquery. |
| A type-mismatched argument | sum($db._name) | sum needs a number; _name is a string. |
Examples
Traces with Many Child Spans
Find traces that contain more than 1000 child spans, which can indicate runaway loops or excessive instrumentation:
root: perMin(count()) | quantiles(_dur_ms) | _error_rate | group by _group_id
spans:all as db: count() | having count() > 1000
Traces with the Number of Database Queries
Return each group along with how many database queries its traces contain in total — a bare count() already totals across the cell's traces:
root: perMin(count()) | quantiles(_dur_ms) | _error_rate | group by _group_id
db:all as db: count()
To compute the same total inline in the root — without adding a child selector — reference the alias with no attribute: count($db). This is the one cross-join aggregate that takes a bare $alias, and it is handy when you want to combine the child count with a root value in a single expression.
Traces with Multiple Database Queries
Find traces that contain at least 2 PostgreSQL queries:
root: perMin(count()) | quantiles(_dur_ms) | _error_rate | group by _group_id
db:postgresql as pg: having count() >= 2
This is useful for identifying N+1 query problems or traces with excessive database calls.
Traces with Slow Service Calls
Find traces where a specific service takes longer than 1 second to respond:
root: perMin(count()) | quantiles(_dur_ms) | _error_rate | group by _group_id
rpc:all as rpc: where service_name = "foo" | where _kind = "server" | where _dur_ms >= 1000
Traces with Error Logs
Find traces that contain error logs mentioning "timeout":
root: perMin(count()) | quantiles(_dur_ms) | _error_rate | group by _group_id
log:error as err: _display_name contains "timeout"
Traces with Errors in a Specific Service
Find traces where a particular service returned an error:
root: perMin(count()) | quantiles(_dur_ms) | _error_rate | group by _group_id
rpc:all as rpc: where service_name = "payment-service" | where _status_code = "error"
Traces with Slow Root Spans
Find traces where the root span exceeds 5 seconds:
root: where _dur_ms >= 5000
Combining Multiple Conditions
Find traces that are slow and contain database errors:
root: where _dur_ms >= 3000
db:all as db: where _status_code = "error"
This selects traces where the overall duration exceeds 3 seconds and at least one database span has an error status.
Slowest Database Query per Group
Add the slowest database query across each group's traces. A bare max(_dur_ms) already merges with max across the cell's traces, so no wrapper is needed:
root: count() | group by _group_id
db:all as db: max(_dur_ms) as slowest_query_ms
Total Database Time per Group
Sum the database time of every query across a group's traces, next to the root duration. A bare sum(_dur_ms) totals it across the cell's traces, each trace counted once:
root: count() | p50(_dur_ms) as p50_total_ms | group by _group_id
db:all as db: sum(_dur_ms) as db_time_ms
A large $db.db_time_ms relative to p50_total_ms points at database-bound groups.
Distinct Downstream Services per Group
Count the distinct downstream services each group fans out to across its traces. uniq unions across the cell's traces, so the count is the distinct services seen anywhere in the group (the child form rpc:all as rpc: uniq(service_name) is equivalent):
root: count() | uniq($rpc.service_name) as downstream_services | group by _group_id
rpc:all as rpc:
Error Logs per Group
Total the error logs across a group's traces — a bare count() already sums across them:
root: count() | _error_rate | group by _group_id
log:error as err: count() as error_logs
N+1 Query Detection
Filter to traces that issue many queries — the child having is evaluated per trace — and report the worst trace's query count with the max(count()) wrapper:
root: count() | group by _group_id
db:all as db: max(count()) as max_queries | having count() >= 10
The having keeps only traces with at least 10 database spans; $db.max_queries is the largest per-trace query count among the qualifying traces in each group.
Slowest Trace Duration per Group
Combine a child aggregate with a root one to get each trace's duration — its latest child span minus its root start — then take the slowest in each group with the max(...) outer:
root: count() | max(max($child._time) - min(_time)) as slowest_trace_ms | group by _group_id
spans:all as child:
The inner max($child._time) - min(_time) is evaluated per trace; max(...) merges those durations across the cell. Use any(...) instead for a representative trace rather than the slowest. See Per-trace expressions.
Total Spans per Group
Count every span a group's traces emit — root spans plus all their children — by adding the child row count to the root count per trace, then summing across the group:
root: sum(count($child) + count()) | group by _group_id
spans:all as child:
count($child) is the child span count of one trace and count() its root span count, so count($child) + count() is that trace's total. The sum(...) outer adds those per-trace totals across the group, counting each trace once. A large value relative to the trace count signals broad fan-out or chatty instrumentation. This is a per-trace expression — sum and avg are exact here because the per-trace value is computed one row per trace.
Database Query Rate per Group
Report how many database queries per minute each group runs across its traces, using a rate function over the child count:
root: perMin(count()) | group by _group_id
db:all as db: perMin(count()) as queries_per_min
perMin (and perSec, rate) merges the per-trace counts across the cell, then divides by the query's time window.
Available Clauses
Each row — both root and child — supports the full span query language including filters, aggregations, and groupings:
| Clause | Example | Description |
|---|---|---|
where | where service_name = "foo" | Filter spans by attribute values |
where | where _dur_ms >= 1000 | Filter by span duration |
where | where _status_code = "error" | Filter by status code |
where | where _kind = "server" | Filter by span kind |
where | where _display_name contains "text" | Filter by display name |
group by | group by _group_id | Group spans by attribute |
group by | group by service_name | Group by service |
| Aggregates | count(), perMin(count()) | Count and rate aggregations |
| Aggregates | p50(_dur_ms), quantiles(_dur_ms) | Duration percentiles |
having | having count() >= 2 | Filter by aggregated span count |
having | having p99(_dur_ms) >= 500 | Filter by percentile duration |
The root row additionally supports cross-join expressions (min($alias._dur_ms)) that aggregate a child row's spans within the same trace.
Multiple clauses can be chained with the pipe | operator:
rpc:all as rpc: where service_name = "foo" | where _kind = "server" | where _dur_ms >= 1000
See Also
- Querying spans and logs - Query language fundamentals
- Searching spans and logs - Simpler search syntax
- Grouping and systems - How span systems work