Querying spans
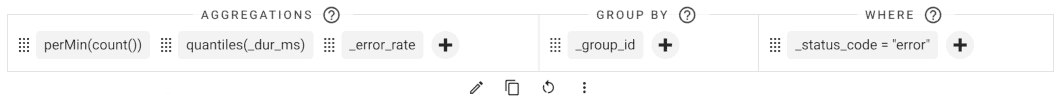
Uptrace provides a powerful querying language that enables you to filter, group, and aggregate your observability data effectively. The query language supports filters (where _status_code = "error"), grouping (group by _group_id), and aggregates (p50(_dur_ms)).
Prerequisites for Effective Querying
To write useful and performant queries, you need to pre-process raw data to ensure it has a well-defined structure. You can achieve this by:
- Recording contextual information in span attributes and events
- Using structured logging for logs
For searching over spans and logs (as opposed to complex querying), Uptrace supports a more concise syntax described in the searching documentation.
Query Language Components
Identifiers
Identifiers are unquoted strings that reference span fields, attributes, and extract values from JSON. Examples include _name, _display_name, and _dur_ms.
Important: Span fields start with an underscore to distinguish them from attributes.
Built-in Span Fields
The following table lists all built-in span fields available for querying:
| Span Field | Description |
|---|---|
_id | Unique span identifier |
_parent_id | Parent span identifier |
_trace_id | Trace identifier |
_name | Span operation name (used for grouping) |
_event_name | Event name (for span events) |
_display_name | Display name when _name is not enough. |
_kind | Span kind (client, server, etc.) |
_dur_ms | Span duration in milliseconds (float64) |
_time | Span start time (microseconds accuracy) |
_status_code | Span status code (ok, error, unset) |
_status_message | Span status message |
Attribute Names
Attribute names are normalized by replacing dots with underscores. Common examples include:
| Attribute Name | Description |
|---|---|
display_name | display.name attribute |
service_name | OpenTelemetry service.name attribute |
Data Types
Uptrace supports the following attribute types, each with specific comparison operators:
| Attribute Type | Supported Comparison Operators |
|---|---|
str | =, in, like, contains, ~ (regexp), exists |
int and float | =, <, <=, >, >=, exists |
bool | =, != |
[]str | contains, exists |
Type Specification
While type discovery is automatic, you can explicitly specify types when needed:
foo::string | bar::int | baz::float
For attributes with mixed types across spans (not recommended), you can query multiple types:
foo::string | foo::int
Note: Uptrace uses type information as a hint for reading columnar data, not for type conversion.
Units
Specify attribute units by adding the unit name as a suffix to improve data interpretation and readability:
| Attribute | Unit |
|---|---|
http_read_bytes | bytes |
request_dur_ms_seconds | seconds |
elapsed_milliseconds | milliseconds |
memory_utilization | utilization |
If you cannot modify the attribute name, use aliases in queries:
sum(heap_size) as heap_size_bytes
String Literals
Strings can be defined using single quotes, double quotes, or backticks:
"I'm a string\n"           -- Double quotes with escape sequences
'I\'m a string\n'          -- Single quotes with escape sequences
`^some-prefix-(\w+)$`      -- Backticks (no escape sequences, useful for regex)
Query Clauses
Filtering with WHERE
Use where clauses to filter spans and events by their attributes. The following examples demonstrate common filtering patterns:
| Filter Example | Description |
|---|---|
where _status_code = "error" | Filter spans with error status (case-sensitive) |
where _display_name like "hello%" | Filter span names starting with "hello" (case-insensitive) |
where _display_name like "%hello" | Filter span names ending with "hello" (case-insensitive) |
where _display_name contains "hello" | Filter span names containing "hello" (case-insensitive) |
where _display_name contains "foo|bar" | Same as _display_name contains "foo" OR _display_name contains "bar" |
where _dur_ms > 1ms | Duration greater than 1 millisecond (equivalent to _dur_ms > 1000) |
where http_request_content_length > 1kb | Content length greater than 1 kilobyte (equivalent to http_request_content_length > 1024) |
where foo exists | Filter spans that have the foo attribute |
Supported Units in Filters
- Time units:
μs(microseconds),ms(milliseconds),s(seconds) - Size units:
kb(kilobytes),mb(megabytes),gb(gigabytes),tb(terabytes)
Filtering Results with HAVING
Use having to filter aggregated query results after grouping:
group by service_name | having p50(_dur_ms) > 100ms
Searching
You can use search to filter query results using a simpler syntax:
search foo|bar -hello
This approach is more concise than complex where clauses for basic text matching.
Grouping with GROUP BY
Group spans using group by clauses, similar to SQL. The following examples show common grouping patterns:
| Example | Description |
|---|---|
group by _group_id | Groups similar spans together |
group by host_name | Groups spans by the host_name attribute |
group by service_name, service_version | Groups spans by combination of service_name and service_version |
group by lower(attribute) | Groups by lowercase value of attribute |
extract(host_name, `^server-(\w+)$`) as host | Extracts and groups by a fragment from host_name |
You can use any transformation function in the group by clause to modify values before grouping.
Functions
Aggregate Functions
Aggregate functions perform calculations on sets of values and return single values. They are commonly used with grouping to summarize data.
| Function | Example | Description |
|---|---|---|
count | count() | Number of matched spans/logs/events |
any | any(_name) | Any (random) span name |
anyLast | anyLast(_name) | Any last span name |
avg | avg(_dur_ms) | Average span duration |
min, max | max(_dur_ms) | Minimum/maximum span duration |
sum | sum(http_request_content_length) | Total sum of values |
p50, p75, p90, p99 | p50(_dur_ms) | Span duration percentiles |
top3, top10 | top3(code_function) | Top N most popular values |
uniq | uniq(http_client_ip) | Number of unique values |
apdex | apdex(500ms, 3s) | Apdex score |
Conditional Aggregates
Uptrace supports ClickHouse if combinator on aggregate functions for conditional calculations:
countIf(_status_code = "error")- Count spans with error statusp50If(_dur_ms, service_name = "service1")- P50 duration for specific service
Virtual Columns
Uptrace provides shortcuts for common aggregations to simplify queries:
| Virtual Column | Equivalent Expression |
|---|---|
_error_rate | countIf(_status_code = "error") / count() |
Transform Functions
Transform functions accept a value and return a new value for each matched span/log/event. These functions are useful for data manipulation and formatting.
| Function | Example | Description |
|---|---|---|
lower | lower(log_severity) | Converts string to lowercase |
upper | upper(log_severity) | Converts string to uppercase |
perMin | perMin(count()) | Divides value by the number of minutes in the time interval |
perSec | perSec(count()) | Divides value by the number of seconds in the time interval |
trimPrefix(str, prefix) | trimPrefix(str, "prefix") | Removes the specified leading prefix string |
trimSuffix(str, suffix) | trimSuffix(str, "suffix") | Removes the specified trailing suffix string |
extract(haystack, pattern) | extract(host_name, ^uptrace-prod-(\w+)$) | Extracts a fragment using regular expression |
replace(haystack, substring, replacement) | replace(host_name, 'uptrace-prod-', '') | Replaces all occurrences of substring |
replaceRegexp(haystack, pattern, replacement) | replaceRegexp(host, `^`, 'prefix ') | Replaces all occurrences matching regular expression pattern |
arrayJoin | arrayJoin(db_sql_tables) | See ClickHouse arrayJoin |
parseInt64 | parseInt64(str_with_int) | Parses string as 64-bit integer |
parseFloat64 | parseFloat64(str_with_float) | Parses string as 64-bit float |
parseDateTime | parseDateTime(str_with_time) | Parses string as date with time |
Time Rounding Functions
Time rounding functions are particularly useful for time-series analysis and creating time-based aggregations:
| Function | Description |
|---|---|
toStartOfDay | Rounds down to start of day |
toStartOfHour | Rounds down to start of hour |
toStartOfMinute | Rounds down to start of minute |
toStartOfSecond | Rounds down to start of second |
toStartOfFiveMinutes | Rounds down to start of 5-minute interval |
toStartOfTenMinutes | Rounds down to start of 10-minute interval |
toStartOfFifteenMinutes | Rounds down to start of 15-minute interval |
Complete Query Examples
You can combine filters, grouping, and aggregates to create powerful queries for comprehensive observability analysis.
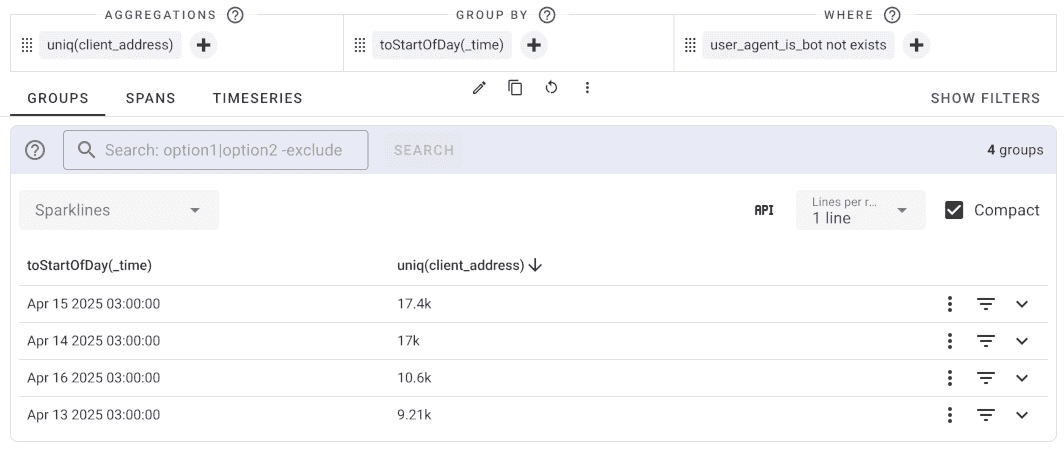
Daily Unique Visitors (Excluding Bots)
where user_agent_is_bot not exists | uniq(client_address) | group by toStartOfDay(_time)
This query identifies unique visitors per day while excluding bot traffic.
Error Rate by Service
group by service_name | having count() > 100 | select service_name, _error_rate
This query calculates error rates for services with significant traffic (more than 100 requests).
Top 10 Slowest Operations
where _dur_ms > 100ms | group by _name | top10(_name)
This query identifies the slowest operations based on 99th percentile duration.
Query Performance Optimization
If your queries are taking too long to complete, apply these optimization strategies to improve performance:
Narrow the Time Range
- Select shorter time periods when possible (e.g., "Last 1 hour" instead of "Last 24 hours")
- Consider the data volume when selecting time ranges
Use System Filters
- Select specific systems when analyzing particular types of requests
- Example: Select
httpserver:allsystem for HTTP request analysis - This reduces the data scope significantly
Add Group Filters
- Further narrow scope with
_group_idfilters - Example:
where _group_id = 123456789 - Group filters are highly efficient for targeted analysis
Leverage Indexed Attributes
- Use OpenTelemetry semantic conventions for attribute names
- Uptrace optimizes certain attributes better than others
- Indexed attributes provide faster query performance
Query Structure Best Practices
- Apply filters before grouping when possible to reduce data volume
- Use specific filters rather than broad pattern matching
- Limit the number of groups in
group byclauses - Consider using
havingclauses to filter aggregated results
Common Query Patterns
Error Analysis
-- Find error patterns by service
where _status_code = "error" | group by service_name, _name |
select service_name, _name, count(), p50(_dur_ms)
Performance Monitoring
-- Monitor slow requests across services
where _dur_ms > 1s | group by service_name |
select service_name, count(), p95(_dur_ms), p99(_dur_ms)
Traffic Analysis
-- Analyze request volume over time
group by toStartOfHour(_time), service_name |
select _time, service_name, count() as request_count
See Also
- Searching spans and logs - For simpler search syntax
- OpenTelemetry Semantic Conventions - For optimized attribute naming
- Grouping Strategies - Advanced grouping techniques