Top 10 Website Monitoring Tools: Open Source & Commercial [2026]
Website monitoring tools track uptime, performance, and reliability of web applications and APIs. The right tool depends on your stack: open-source options give full control with no vendor lock-in, while commercial platforms offer managed infrastructure and support. This guide covers the best options for 2026 — from lightweight uptime checkers to full-stack observability platforms.
What to Look For
- Uptime monitoring — HTTP checks, ping, TCP/UDP port monitoring with configurable intervals
- Performance tracking — response time, TTFB, Core Web Vitals
- Alerting — multi-channel notifications (email, Slack, PagerDuty, webhooks)
- OpenTelemetry support — vendor-neutral instrumentation, now standard in modern stacks
- Distributed tracing — end-to-end request visibility across microservices
- Self-hosted option — for teams with data residency or cost requirements
Quick Comparison
| Tool | Type | License | Best For | Pricing |
|---|---|---|---|---|
| Uptrace | Full-stack APM | AGPL / Commercial | OTel-native traces, metrics, logs | Free (self-hosted) / Cloud |
| Uptime Kuma | Uptime monitoring | MIT | Simple self-hosted uptime checks | Free |
| Prometheus + Grafana | Metrics + dashboards | Apache 2.0 | Infrastructure and custom metrics | Free (self-hosted) |
| Zabbix | Enterprise monitoring | AGPL | Large-scale infrastructure monitoring | Free (self-hosted) |
| Better Stack | Uptime + incident mgmt | Proprietary | Teams wanting uptime + status pages | Free tier / from $34/mo monthly or $29/mo annual |
| UptimeRobot | Uptime monitoring | Proprietary | Quickest setup, generous free tier | Free / from $7/mo |
| Datadog | Cloud APM | Proprietary | Cloud-native environments | From $15/host/mo |
| New Relic | Full-stack APM | Proprietary | Comprehensive APM + RUM | Free tier / from $10/user/mo |
| Checkly | Synthetic monitoring | Proprietary | API and browser transaction testing | Free tier / from $20/mo |
| Site24x7 | Cloud monitoring | Proprietary | SMBs needing all-in-one monitoring | From $9/mo |
Open Source & Self-Hosted Tools
These tools give you full control over your data and infrastructure. No vendor lock-in, no usage-based cloud bills — just the infrastructure costs you already pay.
Uptrace
License: AGPL v3 (Open Source) / Commercial
GitHub: https://github.com/uptrace/uptrace
Uptrace is an OpenTelemetry-native APM built on ClickHouse that provides distributed tracing, metrics, and logs in a single platform. Unlike traditional uptime checkers, Uptrace gives full-stack visibility — from the HTTP check that fires your alert to the database query that caused the slowdown.
Best for engineering teams that want complete observability without per-host pricing or vendor lock-in.
- Free open-source version (self-hosted, AGPL)
- Transparent usage-based cloud pricing
- Visit Website ›

Why Choose Uptrace: Uptrace is built on ClickHouse — a columnar database optimized for fast aggregations — which delivers sub-second queries over billions of spans and log lines. The platform is OpenTelemetry-native: any OTel-compatible SDK works without custom agents. A single deployment covers distributed tracing, metrics, and logs in one unified interface, replacing the need for separate tools like Jaeger, Prometheus, and a log aggregator. The self-hosted version is fully free; cloud pricing is usage-based with no per-seat or per-host fees.
Standout Features:
- Distributed tracing — end-to-end request visibility across microservices with trace-to-log correlation
- Metrics and dashboards — Prometheus-compatible metrics ingestion with pre-built dashboards for popular stacks
- Log management — structured log search correlated with spans for fast root-cause analysis
- OpenTelemetry-native — supports all OTel SDKs (Go, Python, Java, Node.js, .NET, Ruby, PHP) without proprietary agents
- Alerting — metric and trace-based alert rules with Slack, PagerDuty, email, and webhook notifications
- Self-hosted or cloud — deploy on your own infrastructure or use Uptrace Cloud
Pros:
- No per-host or per-seat pricing — cost scales with data volume, not team size
- OpenTelemetry-native architecture means no vendor lock-in
- Unified traces + metrics + logs eliminates tool sprawl
- Free self-hosted version with full feature set
Cons:
- Requires OpenTelemetry instrumentation (not a passive agent)
- Not a simple uptime checker — overkill for pure ping monitoring
Pricing: Free (self-hosted, AGPL). Cloud plans are usage-based.
Best for: Teams with microservices or distributed systems that need more than uptime checks.
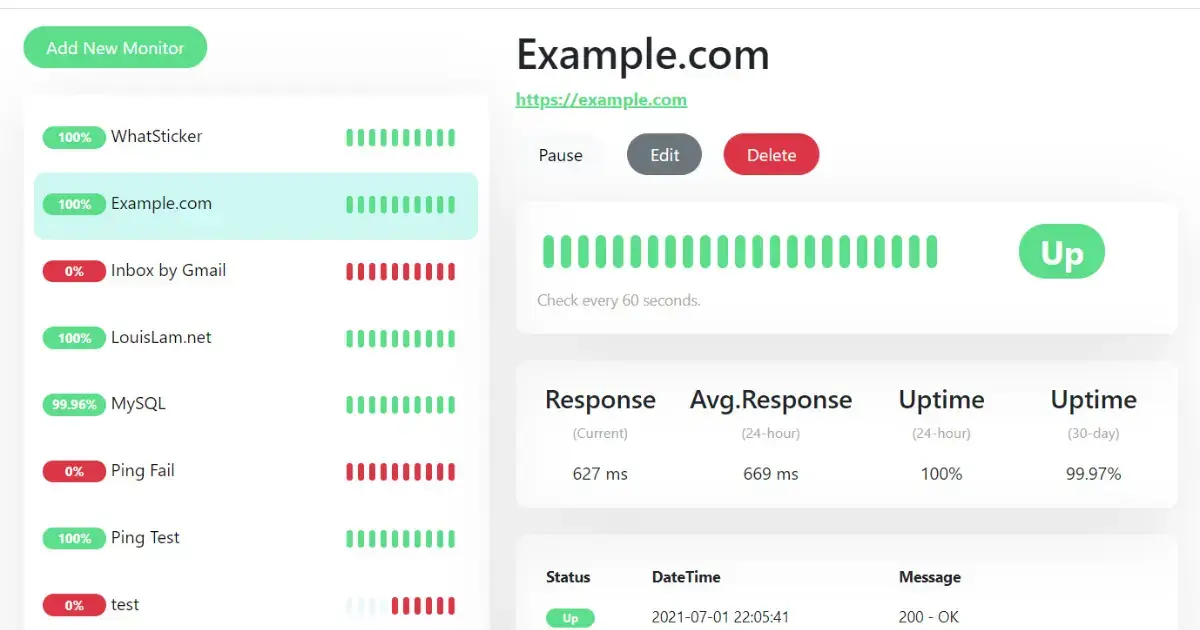
Uptime Kuma
License: MIT
GitHub: https://github.com/louislam/uptime-kuma (51K+ stars)
Uptime Kuma is a self-hosted monitoring tool with a clean web UI. It checks HTTP(s), TCP, DNS, and ping endpoints at configurable intervals and sends alerts via 90+ notification channels including Telegram, Slack, Discord, PagerDuty, and webhooks.
Best for individuals and small teams who want simple self-hosted uptime monitoring without cloud dependencies.
Key Features:
- HTTP(s), TCP, ping, DNS, Steam game server, and Docker container monitoring
- 90+ notification integrations out of the box
- Status page builder with custom domains
- Certificate expiry monitoring
- Response time graphs and uptime history
Pros:
- Completely free and open source (MIT license)
- One-command Docker deployment
- Extremely active community (51K+ GitHub stars)
- No data leaves your infrastructure
Cons:
- No distributed tracing or application-level metrics
- Single-node — no built-in clustering or HA
- Requires self-managed infrastructure
Pricing: Free (self-hosted).
Best for: Developers who want quick self-hosted uptime monitoring for personal projects or small teams.
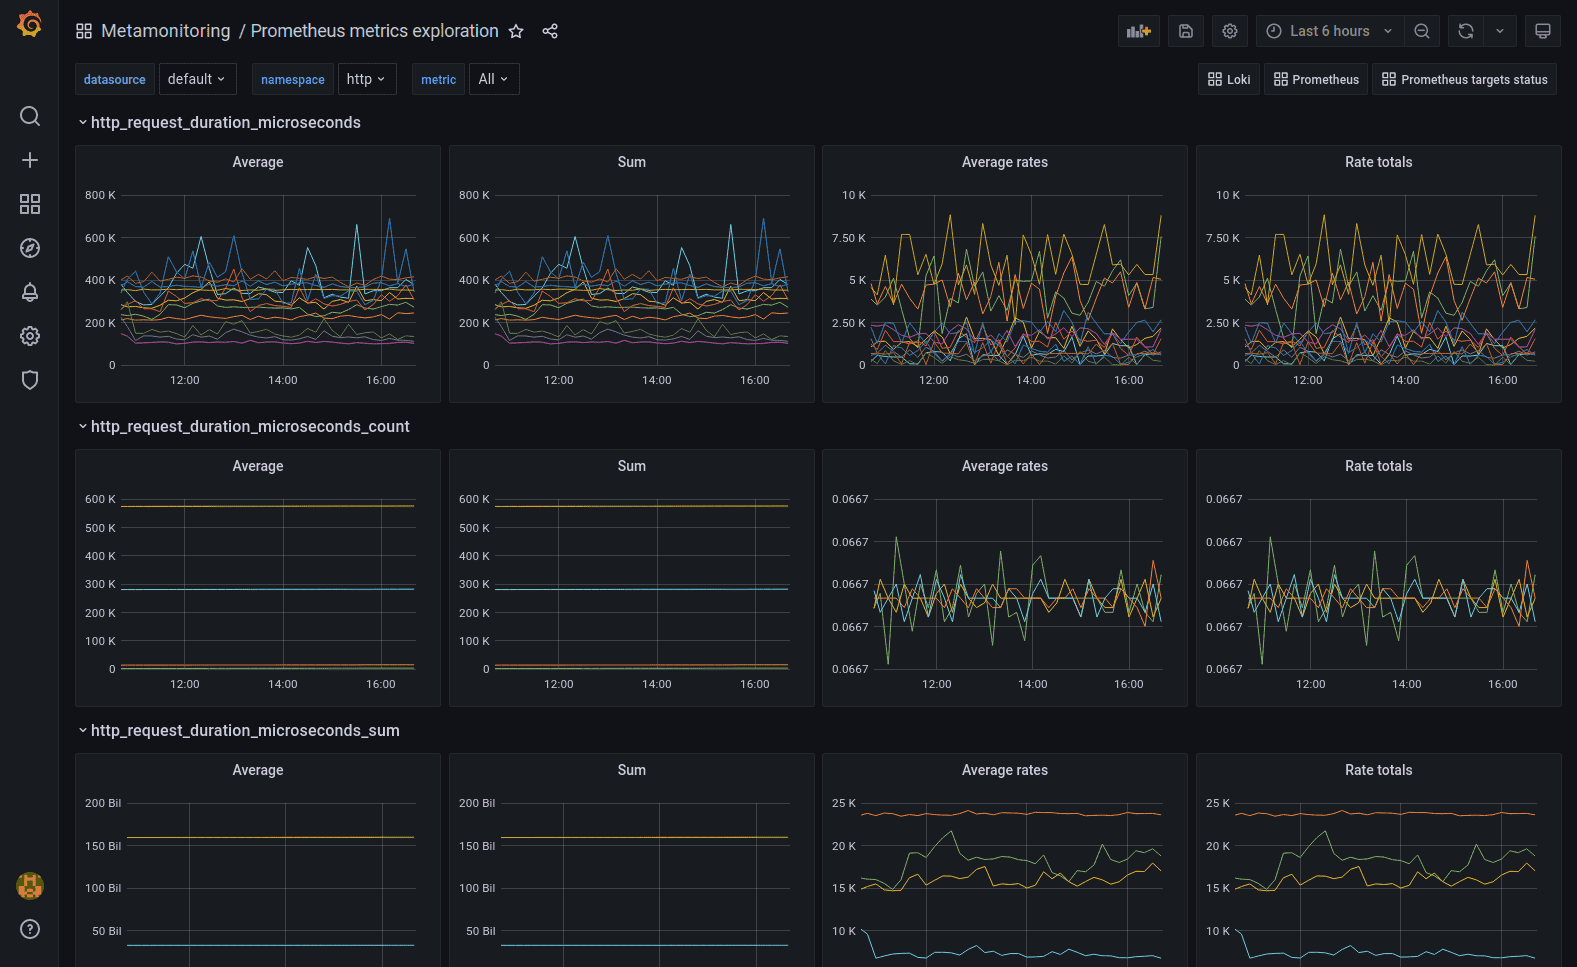
Prometheus + Grafana
License: Apache 2.0
GitHub: prometheus/prometheus (55K+ stars), grafana/grafana (64K+ stars)
Prometheus is the industry-standard metrics collection system, and Grafana is the leading open-source visualization platform. Together they form the most widely deployed open-source monitoring stack in cloud-native environments. Prometheus scrapes metrics from your services and infrastructure; Grafana turns those metrics into dashboards and alerts.
Best for teams already running Kubernetes or cloud-native infrastructure who need flexible, scalable metrics monitoring.
Key Features:
- Pull-based metrics collection with powerful PromQL query language
- 1,000+ official and community exporters for databases, queues, infrastructure, and web services
- Grafana provides rich dashboards, alerting, and multi-source visualization
- Native Kubernetes integration via kube-state-metrics and node-exporter
- Long-term storage via Thanos, Cortex, or VictoriaMetrics
- Blackbox Exporter for HTTP, HTTPS, DNS, and TCP probing
Pros:
- Battle-tested at massive scale (used by cloud providers and Fortune 500)
- Huge ecosystem of exporters and community dashboards
- Both tools are fully open source with no feature paywalls
- Grafana Cloud offers a generous free tier for small teams
Cons:
- Requires significant operational knowledge to run at scale
- Not application-aware — no distributed tracing out of the box
- PromQL has a steep learning curve
Pricing: Free (self-hosted). Grafana Cloud free tier: 10K metrics, 50GB logs, 50GB traces.
Best for: Infrastructure and platform teams with Kubernetes or complex multi-service stacks.
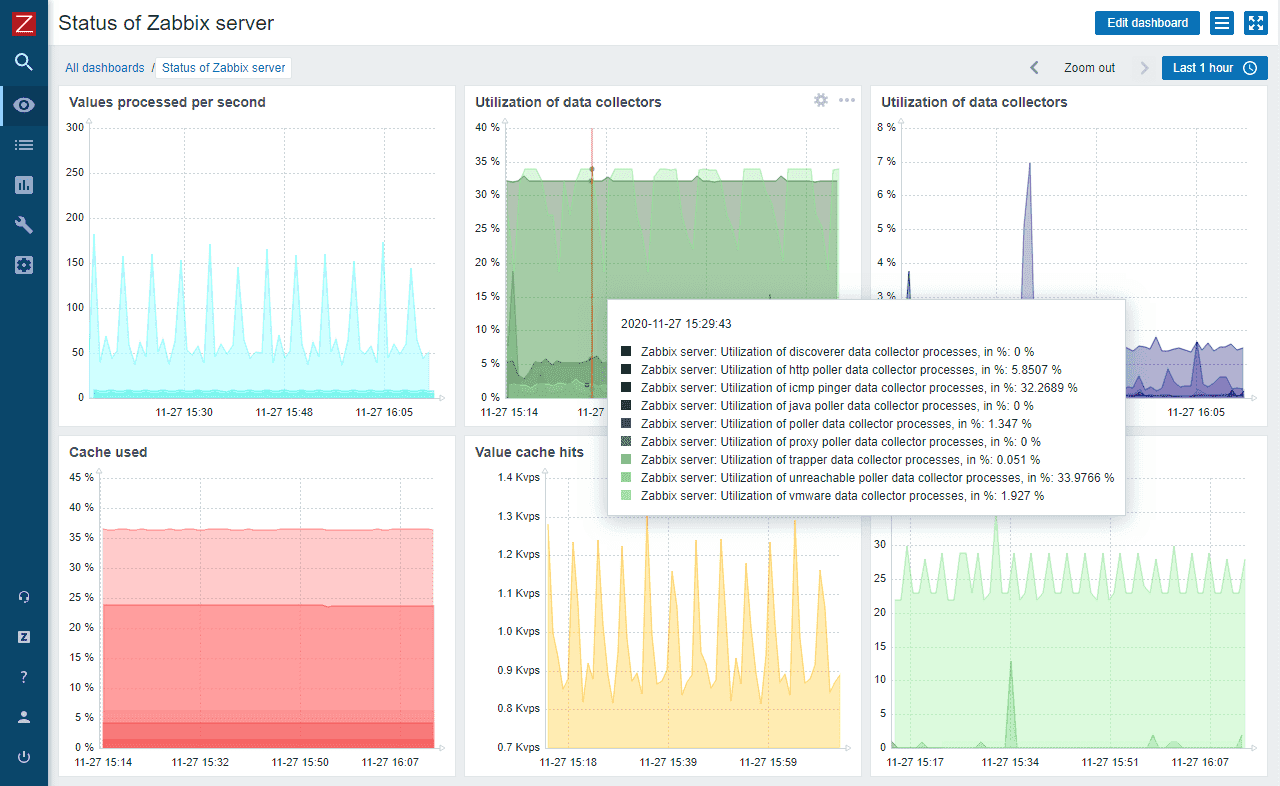
Zabbix
License: AGPL v3
GitHub: https://github.com/zabbix/zabbix
Zabbix is a mature, enterprise-grade open-source monitoring platform covering infrastructure, network, applications, and cloud services. It has been in production use since 2001 and is particularly strong in network and SNMP monitoring — areas where newer tools are weaker.
Best for large enterprise environments monitoring hundreds of servers, network devices, and applications from a single pane of glass.
Key Features:
- Agent-based and agentless monitoring (SNMP, IPMI, JMX, SSH)
- HTTP(s) web scenario monitoring with multi-step transactions
- Distributed monitoring with Zabbix proxy for remote locations
- Auto-discovery of hosts and services
- Templating system with 500+ pre-built templates
- Built-in high availability and clustering
Pros:
- Completely free including enterprise features
- Proven at scale — handles millions of metrics per second
- Strong network and SNMP monitoring (best-in-class among open source tools)
- Active commercial support available from Zabbix LLC
Cons:
- Complex setup and configuration — not beginner-friendly
- UI is dated compared to modern tools
- No native distributed tracing
Pricing: Free (AGPL). Commercial support from Zabbix LLC.
Best for: Enterprise infrastructure teams managing large-scale heterogeneous environments.
For a deeper look at infrastructure-focused tools, see our guide to Top Infrastructure Monitoring Tools.
Uptime Monitoring & Incident Management
These commercial tools focus on one thing: knowing your site is down before your users do. They check from multiple global locations, manage on-call rotations, and publish status pages — all without any infrastructure to maintain.
Better Stack
License: Proprietary
Website: https://betterstack.com
Better Stack combines uptime monitoring, incident management, and status pages in one platform. It monitors websites, APIs, and infrastructure with real checks from 20+ global locations, and provides on-call scheduling and escalation policies built in.
Best for teams that want uptime monitoring tightly integrated with incident management and public status pages.
Key Features:
- HTTP(s), ping, TCP, SMTP, DNS monitoring from 20+ global locations
- On-call scheduling and escalation policies
- Public and private status page builder
- Log management with structured search
- SSL certificate monitoring
- Integration with PagerDuty, Slack, Datadog, and 100+ tools
Pros:
- All-in-one: uptime + incidents + status pages in one subscription
- Clean modern interface
- 10-second check intervals on paid plans
- Free tier is genuinely useful (10 monitors, 3 on-call team members)
Cons:
- No distributed tracing or deep application metrics
- Proprietary — no self-hosted option
- Cost grows with team size
Pricing: Free tier (10 monitors). Paid from $34/month, or $29/month with annual billing.
Best for: Small to mid-size teams that want managed uptime monitoring without self-hosting.
UptimeRobot
License: Proprietary
Website: https://uptimerobot.com
UptimeRobot is the simplest commercial uptime monitoring service. It checks your websites every 5 minutes on the free plan and sends alerts via email, SMS, Slack, webhooks, and more. With 50 free monitors and no credit card required, it is the go-to first uptime monitor for most developers.
Best for developers and small teams who want instant uptime monitoring with zero setup.
Key Features:
- HTTP(s), keyword, ping, port, and heartbeat monitoring
- 5-minute check intervals (free) / 60-second intervals (paid)
- 50 free monitors with no credit card required
- Status page builder
- Integrations: email, SMS, Slack, Telegram, webhooks, PagerDuty
Pros:
- Fastest setup of any tool in this list — under 2 minutes
- 50 monitors free forever
- Reliable and battle-tested (used by millions of sites)
- Simple, no learning curve
Cons:
- 5-minute check interval on free plan (missed fast outages)
- No application-level monitoring or tracing
- Limited customization on free tier
Pricing: Free (50 monitors, 5-min intervals). Paid from $7/month.
Best for: Developers who need a quick, reliable uptime check with no infrastructure to manage.
Enterprise APM & Full-Stack Platforms
These platforms go beyond uptime checks to instrument your application code, correlate traces with infrastructure metrics, and surface the root cause of slowdowns — not just that something is slow.
Looking for a dedicated APM comparison? See our Best APM Tools in 2026 guide.
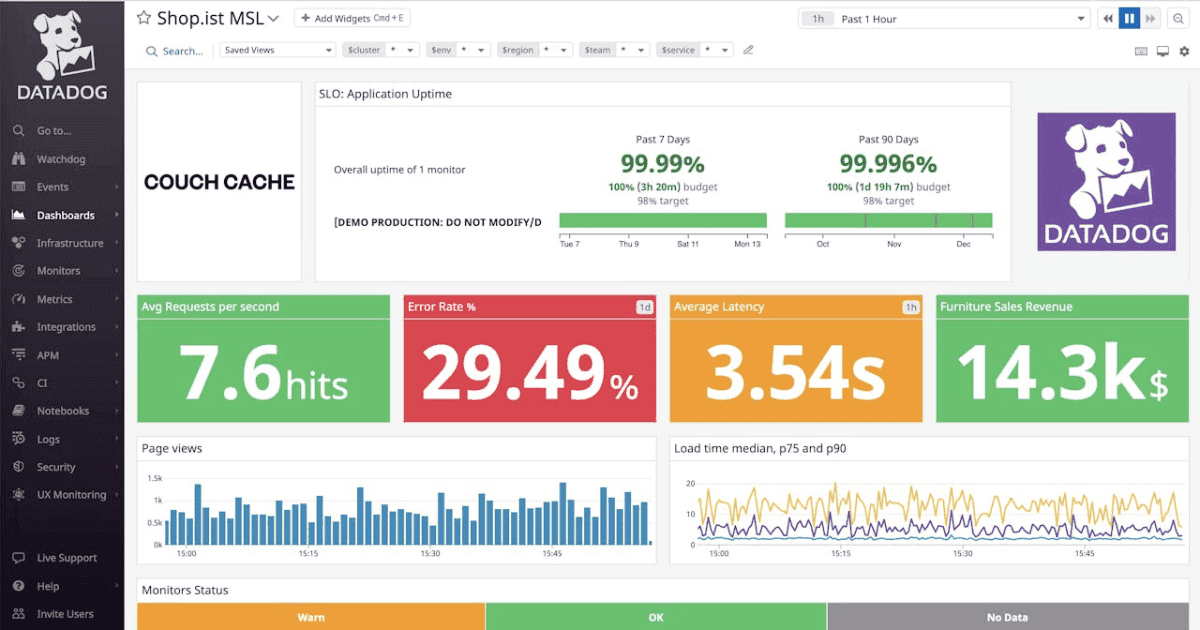
Datadog
License: Proprietary
Website: https://www.datadoghq.com
Datadog is the leading commercial cloud monitoring platform, offering APM, infrastructure monitoring, log management, RUM, and synthetic monitoring in one unified product. It is particularly strong in cloud-native environments and supports 650+ integrations.
Best for cloud-native organizations that need full-stack observability with enterprise-grade support.
Key Features:
- APM with distributed tracing and service maps
- Synthetic monitoring for browser and API transactions
- Real User Monitoring (RUM) for frontend performance
- Infrastructure monitoring for cloud, containers, and on-premise
- Log management with ML-powered anomaly detection
- OpenTelemetry ingestion support (OTLP endpoint)
Pros:
- Best-in-class cloud integrations (AWS, GCP, Azure, Kubernetes)
- Unified platform covers every monitoring use case
- AI-powered anomaly detection and forecasting
- Strong enterprise support and SLA guarantees
Cons:
- Expensive at scale — costs grow rapidly with hosts and data volume
- Proprietary agents required for full functionality
- Complex pricing model is hard to predict
Pricing: From $15/host/month (Infrastructure). APM from $31/host/month.
Best for: Large organizations with complex cloud infrastructure that need a fully managed, enterprise-grade platform.
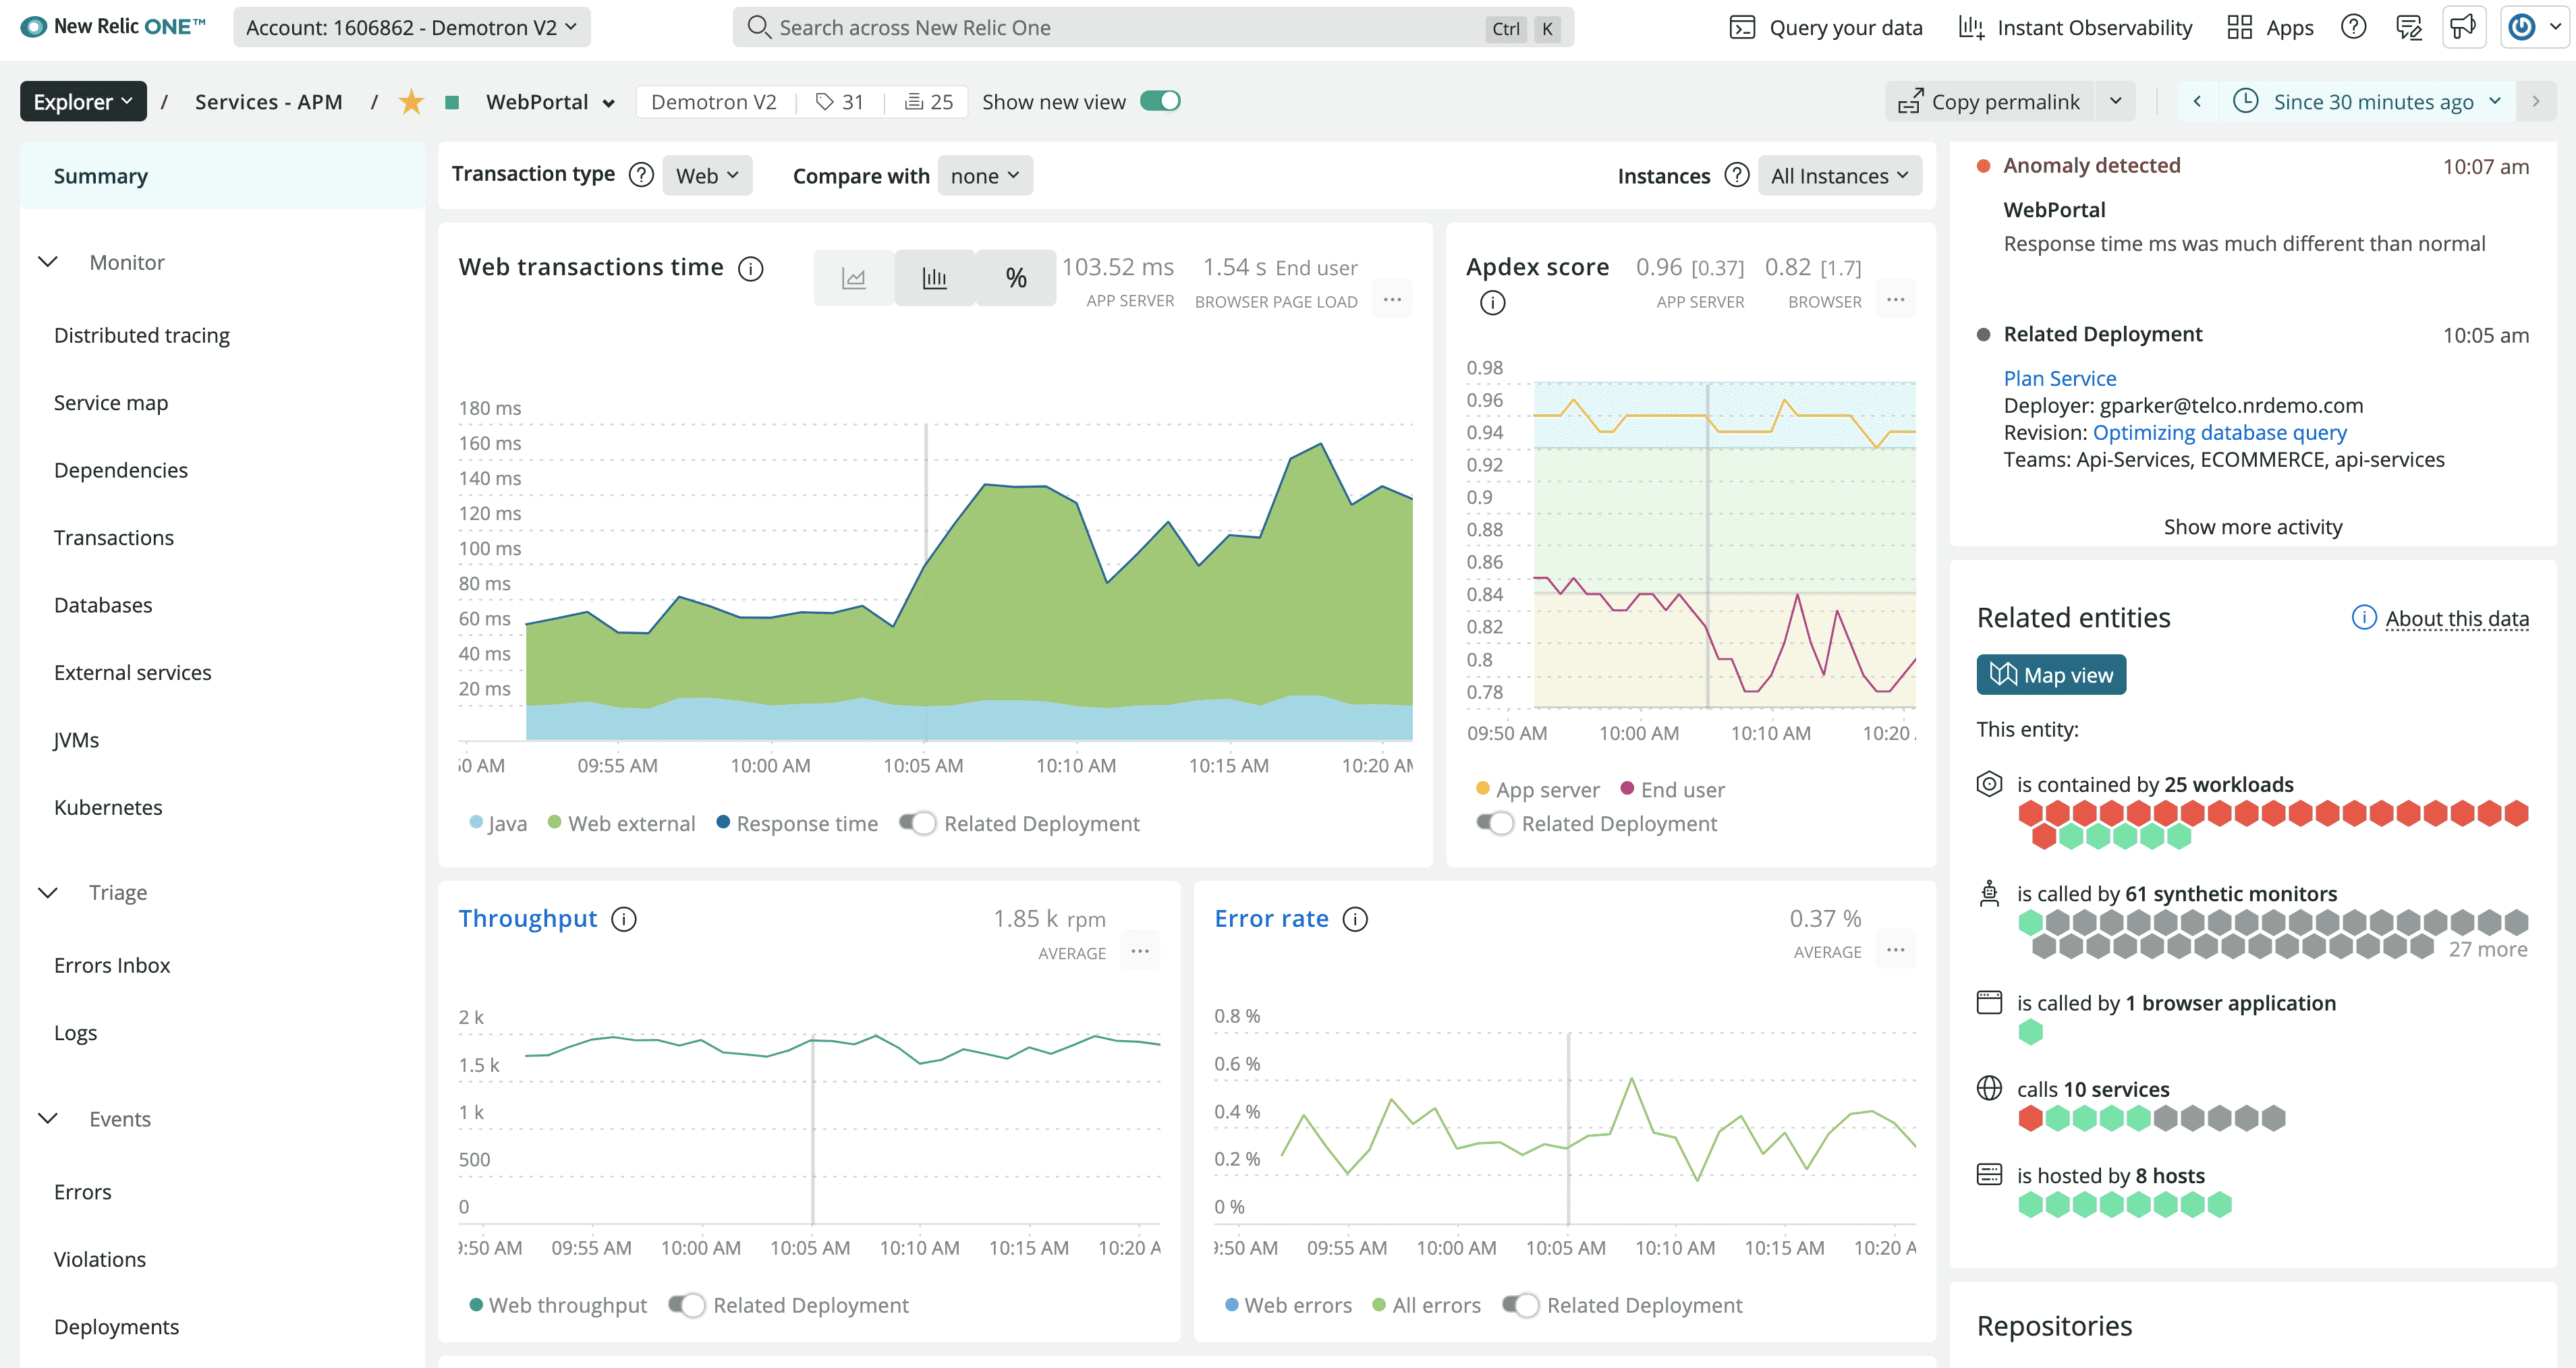
New Relic
License: Proprietary
Website: https://newrelic.com
New Relic provides comprehensive full-stack monitoring covering APM, infrastructure, browser monitoring, mobile, and synthetics. Its generous free tier (100GB/month data ingest, 1 full platform user) makes it accessible for smaller teams, while its enterprise features serve large organizations.
Best for teams that want comprehensive monitoring with a transparent, consumption-based pricing model.
Key Features:
- Distributed tracing with service maps and tail-based sampling
- Browser monitoring with Core Web Vitals tracking
- Synthetic monitoring for API and browser transactions
- Infrastructure monitoring with auto-discovery
- OpenTelemetry-compatible data ingest (OTLP)
- Curated dashboards for 500+ technologies
Pros:
- Generous free tier (100GB/month) — enough for small teams
- Consumption-based pricing is more predictable than per-host models
- Strong RUM and browser performance monitoring
- OpenTelemetry support for vendor-neutral instrumentation
Cons:
- Additional full platform users are expensive ($99/user/month)
- Data retention limited on lower plans
- Can become complex at scale
Pricing: Free tier (100GB/month ingest). Additional original data ingest from $0.40/GB.
Best for: Teams wanting comprehensive APM with a free tier that scales to enterprise.
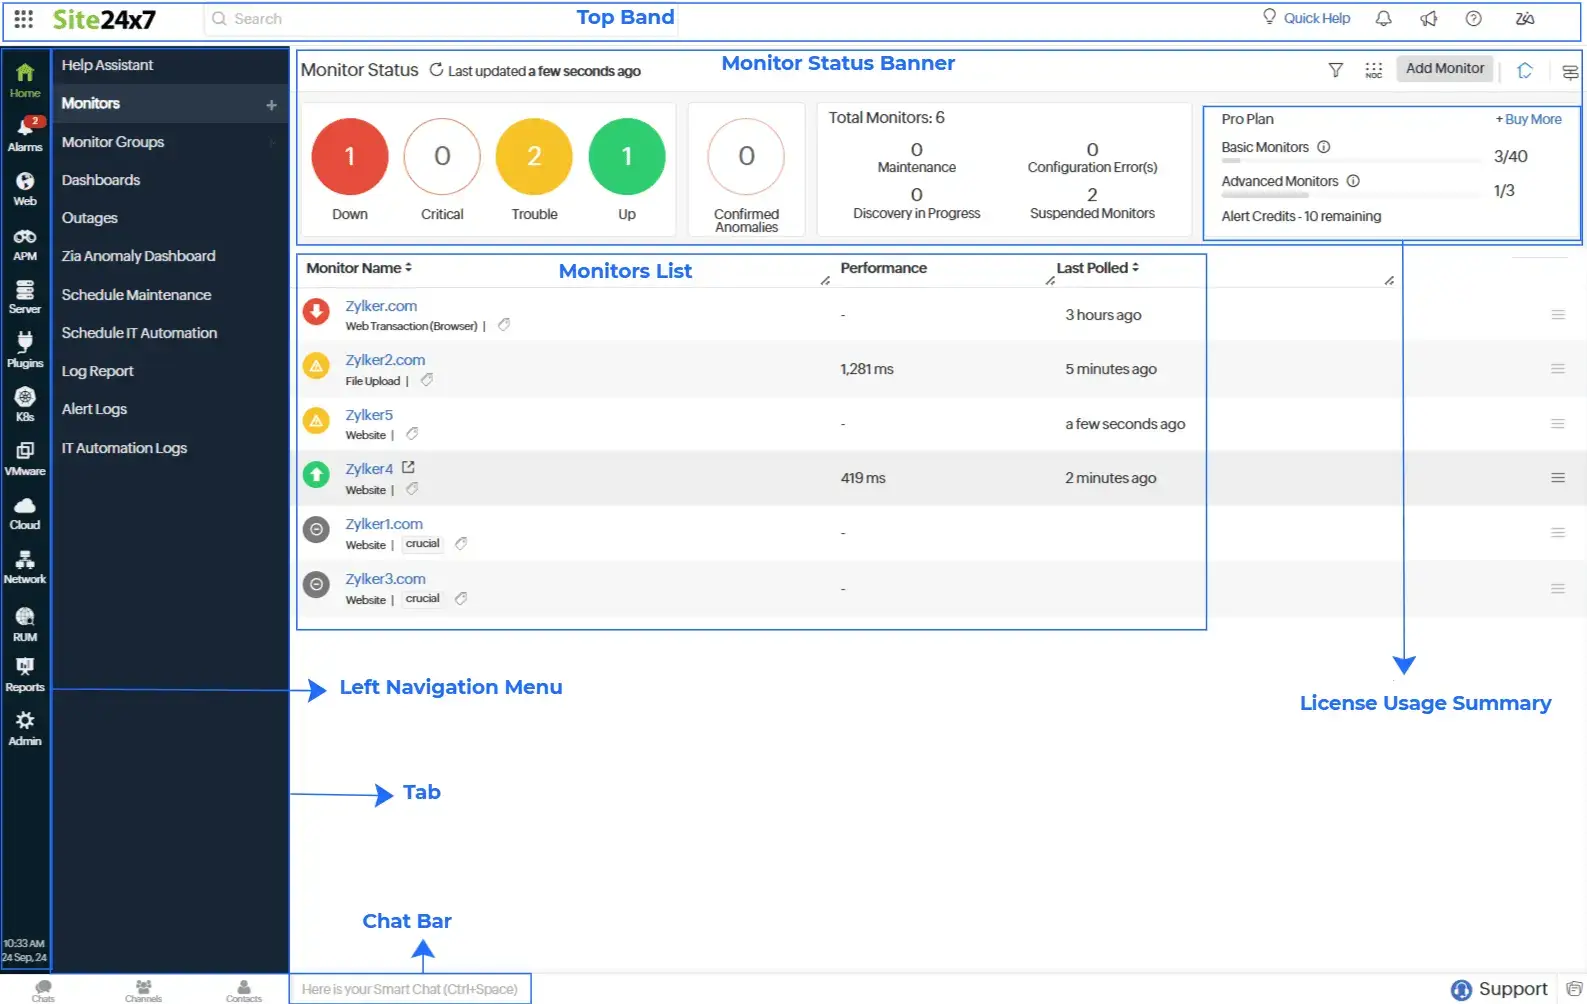
Site24x7
License: Proprietary
Website: https://www.site24x7.com
Site24x7 is a cloud-based monitoring platform from Zoho that covers websites, servers, networks, applications, and cloud services in one subscription. It is one of the most affordable commercial all-in-one monitoring solutions, making it popular with SMBs and managed service providers.
Best for SMBs and MSPs that need broad monitoring coverage at a lower price point than Datadog or New Relic.
Key Features:
- Website monitoring from 130+ global locations
- APM for Java, .NET, PHP, Ruby, Node.js, Python applications
- Infrastructure monitoring for servers, VMs, and containers
- Network monitoring with SNMP and NetFlow
- Real User Monitoring (RUM) for web applications
- AI-powered anomaly detection and forecasting
Pros:
- All-in-one coverage at significantly lower cost than Datadog
- 130+ monitoring locations globally
- Strong network and infrastructure monitoring for traditional IT
- Good mobile app for on-call alerting
Cons:
- UI less polished than modern platforms
- APM features less mature than Datadog or New Relic
- No self-hosted option
Pricing: From $9/month (10 monitors). Full-stack plans from $35/month.
Best for: SMBs and MSPs who need broad monitoring coverage without enterprise-level budgets.
Synthetic Monitoring
Synthetic monitoring runs scripted browser and API checks on a schedule from multiple locations — simulating real user journeys to catch broken flows before your users do.
Checkly
License: Proprietary
Website: https://www.checklyhq.com
Checkly is a developer-first synthetic monitoring platform for APIs and browser-based transactions. It runs Playwright and Puppeteer scripts from 20+ global locations on a schedule, giving continuous visibility into whether your critical user flows actually work — not just whether your server responds.
Best for development teams that need to monitor multi-step user transactions and API contracts in production.
Key Features:
- Browser checks using Playwright (headless Chrome) from 20+ locations
- API monitoring with response time, status, and JSON schema assertions
- Monitoring as Code — define checks in JavaScript alongside your application code
- CI/CD integration — run checks on deploy before promoting to production
- Alert integrations: PagerDuty, Slack, Opsgenie, webhooks
- OpenTelemetry traces for each check run
Pros:
- Playwright-based browser checks = real user experience simulation
- Monitoring as Code fits naturally into developer workflows
- CI/CD integration catches issues before they reach production
- Clear, developer-friendly pricing
Cons:
- Not a general-purpose monitoring tool — focused on synthetic checks only
- No infrastructure or server monitoring
- Can get expensive with many browser checks at short intervals
Pricing: Free tier (10,000 check runs/month). Paid from $20/month.
Best for: Development teams monitoring critical user journeys and API contracts with code-based synthetic tests.
How to Choose
Need open-source with full observability? → Uptrace — traces, metrics, and logs in one platform, free to self-host.
Just need uptime checks, self-hosted? → Uptime Kuma — MIT license, Docker deployment, 90+ alert channels.
Running Kubernetes and need metrics at scale? → Prometheus + Grafana — the industry-standard open-source stack.
Enterprise infrastructure with network monitoring? → Zabbix — mature, AGPL, handles millions of metrics.
Want managed uptime + status pages without self-hosting? → Better Stack or UptimeRobot — both have solid free tiers.
Cloud-native stack with budget for enterprise tooling? → Datadog — best integrations, most complete feature set.
Need to test user flows, not just server responses? → Checkly — Playwright-based synthetic monitoring as code.
SMB or MSP with broad monitoring needs on a budget? → Site24x7 — most coverage per dollar among commercial tools.
FAQ
What is the difference between website monitoring and APM?
Website monitoring typically checks whether your site is reachable (uptime, response time, status codes). APM (Application Performance Monitoring) goes deeper — it instruments your application code to show which functions, database queries, and external calls are slow. Tools like Uptrace, Datadog, and New Relic do both. See our Best APM Tools guide for a dedicated APM comparison.
What is the best free website monitoring tool?
For self-hosted: Uptime Kuma (uptime checks) or Uptrace (full observability). For managed: UptimeRobot offers 50 free monitors with no credit card required, and New Relic provides 100GB/month free data ingest.
What is the best open-source website monitoring tool?
It depends on your needs. For uptime-only: Uptime Kuma. For metrics and dashboards: Prometheus + Grafana. For distributed tracing and full-stack observability: Uptrace. For enterprise infrastructure: Zabbix.
How often should I check my website's uptime?
Every 1–5 minutes is standard. Paid plans on most tools offer 30–60 second intervals for faster outage detection. For critical production services, 30-second intervals reduce mean time to detect (MTTD) significantly.
Can I monitor APIs and not just websites?
Yes. All tools in this list support API endpoint monitoring. For testing complex multi-step API workflows, Checkly is the strongest option. For correlating API errors with traces, Uptrace provides end-to-end visibility.
What OpenTelemetry support should I look for?
Look for OTLP (OpenTelemetry Protocol) ingestion support, meaning you can send traces and metrics from any OTel SDK without installing proprietary agents. Uptrace is fully OTel-native. Datadog and New Relic both support OTLP ingestion alongside their own agents. The OpenTelemetry Collector can forward telemetry from any source to any OTLP-compatible backend.